. 2023 Jun 17;72(3):590-605.
doi: 10.1093/sysbio/syac068.

Modeling the Evolution of Rates of Continuous Trait Evolution

Affiliations

Modeling the Evolution of Rates of Continuous Trait Evolution

Bruce S Martin et al. Syst Biol. .

Abstract

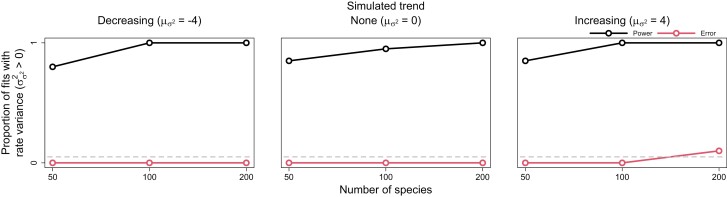
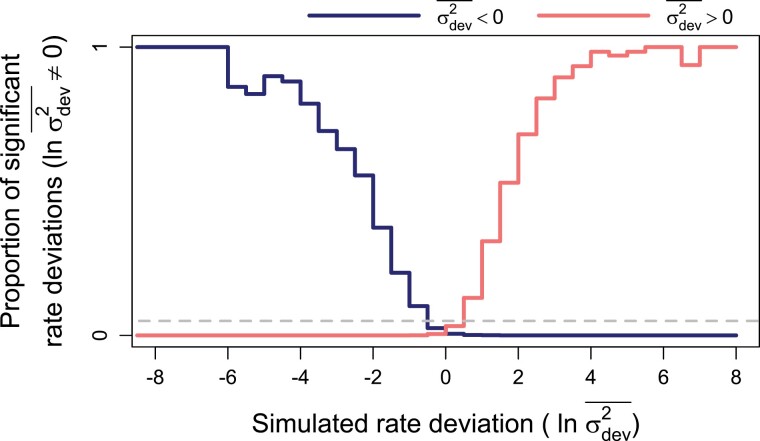
Rates of phenotypic evolution vary markedly across the tree of life, from the accelerated evolution apparent in adaptive radiations to the remarkable evolutionary stasis exhibited by so-called "living fossils." Such rate variation has important consequences for large-scale evolutionary dynamics, generating vast disparities in phenotypic diversity across space, time, and taxa. Despite this, most methods for estimating trait evolution rates assume rates vary deterministically with respect to some variable of interest or change infrequently during a clade's history. These assumptions may cause underfitting of trait evolution models and mislead hypothesis testing. Here, we develop a new trait evolution model that allows rates to vary gradually and stochastically across a clade. Further, we extend this model to accommodate generally decreasing or increasing rates over time, allowing for flexible modeling of "early/late bursts" of trait evolution. We implement a Bayesian method, termed "evolving rates" (evorates for short), to efficiently fit this model to comparative data. Through simulation, we demonstrate that evorates can reliably infer both how and in which lineages trait evolution rates varied during a clade's history. We apply this method to body size evolution in cetaceans, recovering substantial support for an overall slowdown in body size evolution over time with recent bursts among some oceanic dolphins and relative stasis among beaked whales of the genus Mesoplodon. These results unify and expand on previous research, demonstrating the empirical utility of evorates. [cetacea; macroevolution; comparative methods; phenotypic diversity; disparity; early burst; late burst].


Figures

Figure 1.
Figure 1.
Relationship between simulated and estimated rate variance (σσ22) and trend (μσ2) parameters. Each point is the posterior median from a single fit, while the violins are combined posterior distributions from all fits for a given trait evolution scenario. Vertical lines represent the 50% (thicker lines) and 95% equal-tailed intervals (thinner lines) of these combined posteriors, while horizontal lines represent positions of true, simulated values.
Figure 2.
Figure 2.
Power and error rates for the rate variance parameter (σσ22). Lines depict changes in the proportion of model fits that correctly showed evidence for rate variance significantly greater than 0 (i.e., power, indicated by darker black lines) and incorrectly showed evidence (i.e., error, indicated by lighter red lines) as a function of tree size.
Figure 3.
Figure 3.
Power and error rates for the trend parameter (μσ2). Lines depict changes in the proportion of model fits that correctly showed evidence for trends significantly less and greater than 0 (i.e., power, indicated by darker black lines) and incorrectly showed evidence (i.e., error, indicated by lighter red lines) as a function of tree size. Results are shown for both models allowed to freely estimate rate variance (σσ22) (i.e., unconstrained models, solid lines) and models with rate variance constrained to 0 (i.e., constrained models, dashed lines). The latter models are identical to conventional early/late burst models.
Figure 4.
Figure 4.
Power and error rates for branchwise rate parameters (ln σ2¯). Lines depict changes in proportions of branchwise rates considered anomalously slow (darker blue line) or fast (lighter red line) as a function of simulated rate deviations (ln σdev2¯). These results combine all fits to simulated data that detected rate variance (σσ22) significantly greater than 0. The proportions are equivalent to power when the detected rate deviation is of the same sign as the true, simulated deviation (left of 0 for anomalously slow rates in darker blue and right for anomalously fast rates in lighter red), and to error rate when the detected and true rate deviations are of opposite signs. Here, significant rate deviations for simulated rate deviations that are exactly 0 are considered errors regardless of sign.
Figure 5.
Figure 5.
Relationship between simulated and estimated branchwise rate parameters (ln σ2¯). For each simulation and posterior sample, branchwise rates were first centered by subtracting their mean. We estimated centered branchwise rates by taking the median of the centered posterior samples. The solid line represents the position of the true centered branchwise rates, while the shallower, dashed line represents the observed line of best fit for these data.
Figure 6.
Figure 6.
Phylogram of model results for cetacean body size data. Branch colors represent median posterior estimates of branchwise rates (ln σ2¯) of body size evolution, with slower and faster rates in dark blue and light red, respectively. The thinner, inset colors represent the posterior probability that a branchwise rate is anomalously fast according to its rate deviation (ln σdev2¯), with lower and higher posterior probabilities in light and dark gray, respectively.
Figure 7.
Figure 7.
The posterior probability distribution of fold-changes in cetacean body size evolution rates (σ2) per 1 million years. This distribution is given by exp[μσ2+σσ2X], where X is a random variable drawn from a standard normal distribution. The gray filled-in portion represents the 95% equal-tailed interval, while the vertical line represents the starting rate of 1.

References

    1. Arnold S.J., Bürger R., Hohenlohe P.A., Ajie B.C., Jones A.G.. 2008. Understanding the evolution and stability of the G-matrix. Evolution. 62:2451–2461. - PMC - PubMed
    1. Beaulieu J.M., O’Meara B.C.. 2016. Detecting hidden diversification shifts in models of trait-dependent speciation and extinction. Syst. Biol. 65:583–601. - PubMed
    1. Benson R.B.J., Campione N.E., Carrano M.T., Mannion P.D., Sullivan C., Upchurch P., Evans D.C.. 2014. Rates of dinosaur body mass evolution indicate 170 million years of sustained ecological innovation on the avian stem lineage. PLoS Biol. 12:e1001853. - PMC - PubMed
    1. Betancourt M.J., and Girolami M.. 2013. Hamiltonian Monte Carlo for hierarchical models. arXiv 1312.0906.
    1. Blomberg S.P., Garland T. Jr, Ives A.R.. 2003. Testing for phylogenetic signal in comparative data: behavioral traits are more labile. Evolution. 57:717–745. - PubMed