[Preprint]. 2022 Nov 11:2022.11.11.516111.
doi: 10.1101/2022.11.11.516111.

Attenuated humoral responses in HIV infection after SARS-CoV-2 vaccination are linked to global B cell defects and cellular immune profiles

Affiliations

Attenuated humoral responses in HIV infection after SARS-CoV-2 vaccination are linked to global B cell defects and cellular immune profiles

Emma Touizer et al. bioRxiv. .

Update in

  • Attenuated humoral responses in HIV after SARS-CoV-2 vaccination linked to B cell defects and altered immune profiles.
    Touizer E, Alrubayyi A, Ford R, Hussain N, Gerber PP, Shum HL, Rees-Spear C, Muir L, Gea-Mallorquí E, Kopycinski J, Jankovic D, Jeffery-Smith A, Pinder CL, Fox TA, Williams I, Mullender C, Maan I, Waters L, Johnson M, Madge S, Youle M, Barber TJ, Burns F, Kinloch S, Rowland-Jones S, Gilson R, Matheson NJ, Morris E, Peppa D, McCoy LE. Touizer E, et al. iScience. 2023 Jan 20;26(1):105862. doi: 10.1016/j.isci.2022.105862. Epub 2022 Dec 24. iScience. 2023. PMID: 36590902 Free PMC article.

Abstract

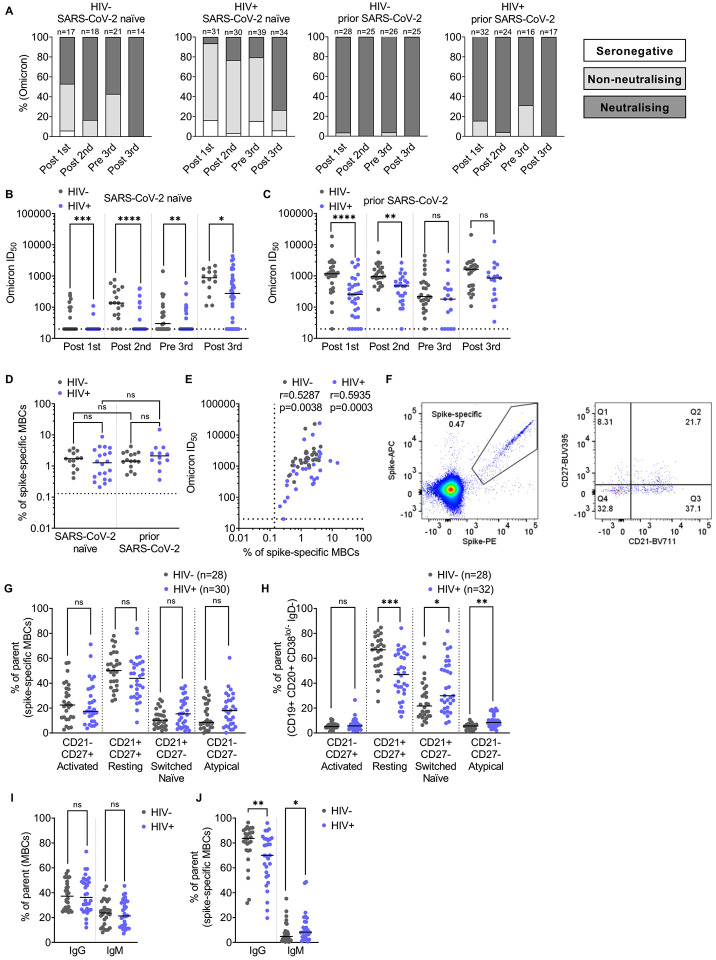
People living with HIV (PLWH) on suppressive antiretroviral therapy (ART) can have residual immune dysfunction and often display poorer responses to vaccination. We assessed in a cohort of PLWH (n=110) and HIV negative controls (n=64) the humoral and spike-specific B-cell responses following 1, 2 or 3 SARS-CoV-2 vaccine doses. PLWH had significantly lower neutralizing antibody (nAb) titers than HIV-negative controls at all studied timepoints. Moreover, their neutralization breadth was reduced with fewer individuals developing a neutralizing response against the Omicron variant (BA.1) relative to controls. We also observed a delayed development of neutralization in PLWH that was underpinned by a reduced frequency of spike-specific memory B cells (MBCs) and pronounced B cell dysfunction. Improved neutralization breadth was seen after the third vaccine dose in PLWH but lower nAb responses persisted and were associated with global, but not spike-specific, MBC dysfunction. In contrast to the inferior antibody responses, SARS-CoV-2 vaccination induced robust T cell responses that cross-recognized variants in PLWH. Strikingly, a subset of PLWH with low or absent neutralization had detectable functional T cell responses. These individuals had reduced numbers of circulating T follicular helper cells and an enriched population of CXCR3 + CD127 + CD8 + T cells after two doses of SARS-CoV-2 vaccination, which may compensate for sub-optimal serological responses in the event of infection. Therefore, normalisation of B cell homeostasis could improve serological responses to vaccines in PLWH and evaluating T cell immunity could provide a more comprehensive immune status profile in these individuals and others with B cell imbalances.


Figures

Figure 1:
Figure 1:. Weaker post vaccination antibody responses in SARS-CoV-2 naïve PLWH.
(A) Percentage of individuals with detectable neutralizing antibody response, non-neutralizing but binding response, or seronegative at each timepoint as color-coded in the key. The headings above each graph show HIV status and previous SARS-CoV-2 exposure. N numbers for each group are indicated above each column. (B) WT pseudovirus neutralization reciprocal 50% inhibitory titers (ID50) in PLWH (blue) compared to HIV-negative controls (grey) stratified by vaccination timepoint (on the x-axis) for individuals without prior SARS-CoV-2 infection. The dotted line represents the lower limit of the assay (ID50=1:20). Where no neutralization was detected, samples were assigned an ID50 of <1:20 as this was the limit of assay detection. Each data point represents the mean of n=2 biological repeats, each measured in duplicates. N numbers match those in (A), Statistical test: Mann Whitney U-test (MWU). (C) Shows the equivalent data for those with prior SARS-CoV-2 infection, N numbers match those in (A). (D) Longitudinal ID50 titers for HIV-negative controls without prior SARS-CoV-2 infection who provided at least two longitudinal samples, including a post first dose sample. Samples that were neutralizing after the first dose are categorised as exhibiting a standard neutralizing response and colored grey, those that only achieve neutralization after the second dose, exhibit a delayed neutralizing response and are color-coded in magenta. N numbers for each category are indicated on the graph. (E) Shows the equivalent data for PLWH without prior SARS-CoV-2 infection. (F) Shows the equivalent data for HIV-negative controls with prior SARS-CoV-2 infection. (G) Shows the equivalent data for PLWH with prior SARS-CoV-2 infection. (H) CD4 T cell counts and (I) CD4:CD8 T cell ratio for PLWH stratified by standard (grey) or delayed neutralization (magenta). N numbers are as per D-G. Statistical test: MWU.
Figure 2:
Figure 2:. Neutralization titer is associated with the frequency of spike-specific MBCs after the first vaccine dose
(A) Spike-specific MBCs (CD19+ CD20+ CD38lo/mid IgD-excluding switched naïve CD27− CD21+ cell) according to spike-PE and spike-APC in a representative naïve pre-vaccine sample (left) or representative post-vaccine sample (right) after the first vaccine dose. (B) Percentage of spike-specific MBC after the first vaccine dose stratified by prior SARS-CoV-2 infection, statistical test: M-Whitney U test (MWU). Dotted lines represent lower limit of sensitivity of the assay (0.1% spike-specific MBCs, based on (Jeffery-Smith et al., 2022). (C) Percentage of spike-specific MBCs in SARS-CoV-2 naïve donors after the first vaccine dose, stratified by delayed (magenta) or standard (grey) neutralization profile, statistical test: MWU. Dotted lines represent lower limit of sensitivity of the assay (0.1% spike-specific MBCs) (D) Correlation of the percent of spike-specific MBC with WT ID50 titers stratified by PLWH (blue) and controls (grey) after the first dose, statistical test: Spearman’s rank correlation coefficient. (E) Distribution of MBCs (CD19+ CD20+ CD38lo/mid IgD-) subtypes according to CD27−BUV395 and CD21−BV711 in a representative HIV-negative donor sample (left) or PLWH donor sample (right). (F) Percentage of MBC subtypes (activated CD27+ CD21−; resting CD27+ CD21+; switched naïve; switched naïve CD27− CD21+ and CD27− CD21− atypical) after the first vaccine dose stratified by delayed or standard neutralization profile. Statistical test: MWU (G) Correlation of the percentage of resting CD27+ CD21+ MBCs with WT ID50 titers stratified by delayed (magenta) or standard (grey) neutralization profile after the first vaccine dose, statistical test: Spearman’s rank correlation coefficient. (H) Correlation of the percent of switched naïve CD27− CD21+ MBCs with WT ID50 titers stratified by delayed (magenta) or standard (grey) neutralization profile after the first vaccine dose, statistical test: Spearman’s rank correlation coefficient.
Figure 3:
Figure 3:. Improved neutralization against Omicron after the third vaccine dose in PLWH accompanied by minimal alteration in the spike-specific MBC phenotype
(A) Percentage of individuals with detectable neutralizing response, non-neutralizing but binding response, or seronegative at each timepoint as color-coded in the key (neutralization against Omicron pseudovirus). Headings above each graph show the HIV status and previous SARS-CoV-2 exposure. N numbers for each group are indicated above each column. (B) Omicron pseudovirus neutralization ID50 in PLWH (blue) compared to HIV-negative controls (grey) stratified by vaccination timepoint (on the x-axis) for individuals without prior SARS-CoV-2 infection. Statistical test: Mann-Whitney U test (MWU). (C) Shows the equivalent data for those with prior SARS-CoV-2 infection, N numbers match those in (A). (D) Percentage of spike-specific MBCs in PLWH (blue) and HIV-negative donors (grey) after the third vaccine dose stratified by SARS-CoV-2 infection. Statistical test: MWU. (E) Correlation between Omicron ID50 titers and percentage of spike-specific MBCs in PLWH (blue) and HIV-negative donors (grey) after the third vaccine dose. Statistical test: Spearman’s rank correlation coefficient. (F) Representative gating strategy to identify spike-specific MBCs subtypes. (G) Percentage of spike-specific MBCs subtypes (activated CD27+ CD21−; resting CD27+ CD21+; switched naïve; switched naïve CD27− CD21+ and CD27− CD21− atypical) after the third vaccine dose in PLWH (blue) and HIV-negative donors (grey). Statistical test: MWU. (H) Percentage of MBCs subtypes (activated CD27+ CD21−; resting CD27+ CD21+; switched naïve; switched naïve CD27− CD21+ and CD27− CD21− atypical) after the third vaccine dose in PLWH (blue) and HIV-negative donors (grey). Statistical test: MWU. (I)Percentage of IgG and IgM in MBCs (excluding switched naïve CD27− CD21+ fraction) after the third vaccine dose in PLWH (blue) and HIV-negative donors (grey). Statistical test: MWU. (J) Percentage of IgG and IgM in spike-specific MBCs after the third vaccine dose in PLWH (blue) and HIV-negative donors (grey). Statistical test: MWU.
Figure 4.
Figure 4.. Comparable magnitude of spike-specific T-cell responses following SARS-CoV-2 vaccination in HIV-positive and HIV-negative individuals.
(A–C) Cross-sectional analysis of the magnitude of the IFN-γ-ELISpot responses to the SARS-CoV-2 spike peptide pools in HIV-negative (grey) and HIV-positive (blue) individuals, with or without prior SARS-CoV-2 infection following first dose (A) second dose (B) and third dose (C). (HIV−SARS-CoV-2− first dose n=9, second dose n=18, third dose n=14; HIV+SARS-CoV-2− frist dose n=15, second dose n=29, third dose n=31; HIV−SARS-CoV-2+ first dose n=23, second dose n=27, third dose n=20; HIV+SARS-CoV-2+ first dose n=12, second dose n=13, third dose n=15). Statistical test: Mann-Whitney U-test (MWU). (D) Longitudinal analysis of the spike specific T cell responses in PLWH and HIV-negative subjects. Statistical test: Wilcoxon matched-pairs sign rank test (WMP). (E) Longitudinal and cross-sectional analysis of the magnitude of T cell responses to B.1.1.529 after two or three vaccine doses (n=11 HIV−SARS-CoV-2−, n=20 HIV+SARS-CoV-2−, n=22 HIV−SARS-CoV-2+, n=10 HIV+SARS-CoV-2+). Statistical test: MWU and WMP. (F–H) Correlation between the CD4 T cell count in HIV-positive individuals and magnitude of spike-specific T cell responses after first dose (F), second dose (G), and (H) third dose. Statistical test: Spearman’s rank correlation coefficient
Figure. 5:
Figure. 5:. Interrelations between humoral and cellular responses following SARS-CoV-2 vaccination in HIV positive and HIV negative individuals.
(A–C) Correlation of spike-specific T cell responses with nAb titers after first dose (A) second dose (B) and third vaccine dose (C) of vaccine in HIV-negative and HIV-positive donors, with or without prior SARS-CoV-2 infection (limit of detection ID50=20, low level of nAb ID50=150). Statistical test: Spearman’s rank correlation coefficient. (D–E) Hierarchy of the spike-specific T cell responses ordered by their nAb titers in HIV-negative (D) and HIV-positive (E) SARS-CoV-2 naïve donors after two vaccine doses. (F–J) Hierarchy of the spike-specific T cell responses after three vaccine doses in HIVnegative (F) and positive (J) SARS-CoV-2 naïve participants.
Figure 6.
Figure 6.. Phenotypic characterization of CD4 and CD8 T cells from SARS-CoV-2 naïve HIV positive individuals according to their neutralization levels.
(A) viSNE map of FlowSOM metaclusters of CD4 T cells from HIV positive SARS-CoV-2 naïve subjects after two vaccine doses (nab−/low= no neutralization or low level of neutralization, nAbhigh=high neutralization level; n=9 in each group). Each point on the high-dimensional mapping represents an individual cell, and metaclusters are color-coded. (B) Cell count of each FlowSOM metaclusters out of total CD4 T cells (20,000 cells/group). (C) Representative flow plots from a nAb−/low and nAbhigh SARS-CoV-2 naïve HIV-positive donor showing expression of CXCR5 and CXCR3 within CD4 T cells. (D) Summary analysis of the percentage of CXCR5+CXCR3+CD4 T cells (n=9 for each group). Statistical test: Mann-Whitney U-test (MWU). (E) Correlation between frequency of CXCR5+CXCR3+CD4 T cells and ID50 neutralization level in nAb−/low and nAbhigh SARS-CoV-2 naïve HIV-positive individuals after two vaccine doses. Statistical test: Spearman’s rank correlation coefficient. (F) viSNE map of FlowSOM metaclusters of CD8 T cells from nAb−/low and nAbhigh HIV-positive SARS-CoV-2 naïve subjects after two doses of the vaccine (n=9 in each group). (G) Cell count of each CD8 FlowSOM metaclusters out of total CD8 T cells (20,000 cells/group). (H) Representative flow plots from a nAb−/low and nAbhigh SARS-CoV-2 naïve HIV-positive donor showing expression of CXCR3, CD127, and CD38 within naïve CD8 T cells. (I) Summary analysis of the percentage of CD127+CXCR3+CD38+niave CD8 T cells (n=9 for each group). Statistical test: MWU. (J) Correlation between proportion of CD127+CXCR3+CD38+niave CD8 T cells and SARS-CoV-2 specific T cell responses in nAb−/low HIV-positive SARS-CoV-2 naïve subjects. Statistical test: Spearman’s rank correlation coefficient.

References

    1. Adam L., Rosenbaum P., Quentric P., Parizot C., Bonduelle O., Guillou N., Corneau A., Dorgham K., Miyara M., Luyt C.E., et al. (2021). CD8+PD-L1+CXCR3+ polyfunctional T cell abundances are associated with survival in critical SARS-CoV-2-infected patients. JCI Insight 6. - PMC - PubMed
    1. Alrubayyi A., Gea-Mallorqui E., Touizer E., Hameiri-Bowen D., Kopycinski J., Charlton B., Fisher-Pearson N., Muir L., Rosa A., Roustan C., et al. (2021). Characterization of humoral and SARS-CoV-2 specific T cell responses in people living with HIV. Nat Commun 12, 5839. - PMC - PubMed
    1. Banki Z., Mateus J., Rossler A., Schafer H., Bante D., Riepler L., Grifoni A., Sette A., Simon V., Falkensammer B., et al. (2022). Heterologous ChAdOx1/BNT162b2 vaccination induces stronger immune response than homologous ChAdOx1 vaccination: The pragmatic, multi-center, three-arm, partially randomized HEVACC trial. EBioMedicine 80, 104073. - PMC - PubMed
    1. Baskaran V., Lawrence H., Lansbury L.E., Webb K., Safavi S., Zainuddin N.I., Huq T., Eggleston C., Ellis J., Thakker C., et al. (2021). Co-infection in critically ill patients with COVID-19: an observational cohort study from England. J Med Microbiol 70. - PMC - PubMed
    1. Bergamaschi L., Mescia F., Turner L., Hanson A.L., Kotagiri P., Dunmore B.J., Ruffieux H., De Sa A., Huhn O., Morgan M.D., et al. (2021). Longitudinal analysis reveals that delayed bystander CD8+ T cell activation and early immune pathology distinguish severe COVID-19 from mild disease. Immunity 54, 1257–1275 e1258. - PMC - PubMed

Publication types