. 2022 Nov 12;4(4):zcac036.
doi: 10.1093/narcan/zcac036. eCollection 2022 Dec.

Multiple-low-dose therapy: effective killing of high-grade serous ovarian cancer cells with ATR and CHK1 inhibitors

Affiliations

Multiple-low-dose therapy: effective killing of high-grade serous ovarian cancer cells with ATR and CHK1 inhibitors

Anya Golder et al. NAR Cancer. .

Abstract

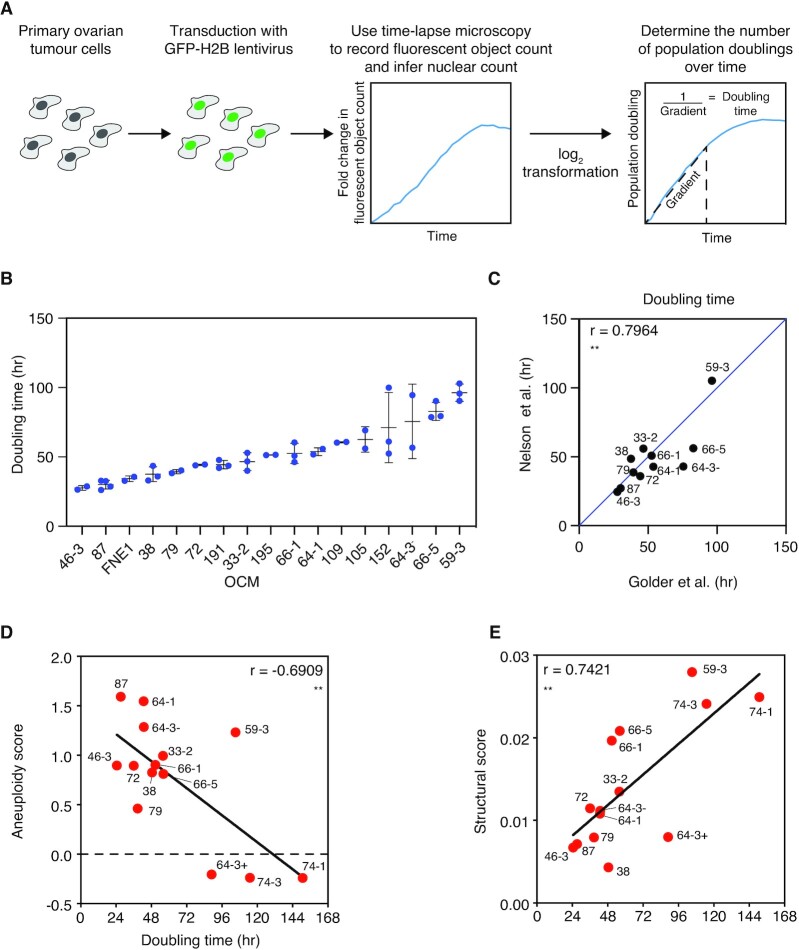
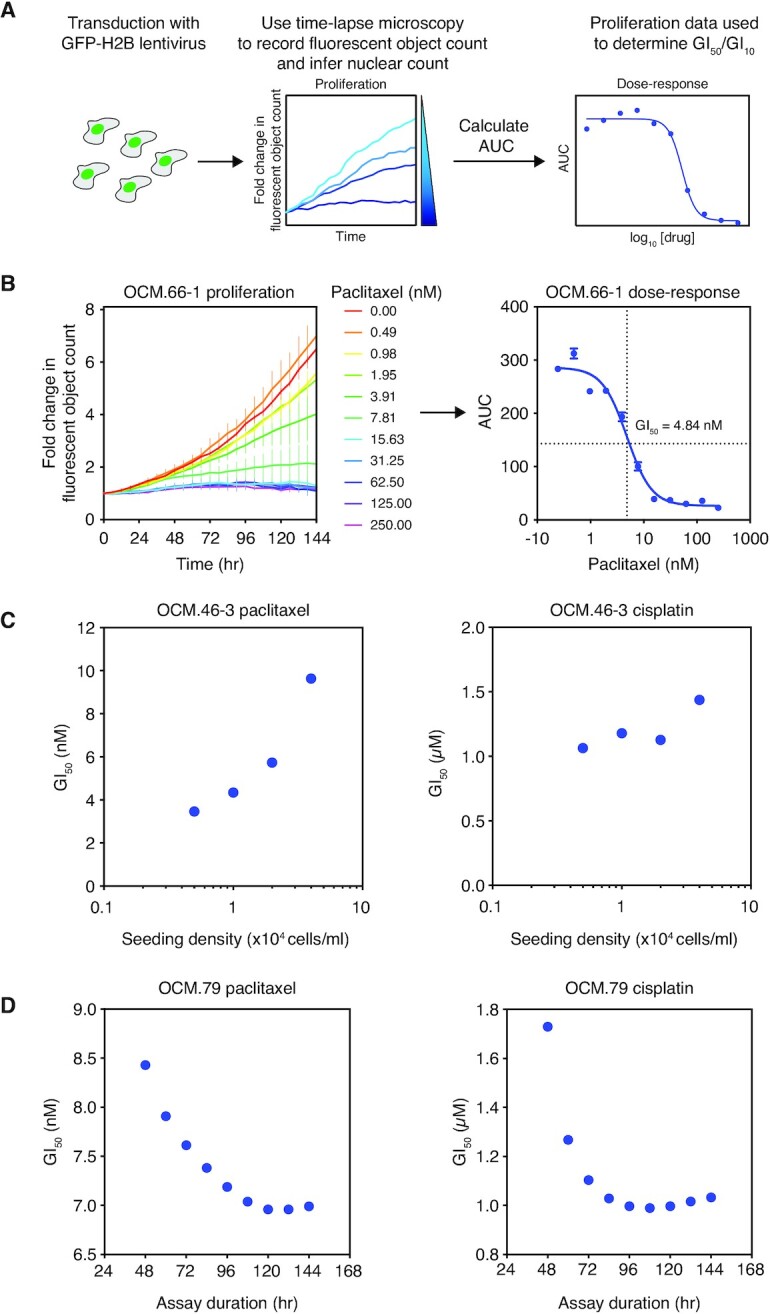
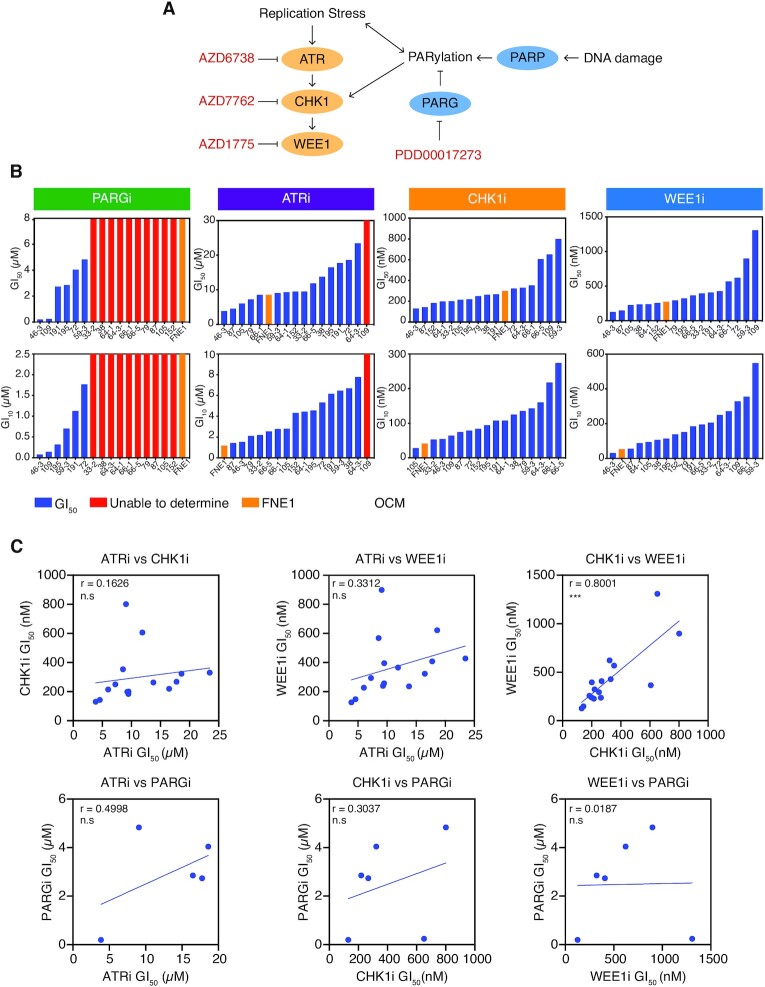
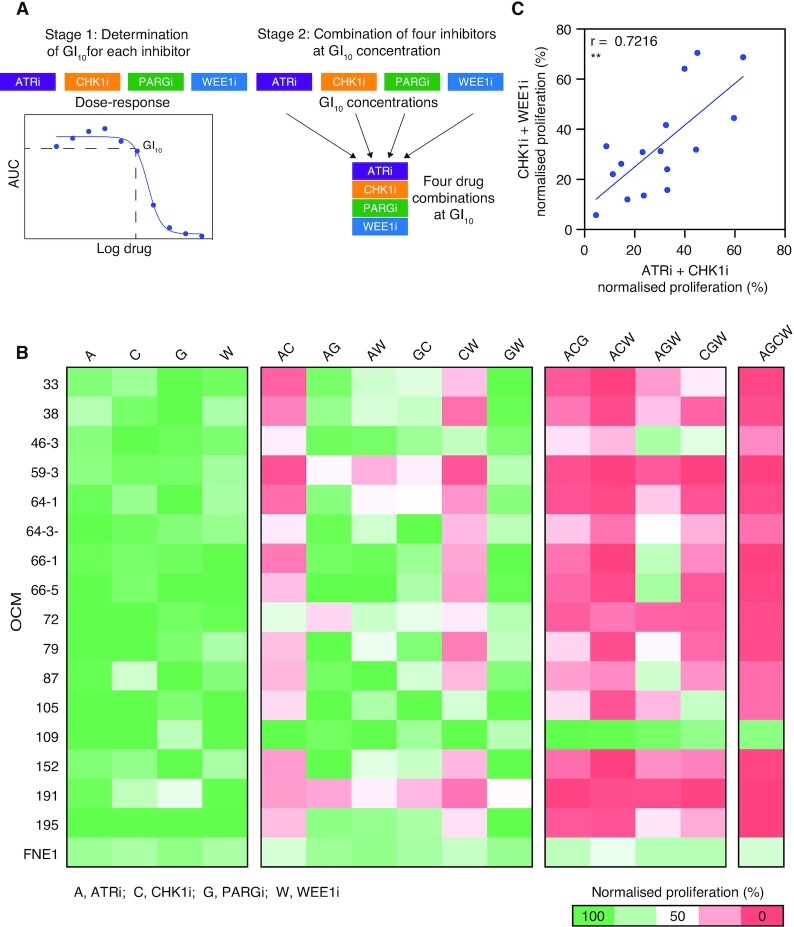
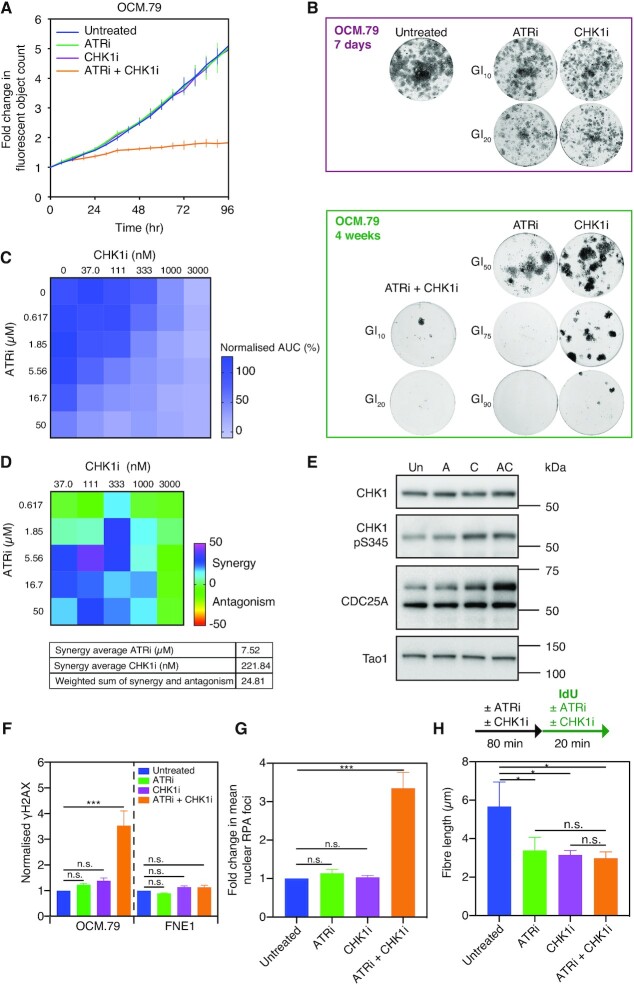
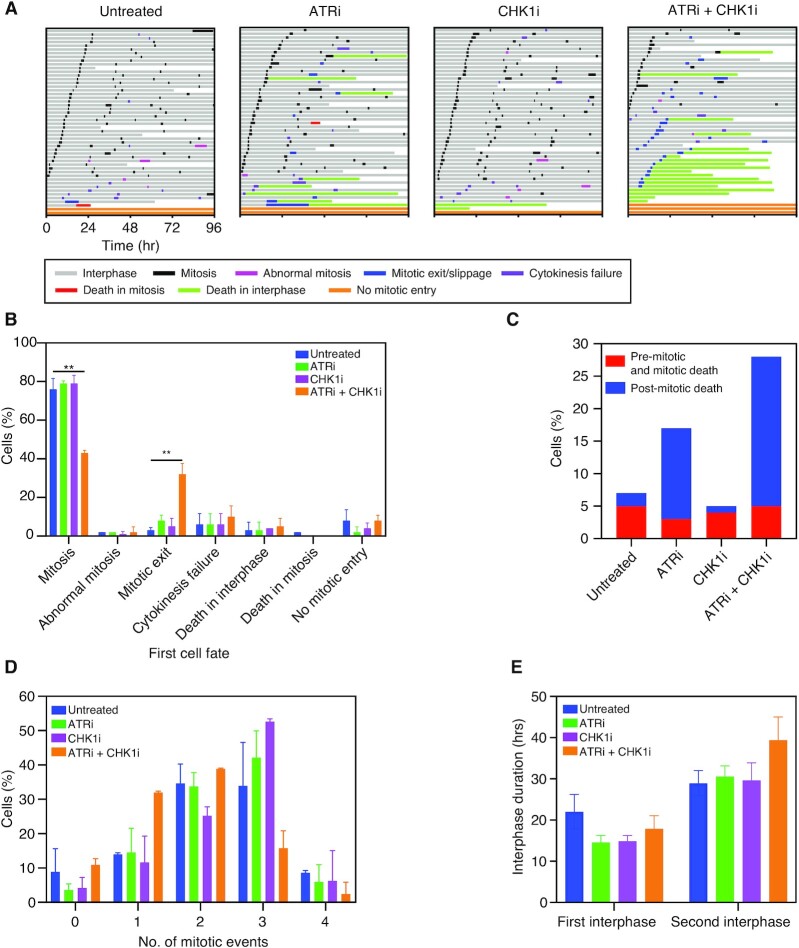
High-grade serous ovarian cancer (HGSOC) is an aggressive disease that typically develops drug resistance, thus novel biomarker-driven strategies are required. Targeted therapy focuses on synthetic lethality-pioneered by PARP inhibition of BRCA1/2-mutant disease. Subsequently, targeting the DNA replication stress response (RSR) is of clinical interest. However, further mechanistic insight is required for biomarker discovery, requiring sensitive models that closely recapitulate HGSOC. We describe an optimized proliferation assay that we use to screen 16 patient-derived ovarian cancer models (OCMs) for response to RSR inhibitors (CHK1i, WEE1i, ATRi, PARGi). Despite genomic heterogeneity characteristic of HGSOC, measurement of OCM proliferation was reproducible and reflected intrinsic tumour-cell properties. Surprisingly, RSR targeting drugs were not interchangeable, as sensitivity to the four inhibitors was not correlated. Therefore, to overcome RSR redundancy, we screened the OCMs with all two-, three- and four-drug combinations in a multiple-low-dose strategy. We found that low-dose CHK1i-ATRi had a potent anti-proliferative effect on 15 of the 16 OCMs, and was synergistic with potential to minimise treatment resistance and toxicity. Low-dose ATRi-CHK1i induced replication catastrophe followed by mitotic exit and post-mitotic arrest or death. Therefore, this study demonstrates the potential of the living biobank of OCMs as a drug discovery platform for HGSOC.


Figures

Figure 1.
Figure 1.
Measurement of OCM proliferation rates. (A) OCMs were transduced with a lentivirus expressing a GFP-tagged histone 2B (GFP-H2B) to generate cells with fluorescent nuclei. Time-lapse microscopy was used to measure fluorescent object count to infer nuclear count, as a proxy for cell number, over 120 h. The inverse gradient of the linear portion of a log2 transformation of the fluorescent object count, normalised to t = 0, was used to determine culture doubling time. (B) Doubling times of the present cohort of 16 OCMs and the non-transformed FNE1 cell line ranked from shortest to longest duration. Mean and SD determined from a minimum of two independent experiments. (C) Comparison of mean doubling time from (B) with Nelson et al., 2020 for the 11 OCMs included in both analyses (note, for drug screening purposes the present cohort excludes OCMs with relatively slow proliferation rates and includes novel OCMs not available at the time of the prior analysis). A y = x line is shown for illustrative purposes. (DE) Comparison of doubling time with aneuploidy score (D) and structural score (E) from shallow, single-cell, whole-genome sequencing (both datasets from Nelson et al., 2020). Linear regression is shown and Pearson's r is used to measure correlation. Two-tailed P value, ** P ≤ 0.01. Note that the culture established from the third biopsy from patient 64 was further separated into EpCAM-negative (64-3-) and EpCAM-positive (64-3+) cells, with only OCM.64-3- included in the current analysis (15). See also Supplementary Figure S1.
Figure 2.
Figure 2.
Drug sensitivity profiling of OCMs by time-lapse microscopy. (A) Schematic of the drug profiling assay. OCMs expressing GFP-H2B are treated with a drug titration and time-lapse microscopy used to plot fluorescent object count over time, normalised to t = 0. The area-under-the-curve (AUC) for each drug concentration is calculated and plotted onto a dose–response curve and GI50 determined. (B) Exemplar assay showing determination of the paclitaxel GI50 for OCM.66-1. Cells were treated with a titration of 0–250 nM paclitaxel with fluorescent object count measured over 96h and normalised to t = 0 (left panel). Each point represents the mean of three technical replicates ± SD. The corresponding dose-response curve plots the mean AUC ± SEM (right panel). (C) Paclitaxel (left panel) and cisplatin (right panel) GI50 of OCM.46-3 at various assay seeding densities. (D) Paclitaxel (left panel) and cisplatin (right panel) GI50 of OCM.79 at various assay durations. See also Supplementary Figure S2.
Figure 3.
Figure 3.
Drug-sensitivity profiling of OCMs with inhibitors of the replication stress response. (A) Inhibitors of the RSR used in the OCM drug-sensitivity screen, specifically targeting the replication checkpoint kinases and PARylation. Replication stress activates the ATR-CHK1-WEE1 signalling cascade (93). Replication stress and DNA damage impact PAR dynamics controlled by PARP and PARG, and PAR chains can also activate CHK1 directly (94,95). (B) Time-lapse microscopy drug-sensitivity profiling was used to determine the GI50 (upper panels) and GI10 (lower panels) of the 16 OCMs and FNE1 cells to PARGi, ATRi, CHK1i and WEE1i. Cells were treated with a dose-titration of each drug adapted for individual OCMs to allow optimal measurement of GI50 and GI10. Data from a single experiment. (C) Pairwise comparisons of OCM GI50 for PARGi, ATRi, CHK1i and WEE1i. Pearson's r is used to measure correlation. Two-tailed P value, *** P ≤ 0.001, n.s. P > 0.05. OCMs for which a GI50 was not determined in (B) were excluded from analysis. See also Supplementary Figure S3.
Figure 4.
Figure 4.
A multiple-low-dose drug combination is anti-proliferative in OCMs. (A) The two-stage strategy for the MLD screen. In Stage 1, the time-lapse microscopy drug-sensitivity profiling in Figure 3 was used to determine the GI10 dose of the 16 OCMs and FNE1 cell line to PARGi, ATRi, CHK1i and WEE1i. In Stage 2, all possible two-, three- and four-drug combinations were evaluated in the proliferation assay using the GI10 doses for each OCM and FNE1 cells defined in Stage 1. (B) The 16 OCMs and FNE1 cells were treated with the drug combinations indicated at the GI10 doses for 96 h. For each MLD regimen the AUC of the proliferation curve was measured and normalized to that of untreated cells and summarized as % in a heatmap. For OCMs where a GI10 could not be determined, a generic low dose was used (i.e. PARGi = 100 nM, ATRi = 2 μM). Data are from three technical replicates. (C) Comparison of the normalized AUC of ATRi-CHK1i and CHK1i-WEE1i low-dose combinations for each OCM. Note, OCM.109 is excluded as an GI10 dose to ATRi was not calculable. Pearson's r is used to measure correlation. Two-tailed P value, ** P ≤ 0.01. See also Figure 3 and Supplementary Figure S4.
Figure 5.
Figure 5.
Synergistic low-dose ATRi-CHK1i results in DNA replication stress and catastrophe in patient-derived HGSOC tumour cells. (A) Drug-sensitivity profiling assay of OCM.79 using ATRi and CHK1i at GI10 concentrations. Fluorescent object count of over 96 hours in the presence and absence of treatment as indicated, normalised to t = 0. Data are reproduced from Figure 4B, with each point representing the mean of three technical replicates ± SD. (B) Colony formation of OCM.79 following seven days or four weeks treatment with the GI10, GI20, GI50, GI75 or GI90 doses of ATRi and CHK1i for OCM.79, alone or in combination as indicated. Results are from a single experiment. (C) OCM.79 proliferation in a drug-concentration matrix of the indicated doses of ATRi and CHK1i for 72 h using the time-lapse proliferation assay. AUC was normalized to untreated cells. Data are from one technical replicate. (D) Matrix of the synergy-antagonism score generated from (C) using the Loewe additivity model. The drug average synergy scores are given to show the localisation of the synergy. The integrated weight sum of synergy and antagonism is also given, representing the total synergy/antagonism measurements across the matrix. (E) Immunoblot for CDC25A, CHK1, and CHK1 serine-345 phosphorylation, in OCM.79, with no treatment or after 2h treatment with the GI10 doses of ATRi and CHK1i alone or in combination. CDC25A is the upper band of approximately 65 kDa. Tao1 is included as a loading control. Representative immunoblot of two biological replicates. (F) Mean nuclear γH2AX intensity by immunofluorescence staining, following 48h treatment of OCM.79 or FNE1 cells with the GI10 doses of ATRi and CHK1i alone or in combination, normalized to untreated cells. (G) Mean RPA foci per nucleus by immunofluorescence staining, following 48h treatment of OCM.79 with the GI10 doses of ATRi and CHK1i alone or in combination, normalized to untreated cells. (H) Median length of IdU-labelled nascent DNA fibre in untreated OCM.79, or OCM.79 pre-treated for 80 min with the GI10 doses of ATRi and CHK1i alone or in combination (with treatment conditions then continued during 20 min IdU pulse). (F–H) Mean ± SD from three biological replicates, one-way ANOVA, *P ≤ 0.05, ***P ≤ 0.001, n.s. P > 0.05. GI10, GI20, GI50, GI75 or GI90 doses for OCM.79 and FNE1 cells were derived using the proliferation assay. See also Supplementary Figures S5–S7.
Figure 6.
Figure 6.
Low-dose ATRi-CHK1i inhibits cell cycle progression and causes post-mitotic cell death. (A) Cell fate profiling of OCM.79 using time-lapse microscopy, showing cell behaviour over 96 h with no treatment, or treatment with the GI10 doses of ATRi and CHK1i alone or in combination. Horizontal bars each represent a single cell (n = 50), with colours indicating cell behaviour. Following mitosis, one daughter cell was randomly selected to continue the analysis. Mitotic exit/slippage occurs when cells enter mitosis but exit without division. Cytokinesis failure occurs when daughters show cleavage furrow regression resulting in merging to one binucleated cell. Other cell division abnormalities such as tripolar cell divisions and division of binuclear cells were recorded as abnormal mitosis. Exemplar profiles shown from one of the two independent experiments described in (B)–(E). (B) Summary of first cell fate according to treatment. (C) Proportion of cells undergoing pre-mitotic/mitotic cell death (death occurring in the first interphase or mitotic cell death) and post-mitotic cell death (any cell death event that occurred following a normal mitosis, abnormal mitosis, cytokinesis failure and mitotic exit), according to treatment. (D) Proportion of surviving cells undergoing one, two, three or four mitotic events according to treatment. A mitotic event was defined as normal or abnormal mitosis, mitotic exit/slippage or cytokinesis failure. (E) Duration of the first and second interphase of surviving cells, according to treatment. Note: the first interphase is generally shorter than the second under all conditions as measurement was initiated part way through the first cell cycle. Cells that died during the analysis were excluded from (D) and (E). (B)–(E) are the mean of two independent experiments ± SD, one-way ANOVA, **P ≤ 0.01. Only significant comparisons are indicated, all other comparisons are not significant. GI10 doses for OCM.79 were derived using the proliferation assay. See also Supplementary Figure S8.

References

    1. Swain S.M., Miles D., Kim S.B., Im Y.H., Im S.A., Semiglazov V., Ciruelos E., Schneeweiss A., Loi S., Monturus E.et al.. Pertuzumab, trastuzumab, and docetaxel for HER2-positive metastatic breast cancer (CLEOPATRA): end-of-study results from a double-blind, randomised, placebo-controlled, phase 3 study. Lancet Oncol. 2020; 21:519–530. - PubMed
    1. Tan A.C., Tan D.S.W.. Targeted therapies for lung cancer patients with oncogenic driver molecular alterations. J. Clin. Oncol. 2022; Jco2101626. - PubMed
    1. Hauschild A., Ascierto P.A., Schadendorf D., Grob J.J., Ribas A., Kiecker F., Dutriaux C., Demidov L.V., Lebbé C., Rutkowski P.et al.. Long-term outcomes in patients with BRAF V600-mutant metastatic melanoma receiving dabrafenib monotherapy: analysis from phase 2 and 3 clinical trials. Eur. J. Cancer. 2020; 125:114–120. - PMC - PubMed
    1. Hochhaus A., Larson R.A., Guilhot F., Radich J.P., Branford S., Hughes T.P., Baccarani M., Deininger M.W., Cervantes F., Fujihara S.et al.. Long-term outcomes of imatinib treatment for chronic myeloid leukemia. N. Engl. J. Med. 2017; 376:917–927. - PMC - PubMed
    1. Bryant H.E., Schultz N., Thomas H.D., Parker K.M., Flower D., Lopez E., Kyle S., Meuth M., Curtin N.J., Helleday T.. Specific killing of BRCA2-deficient tumours with inhibitors of poly(ADP-ribose) polymerase. Nature. 2005; 434:913–917. - PubMed