. 2022 Nov 4:22:588-614.
doi: 10.1016/j.bioactmat.2022.10.023. eCollection 2023 Apr.

Harnessing the synergy of perfusable muscle flap matrix and adipose-derived stem cells for prevascularization and macrophage polarization to reconstruct volumetric muscle loss

Affiliations

Harnessing the synergy of perfusable muscle flap matrix and adipose-derived stem cells for prevascularization and macrophage polarization to reconstruct volumetric muscle loss

Qixu Zhang et al. Bioact Mater. .

Abstract

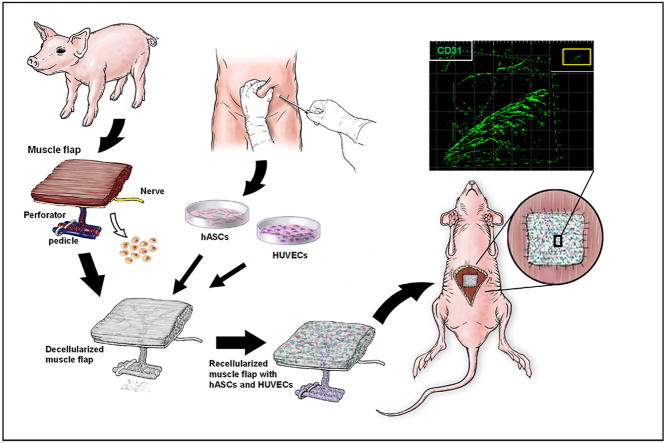
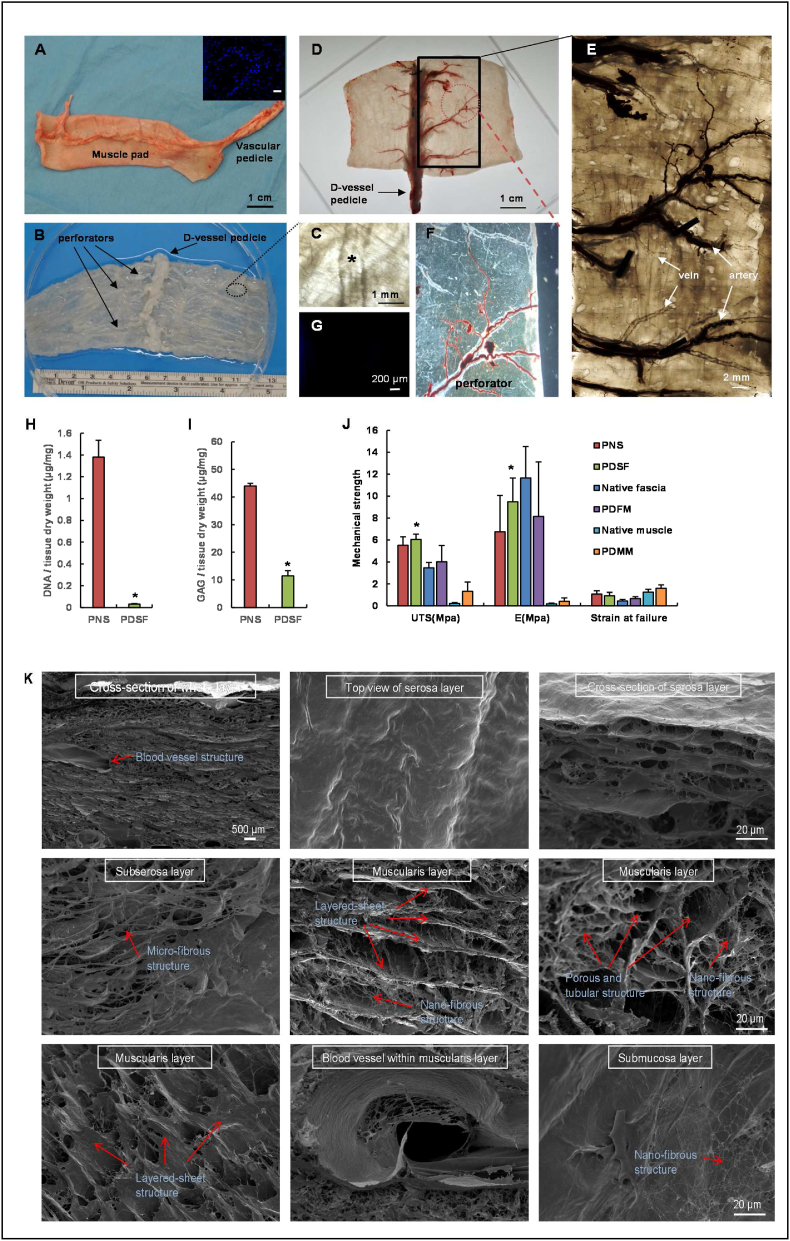
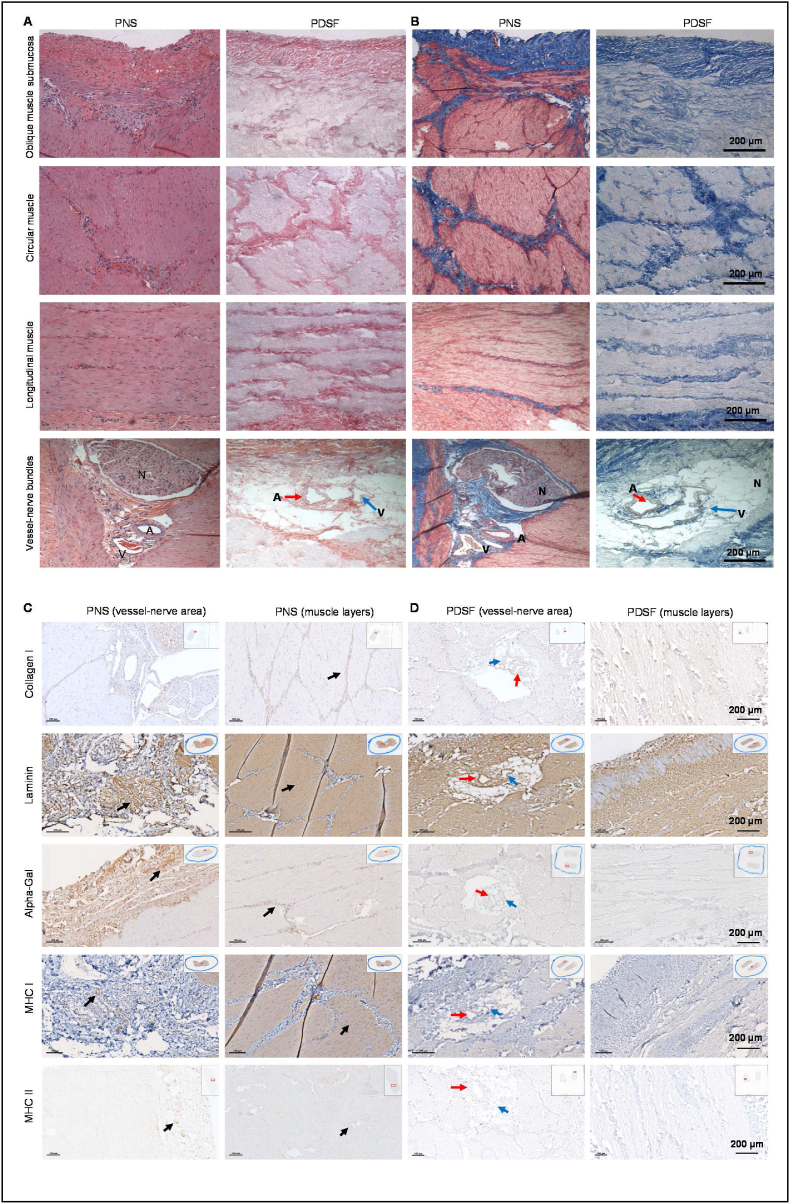
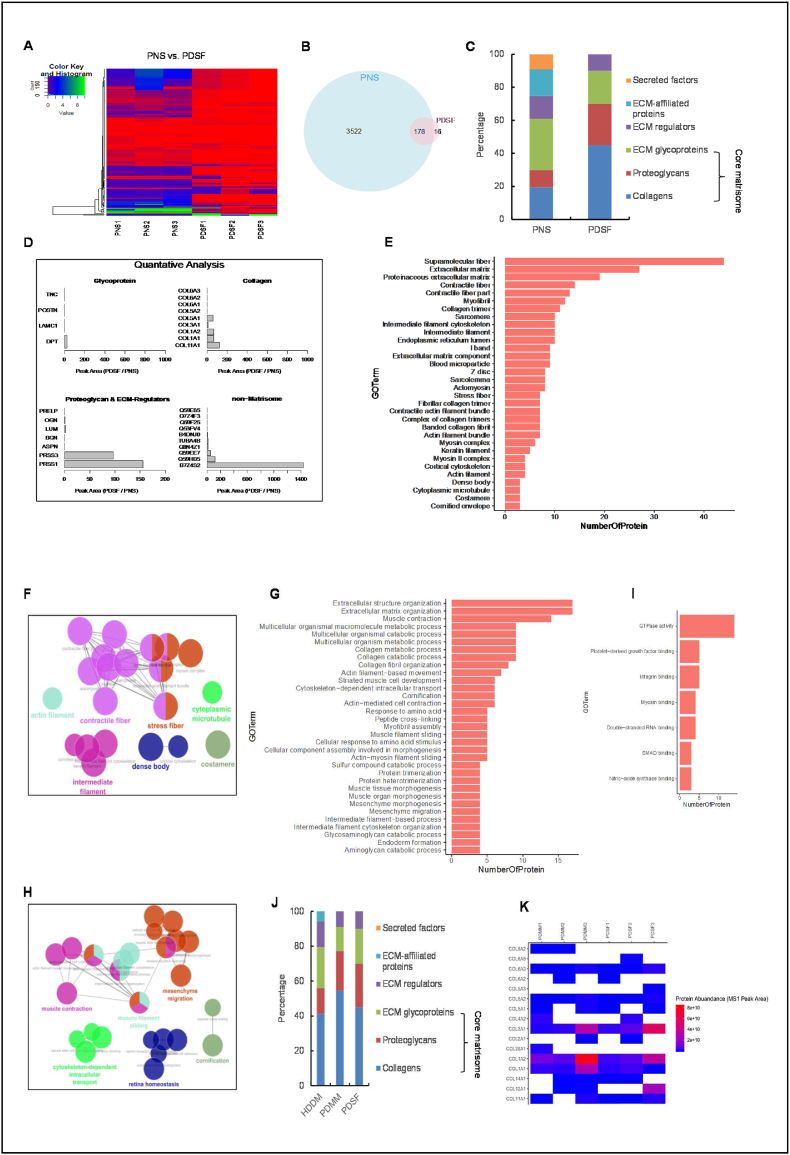
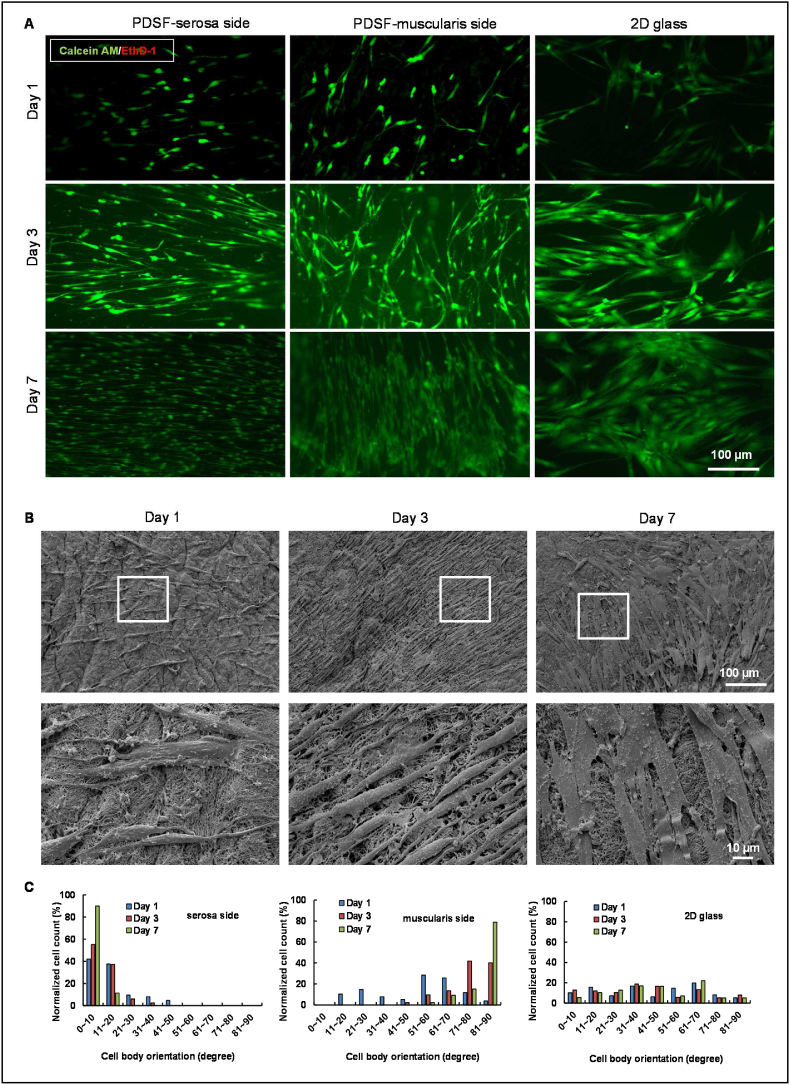
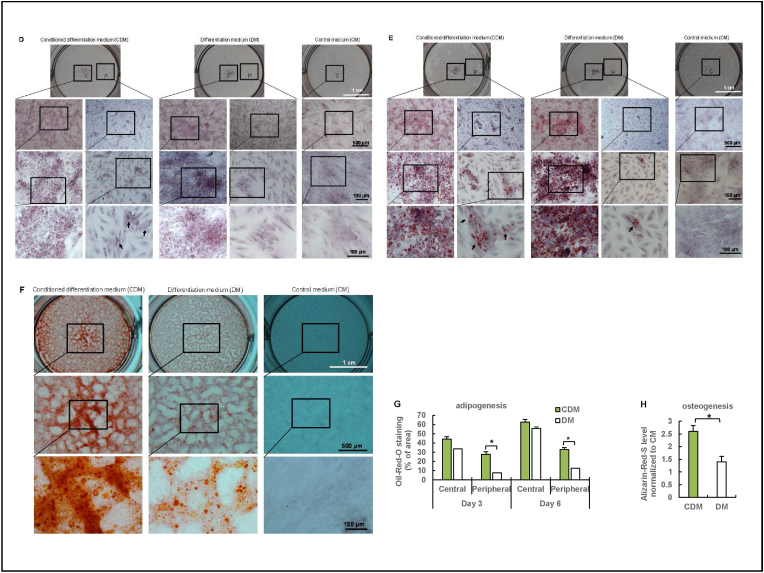
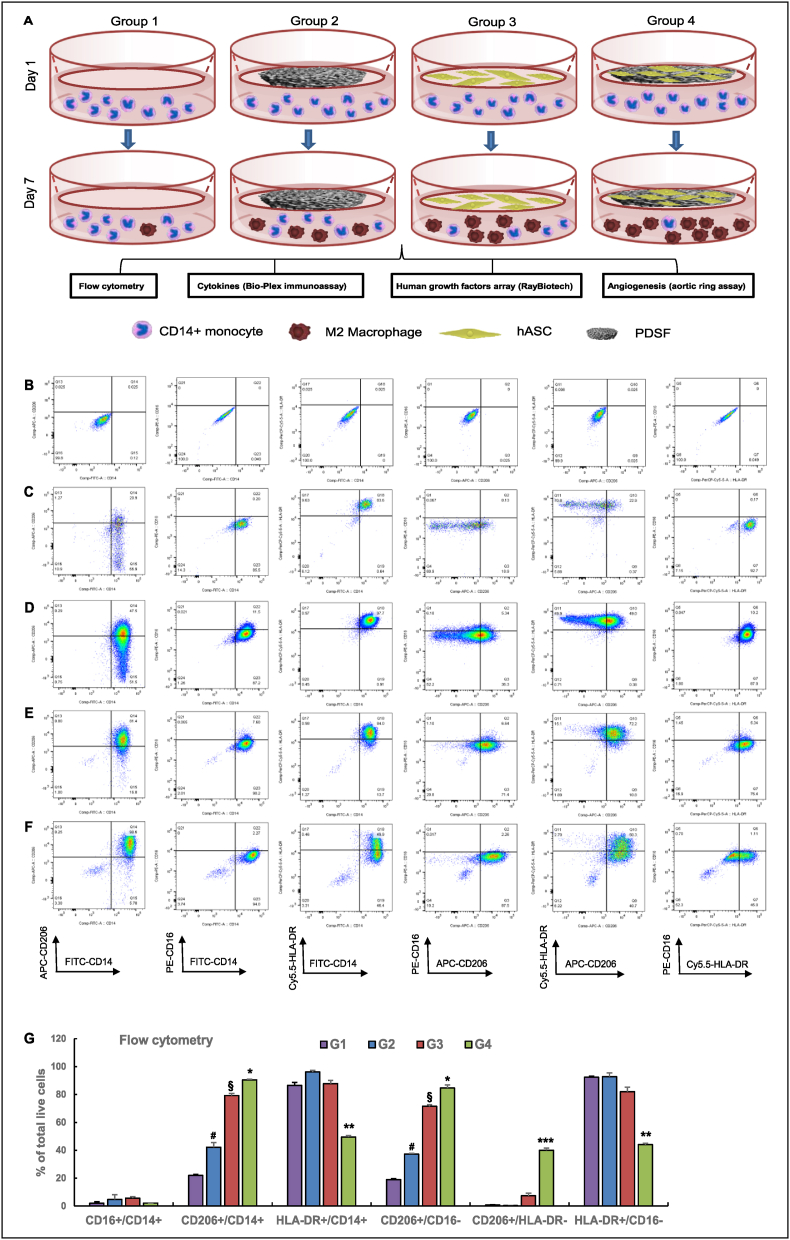
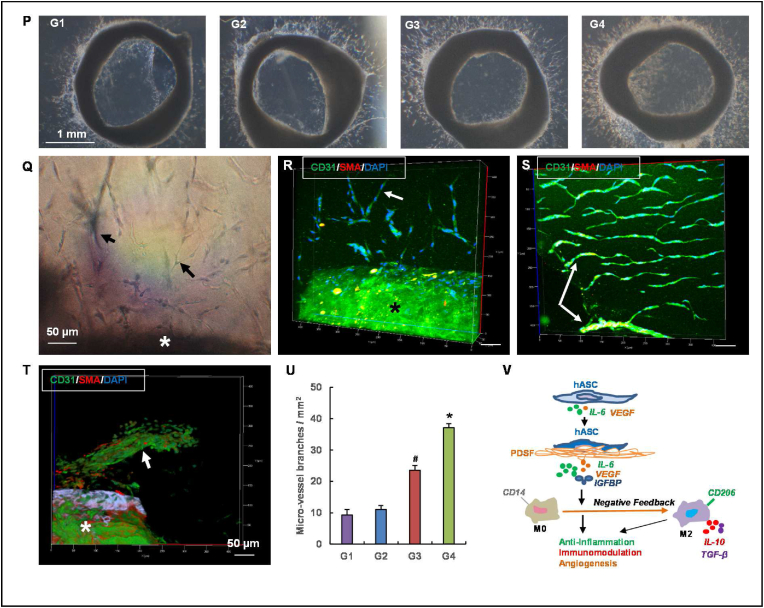
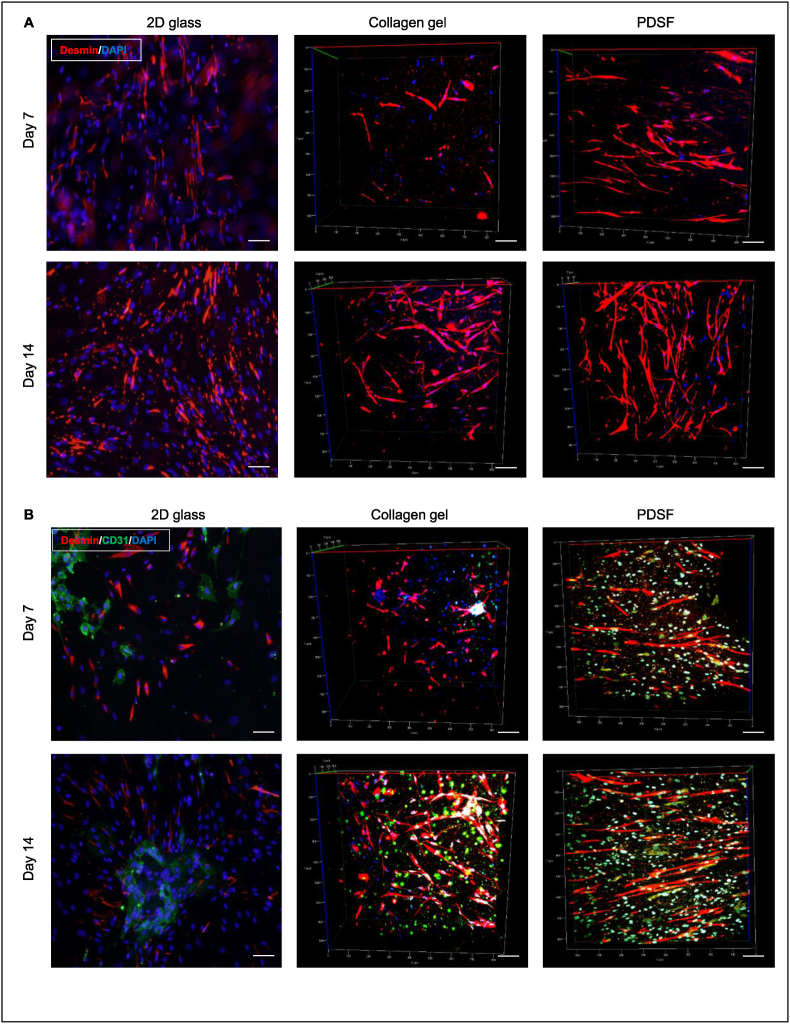
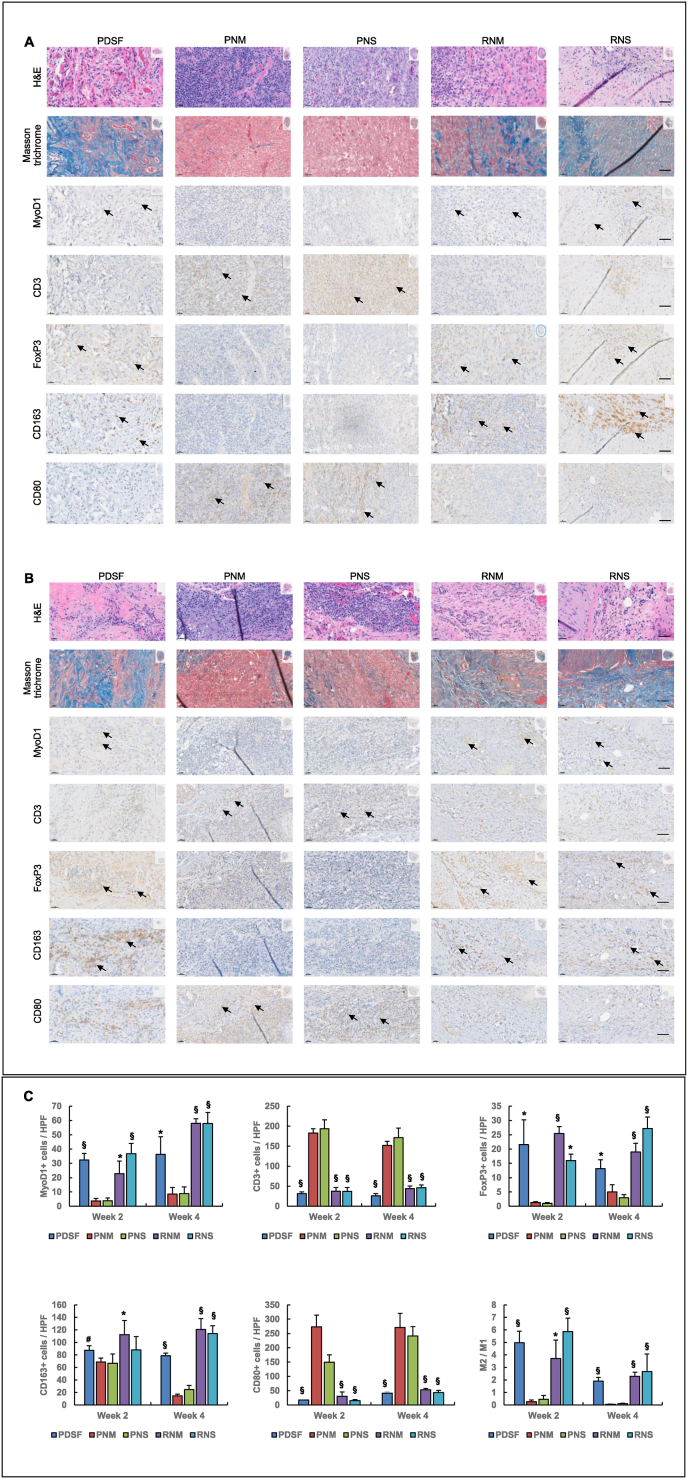
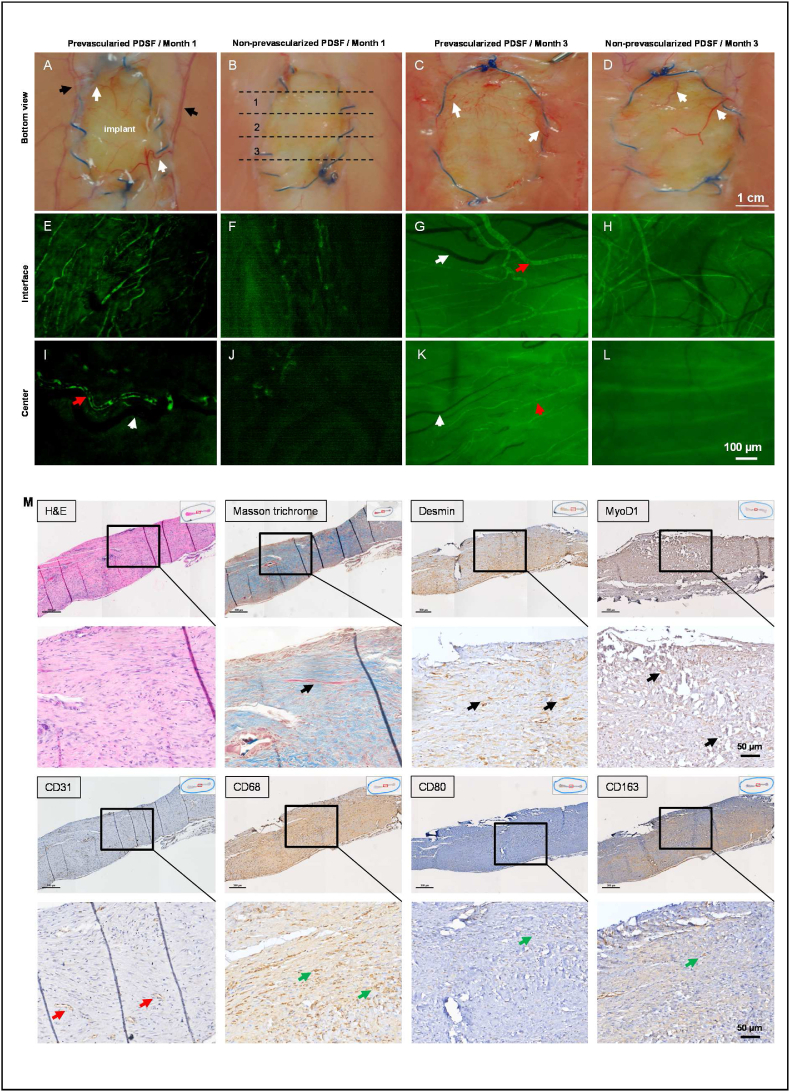
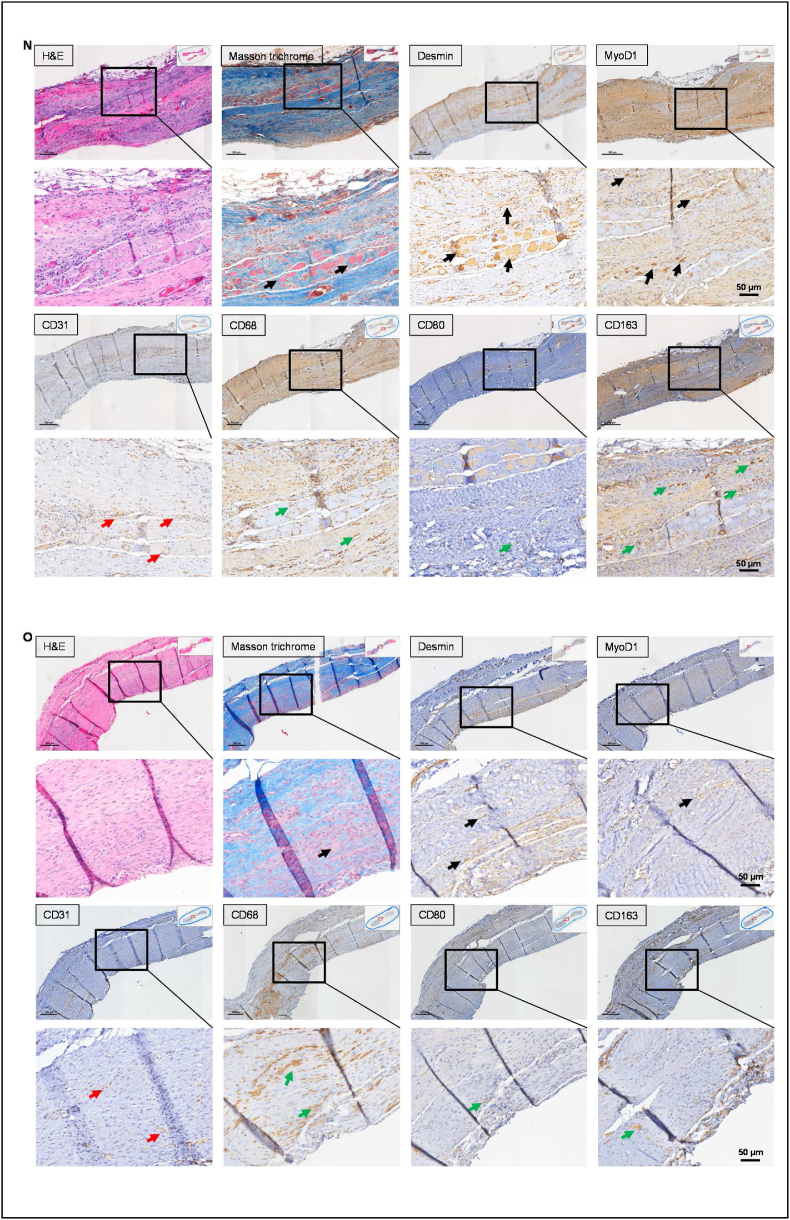
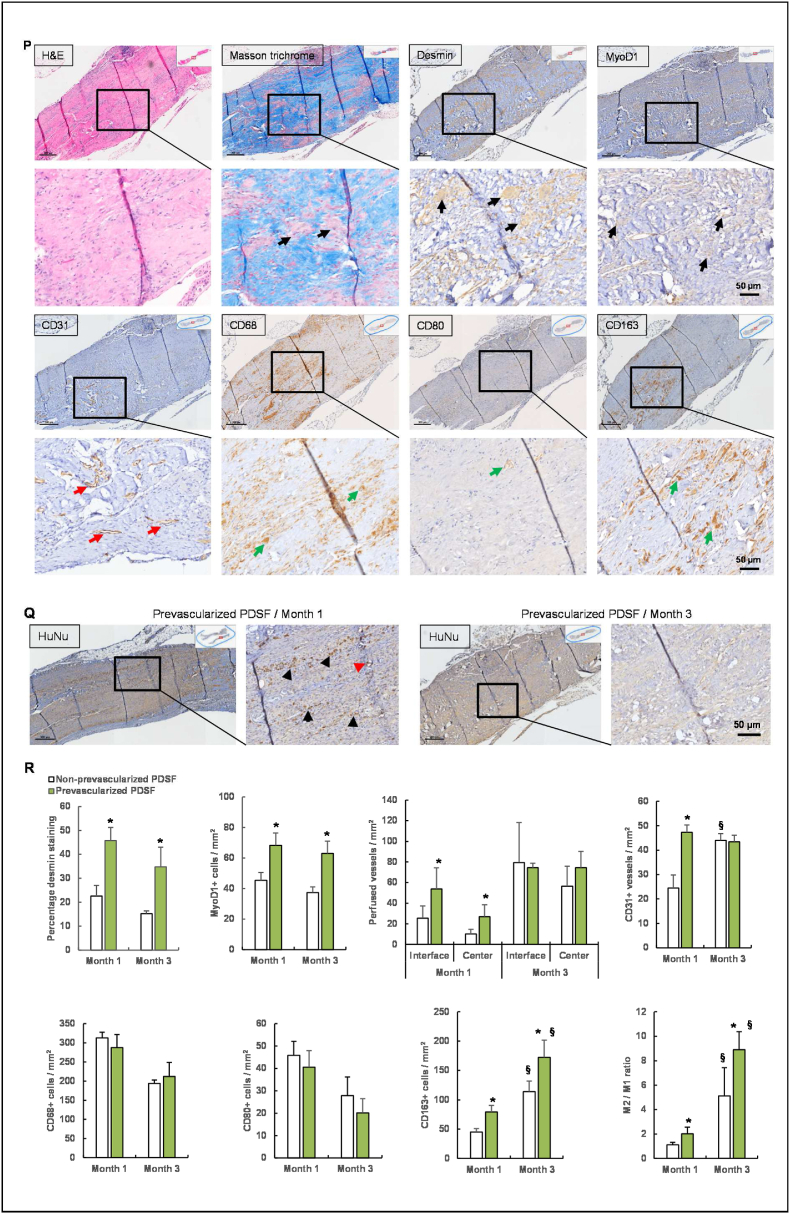
Muscle flaps must have a strong vascular network to support a large tissue volume and ensure successful engraftment. We developed porcine stomach musculofascial flap matrix (PDSF) comprising extracellular matrix (ECM) and intact vasculature. PDSF had a dominant vascular pedicle, microcirculatory vessels, a nerve network, well-retained 3-dimensional (3D) nanofibrous ECM structures, and no allo- or xenoantigenicity. In-depth proteomic analysis demonstrated that PDSF was composed of core matrisome proteins (e.g., collagens, glycoproteins, proteoglycans, and ECM regulators) that, as shown by Gene Ontology term enrichment analysis, are functionally related to musculofascial biological processes. Moreover, PDSF-human adipose-derived stem cell (hASC) synergy not only induced monocytes towards IL-10-producing M2 macrophage polarization through the enhancement of hASCs' paracrine effect but also promoted the proliferation and interconnection of both human skeletal muscle myoblasts (HSMMs) and human umbilical vein endothelial cells (HUVECs) in static triculture conditions. Furthermore, PDSF was successfully prevascularized through a dynamic perfusion coculture of hASCs and HUVECs, which integrated with PDSF and induced the maturation of vascular networks in vitro. In a xenotransplantation model, PDSF demonstrated myoconductive and immunomodulatory properties associated with the predominance of M2 macrophages and regulatory T cells. In a volumetric muscle loss (VML) model, prevascularized PDSF augmented neovascularization and constructive remodeling, which was characterized by the predominant infiltration of M2 macrophages and significant musculofascial tissue formation. These results indicate that hASCs' integration with PDSF enhances the cells' dual function in immunomodulation and angiogenesis. Owing in part to this PDSF-hASC synergy, our platform shows promise for vascularized muscle flap engineering for VML reconstruction.

Keywords: Decellularization; Extracellular matrix; Macrophage polarization; Muscle flap fabrication; Vascularization; Volumetric muscle loss.


Figures

Image 1
Graphical abstract
Scheme 1
Scheme 1
Prevascularized PDSF (engineered muscle flap) with a co-culture of human adipose-derived stem cells (hASCs) and human umbilical vein endothelial cells (HUVECs) was transplanted into a recipient nude rat for VML reconstruction. The inset image indicates the prevascularized area shown in the magnified view.
Fig. 1
Fig. 1
Perfusion decellularization and flap matrix angiography. (A) A porcine stomach musculofascial flap with gastric blood vessels. The inset image shows nuclear DNA stained by DAPI (scale bar = 200 μm). (B) A transparent PDSF matrix was achieved using a pump perfusion system combined with agitation decellularization. The PDSF had a preserved intact vasculature, including a dominant vascular pedicle and its perforators. (“D-” indicates “decellularized” in this and other panels.) (C) A magnified view of the circled area in panel B shows artery and vein structures in the perforator bundle (the asterisk indicates a blood vessel). (D) Microfil-117 angiography confirmed that PDSF retained a patent vascular pedicle and microcirculatory vessels. (E) In a magnified view of the boxed area in panel D, polarized light microscopy shows that the perforators penetrated into muscle matrix. Each artery was accompanied by a vein branch. (F) A magnified view of the circled area in panel D shows Microfil-117 easily filling a patent small perforator. (G) DAPI staining revealed the absence of nuclear DNA in PDSF. (H) Nuclear DNA was significantly reduced in PDSF. *P < 0.05 vs. PNS. (I) GAG content was significantly decreased in PDSF. *P < 0.05 vs. PNS. (J) PDSF has strong mechanical properties. *P < 0.05 vs. native muscle and PDMM. The Student t-test was used for comparisons between 2 groups, as appropriate. ANOVA was used for comparisons among multiple groups, as appropriate. (K) SEM images show that the 3D porous, tubular, and nanofibrous architectures of the ECM were well preserved in PDSF.
Fig. 2
Fig. 2
IHC analysis of PDSF. (A&B) H&E staining (A) and Masson trichrome staining (B) of the cross-sections of all layers demonstrated that cell nuclei were present in native tissues (i.e., PNS) but absent in PDSF samples. PNS comprises a serosa layer (fascia) and 3 muscularis layers. These layers were well retained as composite collagen−based ECM in PDSF. Blood vessels and nerve structures in the serosa layer were also well maintained in PDSF. A, artery; V, vein; N, nerve. (C&D) In PNS (C), collagen I was strongly expressed in the vessel-nerve area and in stromal and epimysium tissue, whereas laminin was distributed richly in vessels, nerves, and muscle parenchymal structures. Similarly, in PDSF (D), corresponding structures showed strong expression of both collagen I and laminin. In PNS (C), α-gal was strongly expressed in vessel-nerve tissue located in the serosa fascia, connective tissue between muscle layers, and muscle epimysium; and whereas MHC I was expressed in most cells, MHC II was detected mainly in vessel-nerve structures. In PDSF (D), these 3 allo- and xenoantigens were absent. Inset images indicate the areas shown in the magnified views. Black arrows indicate the antigens of interest. Red arrows indicate arteries, and blue arrows indicate veins.
Fig. 3
Fig. 3
Proteomic profiling of PDSF. (A) Heatmap showing the fold changes in protein abundances in PDSF samples. (B) A Venn diagram of the numbers of proteins identified in PNS and PDSF. PDSF had significantly fewer proteins than PNS did. (C) A stacked bar graph shows the distribution of MS intensity among the matrisome subcategories for PNS and PDSF. (D) Quantitative analysis showed differences in the abundances of individual proteins in each matrisome and non-matrisome subcategory. Several proteins in both the matrisome and non-matrisome were enriched in PDSF. (E–I) GO functional classification in PDSF. (E) The most abundant and enriched proteins within the cellular component subset. (F) The network view of the cellular component subgroup grouped by function. The cutoff of the GO enrichment analysis was set to an adjusted P-value of 0.05. Enriched GO terms (those with a kappa score of ≥0.4) are depicted as nodes connected by lines that represent hierarchies and relationships among the terms. The node size reflects the significance of the term enrichment. Functionally similar terms are clustered together and are the same color. Only the names of the most significant terms within the clusters are shown. (G) The most abundant and enriched proteins within the biological process subgroup. (H) The network view of the biological process subgroup grouped by function. (I) The most abundant and enriched proteins within the molecular function subgroup. (J) A stacked bar graph shows the matrisome compositions by subcategory for PDSF, PDMM, and HDDM. (K) Quantitative analysis showed similar abundances of individual collagen proteins in the matrisomes of PDSF and PDMM. (For all panels, n = 3 biological replicates).
Fig. 4
Fig. 4
hASCs integrate with PDSF. (A) Confocal microscopy images show hASC growth on PDSF and 2D glass. Cells were stained with calcein AM (green) and ethidium homodimer-1 (red) 1, 3, and 7 days after seeding. (B) SEM images show hASC proliferation on PDSF from day 1 to day 7. The white boxes indicate the areas shown in the high-magnification images. (C) Cell body orientation reflected an alignment pattern of hASC growth on both the serosa and muscularis sides of PDSF. (D) A differentiation assay showed that PDSF extraction−conditioned medium significantly induced hASC adipogenesis and osteogenesis. (D&E) Oil-Red-O staining. Lipid droplets occurred in the peripheral area on day 3 (D) in the experimental group but occurred in fewer areas on day 6 (E) in the control group. (F) Alizarin-Red-S staining. Significantly more calcium deposition was observed in the experimental group than in the control group on day 10. (G) Differences in adipocyte differentiation between CDM and DM. *P < 0.05. (H) Differences in osteogenesis between CDM and DM. *P < 0.05. The Student t-test was used for comparisons between 2 groups, as appropriate. ANOVA was used for comparisons among multiple groups, as appropriate.
Fig. 4
Fig. 4
hASCs integrate with PDSF. (A) Confocal microscopy images show hASC growth on PDSF and 2D glass. Cells were stained with calcein AM (green) and ethidium homodimer-1 (red) 1, 3, and 7 days after seeding. (B) SEM images show hASC proliferation on PDSF from day 1 to day 7. The white boxes indicate the areas shown in the high-magnification images. (C) Cell body orientation reflected an alignment pattern of hASC growth on both the serosa and muscularis sides of PDSF. (D) A differentiation assay showed that PDSF extraction−conditioned medium significantly induced hASC adipogenesis and osteogenesis. (D&E) Oil-Red-O staining. Lipid droplets occurred in the peripheral area on day 3 (D) in the experimental group but occurred in fewer areas on day 6 (E) in the control group. (F) Alizarin-Red-S staining. Significantly more calcium deposition was observed in the experimental group than in the control group on day 10. (G) Differences in adipocyte differentiation between CDM and DM. *P < 0.05. (H) Differences in osteogenesis between CDM and DM. *P < 0.05. The Student t-test was used for comparisons between 2 groups, as appropriate. ANOVA was used for comparisons among multiple groups, as appropriate.
Fig. 5
Fig. 5
PDSF-hASC synergy induces monocytes towards M2 macrophage polarization. (A) The experimental design of the indirect co-culturing of monocytes and hASCs in vitro (n = 3 replicates). (B–F) Representative flow cytometry dot plots of monocytes allowed to differentiate for 7 days in the presence of various conditions: B shows the isotype control; C, group 1 (G1); D, group 2 (G2); E, group 3 (G3); and F, group 4 (G4). (G) Rates of CD14, CD16, CD206, and HILA-DR expression among day 7 monocytes differentiated under various conditions. *P < 0.05 vs. G1 and G2; **P < 0.05 vs. G1, G2, and G3; ***P < 0.01 vs. G1, G2, and G3; §P < 0.05 vs. G1 and G2; #P < 0.05 vs. G1. (H) IL-10 secretion in fresh medium following coculture. §P < 0.01 vs. G1 and G2 on day 3; *P < 0.05 vs. G3 on day 3; #P < 0.05 vs. G2, G3, and G4 on day 7. (I) VEGF secretion in collected fresh medium following coculture. *P < 0.05 vs. G1, G2, and G3 at the same time point; §P < 0.05 vs. G1 and G2 at the same time point. (J) IL-6 secretion in fresh medium following coculture. *P < 0.05 vs. G1, G2, and G3 at same time point; §P < 0.05 vs. G1 and G2 on day 7. (K–M) IL-6 secretion in collected fresh medium following various culture conditions. *P < 0.05 vs. the control group at the same time point; §P < 0.05 vs. the same group on day 5 and day 7. (N) Representative film of the human growth factor array. Six growth factors were detected in collected fresh medium on day 7. (O) Densitometry analysis of growth factor expression. G3 and G4 had significantly higher expression of both VEGF and IGFBP. *P < 0.05 vs. G1, G2, and G3; §P < 0.05 vs. G1 and G2. (P) Representative phase-contrast images of aortic rings cultured with various conditioned media on day 7. The G4-conditioned medium resulted in significant vessel outgrowth from the aortic ring. (Q) Light microscopy image of microvessel outgrowth (black arrows) from the aortic ring (asterisk) of G4. (R&S) For G4, 2-photon excitation microscopy revealed the outgrowth of CD31+ endothelial cells (green) and SMA + smooth muscle cells (red) from the aortic ring (asterisk), which formed a microvascular network (white arrows) both outside the ring (R) and inside the ring (S). (T) A large vessel outgrowth (white arrow) from the aortic ring (asterisk) of G4. The scale bars on the x-ases in R-T are 50 μm. (U) Aortic ring microvessel density measured on day 7. *P < 0.05 vs. G1, G2, and G3; #P < 0.05 vs. G1 and G2. The Student t-test was used for comparisons between 2 groups, as appropriate. ANOVA was used for comparisons among multiple groups, as appropriate. (V) A hypothetical model of hASC-induced M2 polarization. PDSF integration activates hASCs to constitutively produce IL-6, which skews CD14+ M0 monocytes towards anti-inflammatory, IL-10–producing M2 macrophages via a negative feedback mechanism. In turn, PDSF-hASC synergy has anti-inflammatory, immunomodulatory, and angiogenic properties that are initiated by and dependent on hASCs' secretion of soluble factors such as IL-6, VEGF, and IGF.
Fig. 5
Fig. 5
PDSF-hASC synergy induces monocytes towards M2 macrophage polarization. (A) The experimental design of the indirect co-culturing of monocytes and hASCs in vitro (n = 3 replicates). (B–F) Representative flow cytometry dot plots of monocytes allowed to differentiate for 7 days in the presence of various conditions: B shows the isotype control; C, group 1 (G1); D, group 2 (G2); E, group 3 (G3); and F, group 4 (G4). (G) Rates of CD14, CD16, CD206, and HILA-DR expression among day 7 monocytes differentiated under various conditions. *P < 0.05 vs. G1 and G2; **P < 0.05 vs. G1, G2, and G3; ***P < 0.01 vs. G1, G2, and G3; §P < 0.05 vs. G1 and G2; #P < 0.05 vs. G1. (H) IL-10 secretion in fresh medium following coculture. §P < 0.01 vs. G1 and G2 on day 3; *P < 0.05 vs. G3 on day 3; #P < 0.05 vs. G2, G3, and G4 on day 7. (I) VEGF secretion in collected fresh medium following coculture. *P < 0.05 vs. G1, G2, and G3 at the same time point; §P < 0.05 vs. G1 and G2 at the same time point. (J) IL-6 secretion in fresh medium following coculture. *P < 0.05 vs. G1, G2, and G3 at same time point; §P < 0.05 vs. G1 and G2 on day 7. (K–M) IL-6 secretion in collected fresh medium following various culture conditions. *P < 0.05 vs. the control group at the same time point; §P < 0.05 vs. the same group on day 5 and day 7. (N) Representative film of the human growth factor array. Six growth factors were detected in collected fresh medium on day 7. (O) Densitometry analysis of growth factor expression. G3 and G4 had significantly higher expression of both VEGF and IGFBP. *P < 0.05 vs. G1, G2, and G3; §P < 0.05 vs. G1 and G2. (P) Representative phase-contrast images of aortic rings cultured with various conditioned media on day 7. The G4-conditioned medium resulted in significant vessel outgrowth from the aortic ring. (Q) Light microscopy image of microvessel outgrowth (black arrows) from the aortic ring (asterisk) of G4. (R&S) For G4, 2-photon excitation microscopy revealed the outgrowth of CD31+ endothelial cells (green) and SMA + smooth muscle cells (red) from the aortic ring (asterisk), which formed a microvascular network (white arrows) both outside the ring (R) and inside the ring (S). (T) A large vessel outgrowth (white arrow) from the aortic ring (asterisk) of G4. The scale bars on the x-ases in R-T are 50 μm. (U) Aortic ring microvessel density measured on day 7. *P < 0.05 vs. G1, G2, and G3; #P < 0.05 vs. G1 and G2. The Student t-test was used for comparisons between 2 groups, as appropriate. ANOVA was used for comparisons among multiple groups, as appropriate. (V) A hypothetical model of hASC-induced M2 polarization. PDSF integration activates hASCs to constitutively produce IL-6, which skews CD14+ M0 monocytes towards anti-inflammatory, IL-10–producing M2 macrophages via a negative feedback mechanism. In turn, PDSF-hASC synergy has anti-inflammatory, immunomodulatory, and angiogenic properties that are initiated by and dependent on hASCs' secretion of soluble factors such as IL-6, VEGF, and IGF.
Fig. 6
Fig. 6
PDSF-hASC constructs support the interconnection and proliferation of HSMMs and HUVECs. (A) Two-photon excitation microscopy reveals that HSMMs (red) grew well on 2D glass, collagen gel, and PDSF but that these cells elongated and formed clear alignment patterns on only PDSF. (B) Cocultures of HSMMs and HUVECs on 2D glass, collagen gel, and PDSF. Both cell types grew well; however, HUVECs (green) did not form vessel-like networks on all surfaces, and HSMMs (red) branched and aligned on only PDSF. (C) Tricultures of hASCs, HSMMs, and HUVECs on 2D glass, collagen gel, and PDSF. With hASCs present, HUVECs (green) formed vessel networks on all surfaces. On PDSF in particular, HUVECs formed vascular-like networks entangled with elongated and aligned HSMMs (red) by day 14. The scale bars on the x-ases in A-C are 50 μm. (D–I) Image analysis revealed that HSMMs—alone or in co- or triculture conditions—proliferated on PDSF, as evidenced by cell numbers (D), cell length (F), dendritic body formations (G), and cell body alignment (H&I). Moreover, HUVEC growth on all 3 surfaces was significantly increased in the triculture condition (E). (D: *P < 0.05 vs. the same surface on day 7 and 2D glass on day 14 within the same culture condition; #P < 0.05 vs. the same surface on day 7 and 2D glass and collagen gel on day 14 within the triculture condition. F&G: *P < 0.05 vs. 2D glass and collagen gel at the same time point within the same culture condition. E: *P < 0.05 vs. the same surface on day 14 within the coculture conditions and day 7 within the triculture condition. The Student t-test was used for comparisons between 2 groups, as appropriate. ANOVA was used for comparisons among multiple groups, as appropriate.
Fig. 6
Fig. 6
PDSF-hASC constructs support the interconnection and proliferation of HSMMs and HUVECs. (A) Two-photon excitation microscopy reveals that HSMMs (red) grew well on 2D glass, collagen gel, and PDSF but that these cells elongated and formed clear alignment patterns on only PDSF. (B) Cocultures of HSMMs and HUVECs on 2D glass, collagen gel, and PDSF. Both cell types grew well; however, HUVECs (green) did not form vessel-like networks on all surfaces, and HSMMs (red) branched and aligned on only PDSF. (C) Tricultures of hASCs, HSMMs, and HUVECs on 2D glass, collagen gel, and PDSF. With hASCs present, HUVECs (green) formed vessel networks on all surfaces. On PDSF in particular, HUVECs formed vascular-like networks entangled with elongated and aligned HSMMs (red) by day 14. The scale bars on the x-ases in A-C are 50 μm. (D–I) Image analysis revealed that HSMMs—alone or in co- or triculture conditions—proliferated on PDSF, as evidenced by cell numbers (D), cell length (F), dendritic body formations (G), and cell body alignment (H&I). Moreover, HUVEC growth on all 3 surfaces was significantly increased in the triculture condition (E). (D: *P < 0.05 vs. the same surface on day 7 and 2D glass on day 14 within the same culture condition; #P < 0.05 vs. the same surface on day 7 and 2D glass and collagen gel on day 14 within the triculture condition. F&G: *P < 0.05 vs. 2D glass and collagen gel at the same time point within the same culture condition. E: *P < 0.05 vs. the same surface on day 14 within the coculture conditions and day 7 within the triculture condition. The Student t-test was used for comparisons between 2 groups, as appropriate. ANOVA was used for comparisons among multiple groups, as appropriate.
Fig. 7
Fig. 7
Prevascularization of PDSF with perfusions of cocultured hASCs and HUVECs. (A) Two-photon excitation microscopy front views showed capillary-like structures in transparent (top panel), surface (middle panel), and maximum rendering views (bottom panel); these structures developed into a more interconnected network of vascular branches in PDSF from week 1 to week 2 and week 3. (B) Cross section views showed that the vascular network encapsulated (week 1–2) and then penetrated (week 3) the PDSF parenchyma. (C) The vascular tree became bigger, denser, and more complex along the re-endothelialized perforators, which arose from the pedicle, and spread throughout the matrix from week 1 to week 2 and week 3. (D) Main pedicle endothelialization increased with culturing time. The scale bars on the x-ases in A-D are 50 μm. (E–I) Imaging analysis revealed significant increases in the total area and volume of the endothelialized vessel network in PDSF (E–G) and in the endothelialized lumen area of the main pedicle (H&I). *P < 0.05 vs. week 1 and week 2. ANOVA was used for comparisons among multiple groups, as appropriate.
Fig. 8
Fig. 8
Immunomodulatory properties of PDSF in a xenotransplantation model. IHC analysis indicated that the host accepted the PDSF graft without immunorejection 2 weeks (A) and 4 weeks (B) postoperatively. The pathobiological characteristics of PDSF xenotransplantation closely resembled those of the implantation of RNM and RNS from Fischer rats into syngeneic recipients in terms of inflammatory and immune cell infiltration and distribution. In these 3 groups, cellular infiltration occurred along with neovascularization from the peripheral area to the central area of the graft postoperatively. The implanted PDSF resulted in a foreign body reaction that was marked by the predominant infiltration of CD163+ M2 macrophages and FoxP3+ T-regs in the graft. The dominant presence of inflammatory M2 macrophages and T-regs induced the graft to undergo constructive remodeling, as evidenced by the myogenesis revealed by Masson trichrome and MyoD1 staining. Thirty days after the subcutaneously placement of PDSF, most of the graft was still collagen-based connective tissue undergoing myogenic regeneration. Compared with PDSF, RNM, and RNS, fresh xenografts from PNM and PNS stimulated strong immunorejection postoperatively, as evidenced by severe inflammation characterized by significant CD80+ macrophage and CD3+ T-cell infiltration that caused the graft to lose structure and disintegrate. Inset images indicate the areas shown in the magnified views. Black arrows indicate the positive stains of interest. The scale bars in A and B are 50 μm. (C) Differences in muscle regeneration, T-cell infiltration, and macrophage polarization among grafts. *P < 0.05 vs. each PNM and PNS at the same time point; §P < 0.01 vs. each PNM and PNS at the same time point; #P < 0.05 vs. PNM at week 2. The Student t-test was used for comparisons between 2 groups, as appropriate. ANOVA was used for comparisons among multiple groups, as appropriate.
Fig. 9
Fig. 9
Reconstruction of VML with prevascularized PDSF in a full-thickness abdominal wall defect model. (A–D) Morphologically the implants showed healing and integration with surrounding muscle tissue at 1 month and 3 months after surgery. Several communicating blood vessels (white arrows) arising from the deep inferior epigastric artery (black arrows) grew into the grafts; the numbers of these vessels were particularly increased in both groups at 3 months (C&D) and in the prevascularized PDSF group at 1 month (A). Explanted grafts were cut into 3 pieces, as indicated by the dashed lines; piece 2 was used for mechanical tests, and pieces 1 and 3 were used for IHC analysis (B). (E–L) Dextran-perfused functional blood vessels (green) revealed neovascularization in the grafts. At 1 month, the functional blood vessel density was significantly greater in prevascularized PDSF than in non-prevascularized PDSF. The numbers of these vessels continuously increased in both groups by 3 months. Red arrows indicate arteries; white arrows indicate veins. (M − P) IHC staining revealed remodeling of the central part of the non-prevascularized PDSF at 1 month (M) and 3 months (O) and remodeling of the central part of the prevascularized PDSF at 1 month (N) and 3 months (P). H&E and Masson trichrome staining 3 months after graft placement revealed that collagen-based connective tissue (blue) remained the main component of the grafts and that dense collagen bundles with oriented fibril structures were characteristic of mature fascia structures. In both types of grafts, many muscle tissues (pink) were distributed across the collagen matrix; desmin and MyoD1 staining (black arrows) confirmed these to be regenerated muscle bundles. Abundant desmin + cells aggregated as thick muscle islands in the prevascularized PDSF grafts (N&P). CD31+ microvascular capillaries (red arrows) distributed throughout the tissue sections confirmed the grafts' neovascularization. CD68+ macrophages (green arrows) infiltrated all explants. Compared with CD80+ M1 macrophages (green arrows), CD163+ M2 macrophages (green arrows) were the predominant subtype, especially in prevascularized PDSF (N&P). (Q) IHC with anti-HuNu antibodies was used to detect pre-seeded human cells in the prevascularized PDSF at 1 month. Most of these cells were hASCs (black arrows), and a few were HUVECs (red arrows) that presented in vascular structures. At 3 months, few pre-seeded human cells were detected, which suggests that most of these cells had degraded by this time. (R) Differences in muscle regeneration, blood vessel density, and macrophage polarization between non-prevascularized PDSF and prevascularized PDSF. *P < 0.05 vs. non-prevascularized PDSF at the same time point; §P < 0.05 vs. the same group at 1 month. The Student t-test was used for comparisons between 2 groups, as appropriate. ANOVA was used for comparisons among multiple groups, as appropriate. Inset images indicate the areas shown in the magnified views.
Fig. 9
Fig. 9
Reconstruction of VML with prevascularized PDSF in a full-thickness abdominal wall defect model. (A–D) Morphologically the implants showed healing and integration with surrounding muscle tissue at 1 month and 3 months after surgery. Several communicating blood vessels (white arrows) arising from the deep inferior epigastric artery (black arrows) grew into the grafts; the numbers of these vessels were particularly increased in both groups at 3 months (C&D) and in the prevascularized PDSF group at 1 month (A). Explanted grafts were cut into 3 pieces, as indicated by the dashed lines; piece 2 was used for mechanical tests, and pieces 1 and 3 were used for IHC analysis (B). (E–L) Dextran-perfused functional blood vessels (green) revealed neovascularization in the grafts. At 1 month, the functional blood vessel density was significantly greater in prevascularized PDSF than in non-prevascularized PDSF. The numbers of these vessels continuously increased in both groups by 3 months. Red arrows indicate arteries; white arrows indicate veins. (M − P) IHC staining revealed remodeling of the central part of the non-prevascularized PDSF at 1 month (M) and 3 months (O) and remodeling of the central part of the prevascularized PDSF at 1 month (N) and 3 months (P). H&E and Masson trichrome staining 3 months after graft placement revealed that collagen-based connective tissue (blue) remained the main component of the grafts and that dense collagen bundles with oriented fibril structures were characteristic of mature fascia structures. In both types of grafts, many muscle tissues (pink) were distributed across the collagen matrix; desmin and MyoD1 staining (black arrows) confirmed these to be regenerated muscle bundles. Abundant desmin + cells aggregated as thick muscle islands in the prevascularized PDSF grafts (N&P). CD31+ microvascular capillaries (red arrows) distributed throughout the tissue sections confirmed the grafts' neovascularization. CD68+ macrophages (green arrows) infiltrated all explants. Compared with CD80+ M1 macrophages (green arrows), CD163+ M2 macrophages (green arrows) were the predominant subtype, especially in prevascularized PDSF (N&P). (Q) IHC with anti-HuNu antibodies was used to detect pre-seeded human cells in the prevascularized PDSF at 1 month. Most of these cells were hASCs (black arrows), and a few were HUVECs (red arrows) that presented in vascular structures. At 3 months, few pre-seeded human cells were detected, which suggests that most of these cells had degraded by this time. (R) Differences in muscle regeneration, blood vessel density, and macrophage polarization between non-prevascularized PDSF and prevascularized PDSF. *P < 0.05 vs. non-prevascularized PDSF at the same time point; §P < 0.05 vs. the same group at 1 month. The Student t-test was used for comparisons between 2 groups, as appropriate. ANOVA was used for comparisons among multiple groups, as appropriate. Inset images indicate the areas shown in the magnified views.

Similar articles

Cited by

References

    1. Shores J.T., Brandacher G., Lee W.P. Hand and upper extremity transplantation: an update of outcomes in the worldwide experience. Plast. Reconstr. Surg. 2015;135:351e–360e. doi: 10.1097/PRS.0000000000000892. - DOI - PubMed
    1. Kueckelhaus M., Fischer S., Seyda M., Bueno E.M., Aycart M.A., Alhefz M., ElKhal A., Pomahac B., Tullius S.G. Vascularized composite allotransplantation: current standards and novel approaches to prevent acute rejection and chronic allograft deterioration. Transpl. Int. 2016;29:655–662. doi: 10.1111/tri.12652. - DOI - PMC - PubMed
    1. Siemionow M., Nasir S. Chimerism and bone marrow-based therapies in transplantation. Microsurgery. 2007;27:510–521. doi: 10.1002/micr.20395. - DOI - PubMed
    1. Siemionow M., Ortak T., Izycki D., Oke R., Cunningham B., Prajapati R., Zins J.E. Induction of tolerance in composite-tissue allografts. Transplantation. 2002;74:1211–1217. doi: 10.1097/00007890-200211150-00002. - DOI - PubMed
    1. Gholobova D., Terrie L., Gerard M., Declercq H., Thorrez L. Vascularization of tissue-engineered skeletal muscle constructs. Biomaterials. 2019;235 doi: 10.1016/j.biomaterials.2019.119708. - DOI - PubMed

LinkOut - more resources