. 2022 Nov 3:22:567-587.
doi: 10.1016/j.bioactmat.2022.10.025. eCollection 2023 Apr.

Biomimetic nanoparticles drive the mechanism understanding of shear-wave elasticity stiffness in triple negative breast cancers to predict clinical treatment

Affiliations

Biomimetic nanoparticles drive the mechanism understanding of shear-wave elasticity stiffness in triple negative breast cancers to predict clinical treatment

Dongdong Zheng et al. Bioact Mater. .

Abstract

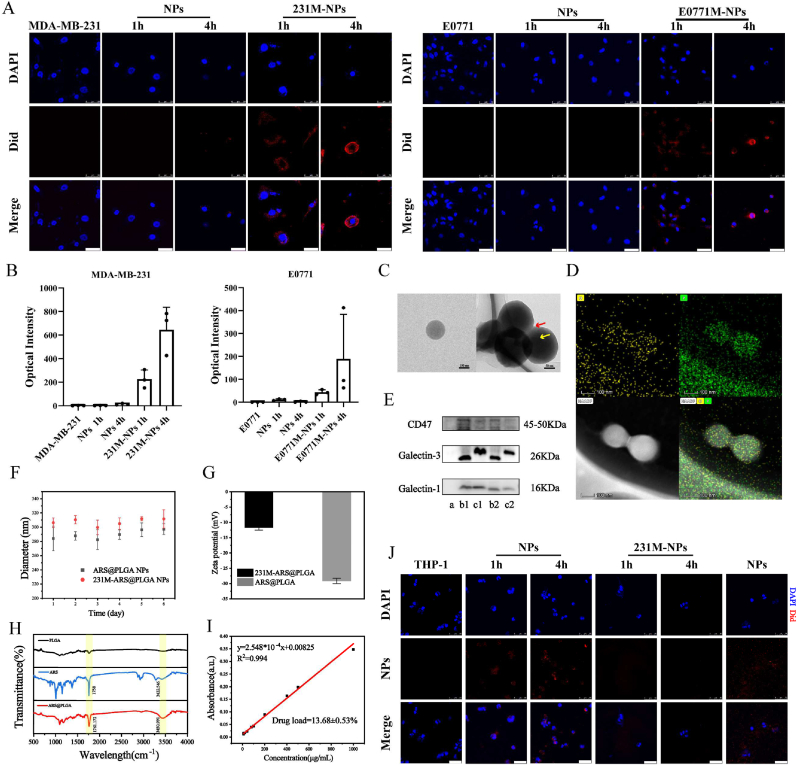
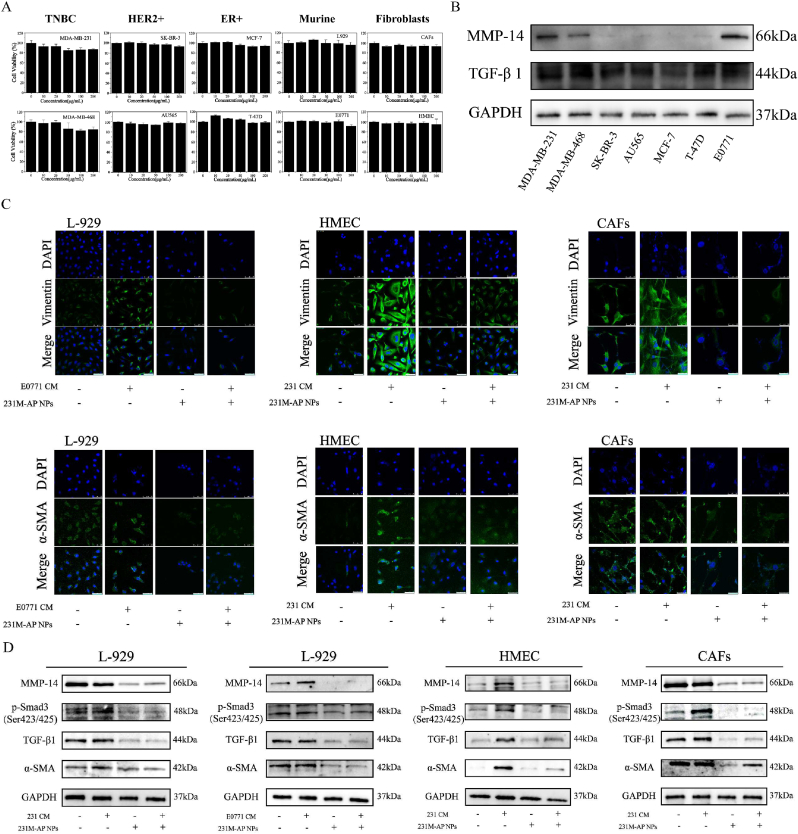
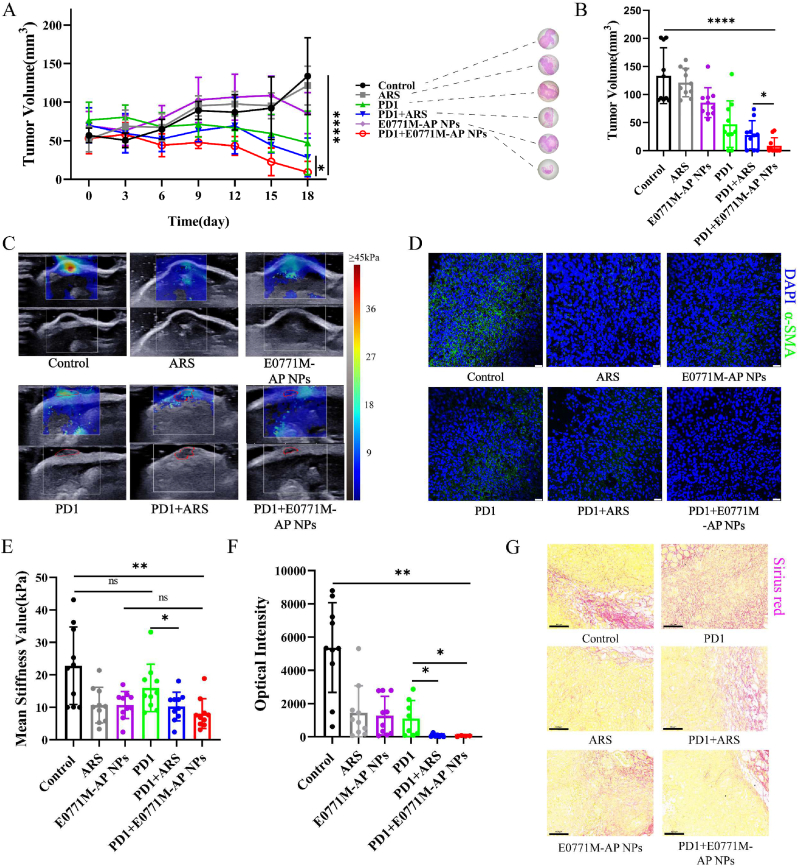
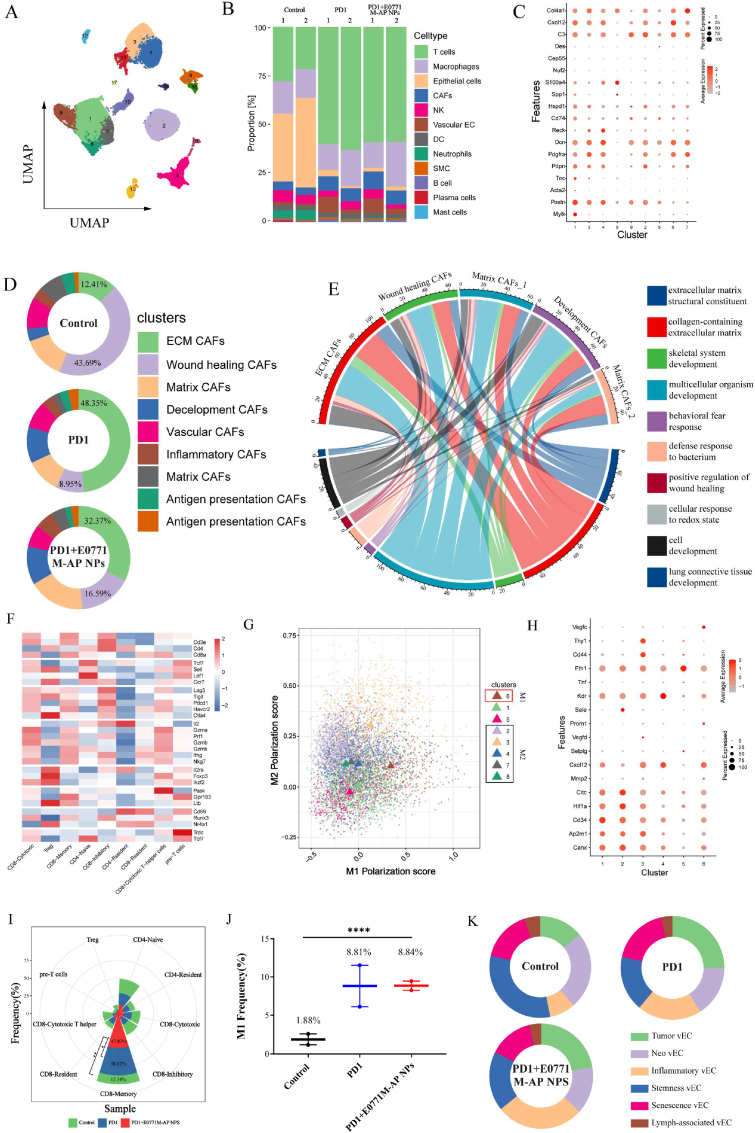
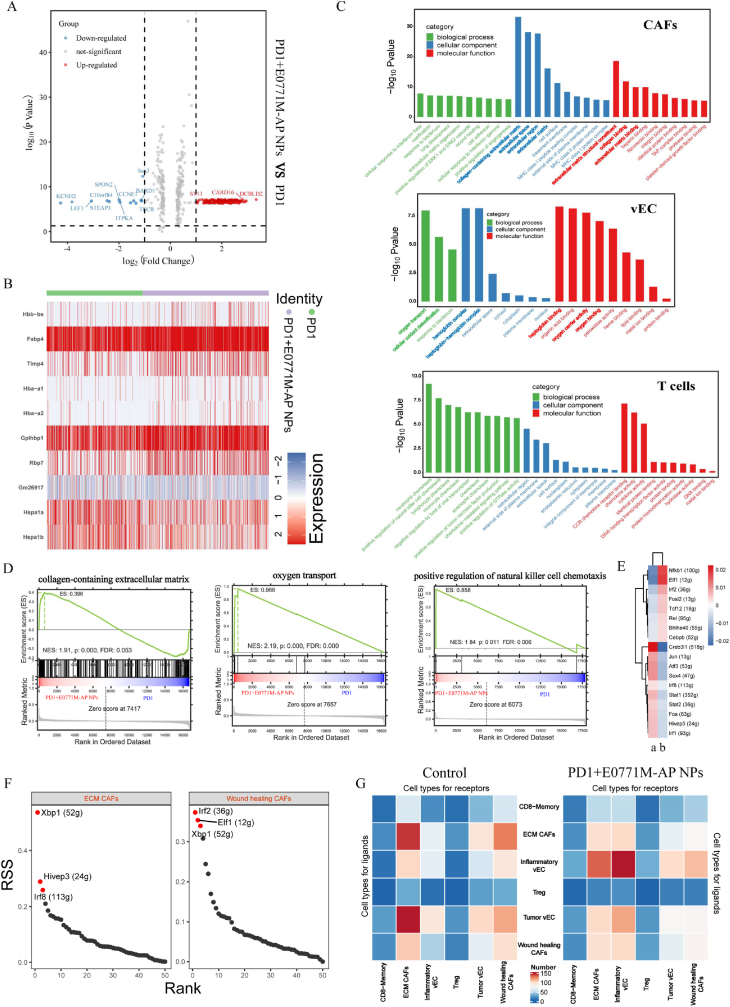
In clinical practice, we noticed that triple negative breast cancer (TNBC) patients had higher shear-wave elasticity (SWE) stiffness than non-TNBC patients and a higher α-SMA expression was found in TNBC tissues than the non-TNBC tissues. Moreover, SWE stiffness also shows a clear correlation to neoadjuvant response efficiency. To elaborate this phenomenon, TNBC cell membrane-modified polylactide acid-glycolic acid (PLGA) nanoparticle was fabricated to specifically deliver artesunate to regulate SWE stiffness through inhibiting CAFs functional status. As tested in MDA-MB-231 and E0771 orthotopic tumor models, CAFs functional status inhibited by 231M-ARS@PLGA nanoparticles (231M-AP NPs) had reduced the SWE stiffness as well as attenuated hypoxia of tumor as tumor soil loosening agent which amplified the antitumor effects of paclitaxel and PD1 inhibitor. Single-cell sequencing indicated that the two main CAFs (extracellular matrix and wound healing CAFs) that produces extracellular matrix could influence the tumor SWE stiffness as well as the antitumor effect of drugs. Further, biomimetic nanoparticles inhibited CAFs function could attenuate tumor hypoxia by increasing proportion of inflammatory blood vessels and oxygen transport capacity. Therefore, our finding is fundamental for understanding the role of CAFs on affecting SWE stiffness and drugs antitumor effects, which can be further implied in the potential clinical theranostic predicting in neoadjuvant therapy efficacy through non-invasive analyzing of SWE imaging.

Keywords: Biomimetic nanoparticles; Cancer-associated fibroblasts; Shear-wave elasticity imaging; Theranostic prediction.


Conflict of interest statement

The authors declare that they have no competing interests.

Figures

Image 1
Graphical abstract
Scheme. 1
Scheme. 1
Schematic illustration of this study outline. (A) The preparation procedure of biomimetic nanoparticles. (B&C) Based on clinical data analysis, we established MDA-MB-231 and E0771 orthotopic tumor models to explore the mechanism by which shear wave elastic imaging can predict TNBC treatment efficacy.
Fig. 1
Fig. 1
Clinical samples analysis. (A) Linear fitting analysis of patient SWE stiffness and pathological score in scatter plot. The data distribution was showed in histogram. (TNBC n = 131, non-TNBC n = 102). (B) Representative SWE images of TNBC and non-TNBC patients. (C) Boxplot of SWE stiffness value, Ki67 value, and CD8 value in 131 TNBC patients and 102 non-TNBC patients. The percentage values of Ki67 and CD8 were not continuous, but an integer multiple of 5%. (D) Immunohistochemical microarray panoramas of α-SMA expression in breast cancer tissue from 50 TNBC patients and 50 non-TNBC patients. (E) Representative images of α-SMA expression in the immunohistochemistry of TNBC and non-TNBC. Scale bar: 500 μm. (F) Quantitative results of α-SMA positive stained area in tissue microarray (each group n = 50). (G) Representative images of patients before and after neoadjuvant SWE imaging. The gray scale image contained measurements of tumor cross-section length and width. (H) Linear fitting analysis of patient SWE stiffness score and neoadjuvant remission rate in scatter plot. The score formula was showed in this graph (n = 14). Data expressed as mean ± SD.
Fig. 2
Fig. 2
Characterization of biomimetic nanoparticles. (A) The CLSM images of homologous aggregation targeting experiments in vitro (cell: blue, NPs: red), scale bar: 50 μm. (B) Quantification results of optical intensity for each cell selected at random (n = 3). (C) FETEM images of AP NPs and 231M-AP NPs, the image on right side showed that the nanoparticles (yellow arrow) were coated with cell membrane (red arrow), scale bar: right: 50 nm, left: 100 nm. (D) FETEM elemental mapping of 231M-NPs, O (yellow), P (green), HAADF (gray), scale bar: 100 nm. (E) Western blot analysis of (a) NPs, (b1) 231 cell membrane, (c1) E0771 cell membrane, (b2) 231M-NPs, and (c2) E0771M-NPs. (F) Stability of NPs and 231M-NPs in water (n = 3). (G) Zeta potentials of bare nanoparticles and 231M-NPs (n = 3). (H) FTIR spectroscopy of PLGA, ARS, and AP NPs. (I) Concentration-Absorbance standard curve of ARS methanol solution at 222 nm (n = 3). (J) CLSM images of biomimetic nanoparticles (or NPs) immune escape in vitro. THP-1 (blue), 231M-NPs and NPs (red), scale bar: 50 μm. Data expressed as mean ± SD.
Fig. 3
Fig. 3
231M-AP NPs inhibition of CAFs function in vitro. (A) Cell toxicity of 231M-AP NPs on different cell lines with different nanoparticles concentrations for 24 h incubation (n = 4). (B) Western Blot analysis of promoting fibrosis ability in different breast cancer cell lines. (C) The CLSM images of 231M-AP NPs inhibiting fibroblast activation (cell: blue, maker protein: green), scale bar: 50 μm. (D) Western Blot analysis of 231M-AP NPs inhibiting fibrogenesis. Data expressed as mean ± SD.
Fig. 4
Fig. 4
Artesunate mediated anti-tumor and SWE stiffness reversal effects in vivo. (A) Tumor volume curve in different groups during the 27-day monitoring period (n = 10). (B) Photograph of each tumor in different groups of mice on 27th day of treatment. (C) Tumor weight of mice in different groups (n = 10). (D) Body weight of mice in different groups on 27th day of treatment (n = 10). (E) Representative SWE images of tumors in different groups, each image is composed of pseudo-color image and gray-scale image. (F) Quantization results of ROI (diameter: 1 mm) in SWE images for tumors in different groups (n = 10, group ARS: n = 9). (G) Representative immunofluorescence images of HIF-1α (green) and α-SMA (green) staining of tumor tissue (blue) in different groups. Scale bar in low magnification: 500 μm, scale bar in high magnification: 100 μm. (H) The Sirius red staining and immunohistochemical images of tumor tissue in different groups under different magnifications (low magnification: 40 × , high magnification: 400 × ). (I) & (J) Quantification of HIF-1α and α-SMA biomarkers in tissue immunofluorescence sections (n = 10, group ARS: n = 8). Data expressed as mean ± SD.
Fig. 5
Fig. 5
E0771M-AP NPs mediated SWE stiffness reversal through inhibiting CAFs function status in tumor. (A) Tumor volume curve in different groups during the 18-day monitoring period. Representative images of H&E sections of mouse tumor from different groups were used to compare the therapeutic effects of different groups (n = 10). (B) Tumor volume of mice in different groups at 18th day (n = 10). (C) Representative SWE images of tumors in different groups. The red curve marked as tumor contour. (D) Representative tissue immunofluorescence images of the expression of α-SMA (green) in tumor tissue from different mouse groups, scale bar: 25 μm. (E) Quantization results of ROI (diameter: 1 mm) of tumor SWE images in different groups (n = 10). (F) Image J quantization results of α-SMA fluorescence in immunofluorescence. (Group: Control, ARS, E0771M-AP NPs, n = 10; group: PD1, n = 8; group: ARS + PD1, n = 7; group: PD1+E0771M-AP NPs, n = 4). (G) Representative microscope images of Sirius red stained tumor tissues in various groups (scale bar = 100 μm). Data expressed as mean ± SD.
Fig. 6
Fig. 6
E0771M-AP NPs mediated tumor microenvironment remodeling through attenuating hypoxia. (A) Representative images of photoacoustic imaging to assess blood oxygen level within tumor. The yellow curve marked non-hypoxic area, the green curve marked as hypoxic area, and the red curve marked as necrotic area. (B) Quantization results of ROI (along the margin of tumor) of tumor photoacoustic images in different groups (n = 5). (C) Flow cytometry was used to analyze the proportion of CD8+ T (PE) cells and CD4+ T (APC) cells in immune cells (FITC anti-CD3) of different body parts (n = 5). (D) Representative tissue immunofluorescence images of the expression of CD8 (green), CD4 (red), and HIF-1α (pink) in tumor tissue of different mouse groups. The yellow curve showed the region of HIF-1α high expression and CD8 low expression, scale bar: 100 μm (E&F) Image J quantization results of CD8, HIF-1α fluorescence in immunofluorescence from left to right successively. (Group: Control, ARS, E0771M-AP NPs, n = 10; group: PD1, n = 8; group: ARS + PD1, n = 7; group: PD1+E0771M-AP NPs, n = 4). (G) Western Blot analysis of the DDR1, HIF-1α, MMP-14, α-SMA expression on tumor tissue in different groups (n = 2). Data are represented as mean ± SD.
Fig. 7
Fig. 7
Distribution of the biomimetic nanoparticles in vivo. (A–B) Representative images and quantification bioluminescence of breast tumor mice model in different groups (n = 5). (C) Representative immunofluorescence images of NPs (red) accumulation in tumor tissue (blue) through tumor blood vessels (green), scale bar in low magnification: 200 μm, scale bar in high magnification: 100 μm. Data expressed as mean ± SD.
Fig. 8
Fig. 8
Single cell sequencing analysis of mouse tumors. (A) An uniform manifold approximation and projection (UMAP) view of 39968 single cells, color-coded by assigned cell type. (B) Proportion of each cell type in individuals. (C) Dot plot showing gene expression pattern of each cluster, which dot size and color indicate the fraction of expressing cells and average scaled expression value, respectively. (D) Pie chart of different CAFs subtypes proportion in different groups. (E) Chord diagram based on the relationship between gene expression of different CAFs subtypes and specific pathways. (F) The heatmap of makers in different clusters, which can help identify cell type. (G) Scatter plot of polarization score of macrophages in each cluster. The red box is M1 macrophages, the black box is M2 macrophages. (H) Dot plot showing gene expression pattern of each vascular endothelial cell cluster, which dot size and color indicate the fraction of expressing cells and average scaled expression value, respectively. (I) The proportion of different T cell subtypes from T cells in rose chart (n = 2). (J) Scatter diagram of M1 macrophages proportion in different groups (n = 2). (K) Pie chart of vEC subtypes proportion in different groups. Data expressed as mean ± SD.
Fig. 9
Fig. 9
GO enrichment analysis of gene pathway between PD1+E0771M-AP NPs group and PD1 group. (A) Volcanic map of differential genes in cancer-associated fibroblasts between PD1 group and PD1+E0771M-AP NPs group. Typical genes were marked in the diagram. The threshold values were p < 0.05 and |log2FC| >1. (B) Heatmap of top 20 differential genes in vascular endothelial cells between PD1 group and PD1+E0771M-AP NPs group. (C) Gene pathway enrichment analysis based on gene differences between cancer associated fibroblasts, vascular endothelial cell, and T cells in PD1+E0771M-AP NPs group and PD1 group. Key pathways were marker in bold. (D) GSEA analysis between group PD1+E0771M-AP NPs and group PD1 based on differential expression genes. The graph was consisted of line chart of gene enrichment score and rank distribution of all genes. (E) The heat map of the most activity regulons in ECM CAFs and wound healing CAFs (a: ECM CAFs; b: wound healing CAFs). (F) The RSS ranking plot of the regulon with the highest specific correlation of ECM CAFs and Wound healing CAFs. The red dots are the top 3 regulons with highest score. (G) The heat map of ligand-receptor interaction pair number between different cell types in Control group and PD1 + E0771M-AP NPs group.
Scheme. 2
Scheme. 2
Schematic illustration of our study significance in translation medicine. Our work lays the foundation for the application of artificial intelligence based deep learning shear wave elastic imaging in clinical treatment prediction of TNBC patients.

Similar articles

Cited by

References

    1. Sun X., He X., Zhang Y., Hosaka K., Andersson P., Wu J., Wu J., Jing X., Du Q., Hui X., Ding B., Guo Z., Hong A., Liu X., Wang Y., Ji Q., Beyaert R., Yang Y., Li Q., Cao Y.A.-O. Inflammatory cell-derived CXCL3 promotes pancreatic cancer metastasis through a novel myofibroblast-hijacked cancer escape mechanism. Gut. 2022;71(1) - PubMed
    1. Chen X., Song E. Turning foes to friends: targeting cancer-associated fibroblasts, Nature reviews. Drug discovery. 2019;18:99–115. - PubMed
    1. Costa A., Kieffer Y., Scholer-Dahirel A., Pelon F., Bourachot B., Cardon M., Sirven P., Magagna I., Fuhrmann L., Bernard C., Bonneau C., Kondratova M., Kuperstein I., Zinovyev A., Givel A.M., Parrini M.C., Soumelis V., Vincent-Salomon A., Mechta-Grigoriou F. Fibroblast heterogeneity and immunosuppressive environment in human breast cancer. Cancer Cell. 2018;33:463–479. e10. - PubMed
    1. Sun X., Wu B.A.-O.X., Chiang H.A.-O., Deng H., Zhang X., Xiong W., Liu J., Rozeboom A.M., Harris B.T., Blommaert E.A.-O., Gomez A.A.-O.X., Garcia R.A.-O., Zhou Y.A.-O.X., Mitra P., Prevost M., Zhang D., Banik D., Isaacs C., Berry D., Lai C., Chaldekas K., Latham P.A.-O., Brantner C.A., Popratiloff A., Jin V.A.-O., Zhang N.A.-O., Hu Y., Pujana M.A.-O., Curiel T.A.-O., An Z.A.-O., Li R.A.-O. Tumour DDR1 promotes collagen fibre alignment to instigate immune exclusion. Nature. 2021;599:673–678. - PMC - PubMed
    1. Koikawa K., Kibe S., Suizu F., Sekino N., Kim N., Manz T.D., Pinch B.J., Akshinthala D., Verma A., Gaglia G., Nezu Y., Ke S., Qiu C., Ohuchida K., Oda Y., Lee T.H., Wegiel B., Clohessy J.G., London N., Santagata S., Wulf G.M., Hidalgo M., Muthuswamy S.K., Nakamura M., Gray N.S., Zhou X.Z., Lu K.P. Targeting Pin1 renders pancreatic cancer eradicable by synergizing with immunochemotherapy. Cell. 2021;184:4753–4771. - PMC - PubMed