. 2022;4(1):1497.
doi: 10.33011/livecoms.4.1.1497. Epub 2022 Aug 30.

Best practices for constructing, preparing, and evaluating protein-ligand binding affinity benchmarks [Article v0.1]

Affiliations

Best practices for constructing, preparing, and evaluating protein-ligand binding affinity benchmarks [Article v0.1]

David F Hahn et al. Living J Comput Mol Sci. 2022.

Abstract

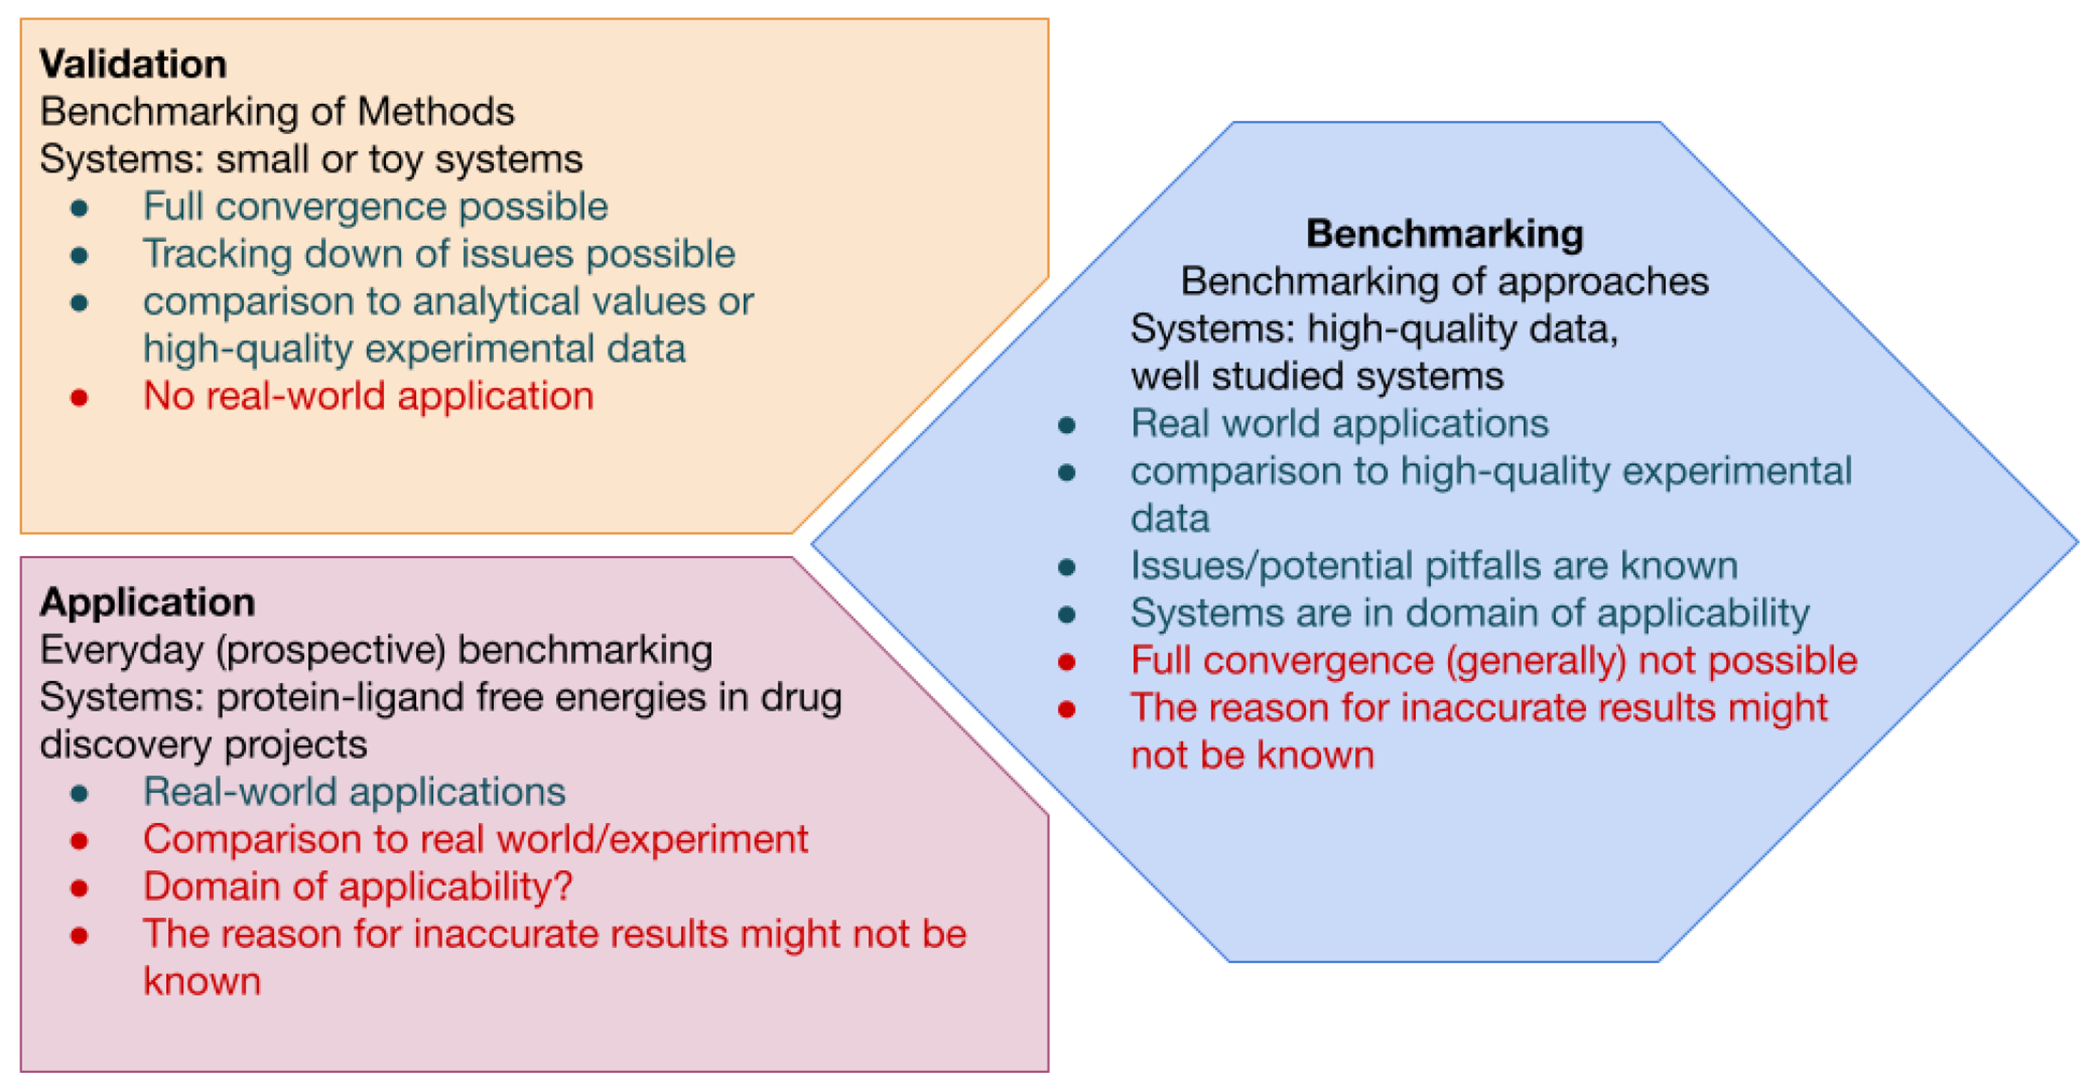
Free energy calculations are rapidly becoming indispensable in structure-enabled drug discovery programs. As new methods, force fields, and implementations are developed, assessing their expected accuracy on real-world systems (benchmarking) becomes critical to provide users with an assessment of the accuracy expected when these methods are applied within their domain of applicability, and developers with a way to assess the expected impact of new methodologies. These assessments require construction of a benchmark-a set of well-prepared, high quality systems with corresponding experimental measurements designed to ensure the resulting calculations provide a realistic assessment of expected performance when these methods are deployed within their domains of applicability. To date, the community has not yet adopted a common standardized benchmark, and existing benchmark reports suffer from a myriad of issues, including poor data quality, limited statistical power, and statistically deficient analyses, all of which can conspire to produce benchmarks that are poorly predictive of real-world performance. Here, we address these issues by presenting guidelines for (1) curating experimental data to develop meaningful benchmark sets, (2) preparing benchmark inputs according to best practices to facilitate widespread adoption, and (3) analysis of the resulting predictions to enable statistically meaningful comparisons among methods and force fields. We highlight challenges and open questions that remain to be solved in these areas, as well as recommendations for the collection of new datasets that might optimally serve to measure progress as methods become systematically more reliable. Finally, we provide a curated, versioned, open, standardized benchmark set adherent to these standards (PLBenchmarks) and an open source toolkit for implementing standardized best practices assessments (arsenic) for the community to use as a standardized assessment tool. While our main focus is free energy methods based on molecular simulations, these guidelines should prove useful for assessment of the rapidly growing field of machine learning methods for affinity prediction as well.


Conflict of interest statement

12Potentially Conflicting Interests DLM serves on the scientific advisory board for OpenEye Scientific Software and is an Open Science Fellow with Silicon Therapeutics. ASJSM is a consultant for Exscientia. JDC is a current member of the Scientific Advisory Board of OpenEye Scientific Software and a consultant to Foresite Laboratories. HEBM is employed by MSD.

Figures

Figure 1.
Figure 1.. Illustration of the definitions of Validation, Application, and Benchmarking used in this guide.
For each term, the definition, advantages (green) and potential short-comings (red) in terms of method evaluation are listed in the three panels. Validation (top left panel) uses systems that will confidently converge, the expected results are known, and the underlying issues are well understood. Validation sets allows robust development and improvement of methods. Application (bottom left panel) of a method, on the other hand, uses real-world systems and enables methods to be continuously evaluated on real-world applications of interest. Because the systems may not be well understood, it is possible for methods to fail in new ways that are difficult to detect. Benchmarking (right panel) bridges validation and application by aiming to assess the accuracy of real-world applications relative to experiment in cases where experimental data quality is not limiting and the method is known to be applied within its domain of applicability. Compared to validation, the size and complexity of the system may introduce challenges to producing robust, repeatable results.
Figure 2.
Figure 2.. Five ligand pairs (A, B) for different targets (with each pair for a single target) having structural differences which can be challenging to simulate.
(A) Eg5: charge change, (B) SHP2: charge move, (C) PDE10: linker change, (D) HIF2α: ring creation, (E) CDK8: ring size change.
Figure 3.
Figure 3.. The PDB structure validation report percentile score panels for the Jnk1 structures PDB IDs 2GMX and 3ELJ from the RCSB PDB.
(A) Note that 2GMX is a poorly ranked structure relative to all structures of similar resolution in the PDB. (B) In contrast 3ELJ is as good or better than structures of similar resolution or all structures in the PDB.
Figure 4.
Figure 4.. Examples of common challenges encountered when using X-ray crystal structures.
The protein is shown in green and the ligand in orange. If not stated differently, the 2Fo-Fc maps are illustrated as grey isomesh at 2σ level. (A) PDB ID 4PV0 shows poor density (at 3σ) for residues in the active site. The beta sheet loop at the top of the active site has residue side chains modeled with no density to support the conformation and the end of the loop has residues that are not modeled. (B) The recommended structure PDB ID 4PX6 for the same protein has complete density (and modeled atoms) for the whole loop (at 3σ). (C) PDB ID 5E89 shows poor ligand density, especially for the m-Cl-phenyl (left) and the hydroxymethyl (center). This means that the ligand conformation, as shown, is not specified by the data, and thus should not be used as input to a computational study unless there is additional data supporting this binding mode. (D) The ligand of PDB ID 1SNC has crystal contacts with the residues K70 and K71 (blue) of the neighboring unit that directly interact with the ligand, potentially affecting the binding mode relative to a solution environment. (E) PDB ID 3ZOV has two alternate side chain conformations. Residue R368 in the B conformation (magenta) has clearly more density (0.75σ) than the A conformation (blue). The B conformation interacts with the ligand (distance 3.2 Å) whereas the A conformation does not interact with the ligand (distance 6.5 Å). If the user does not look at both conformations and chooses A (by default), this would likely be incorrect and miss a potentially important protein-ligand interaction. (F) In PDB ID 5HNB, there is an excipient (formic acid) that interacts directly with the ligand (2.7 Å O-O distance shown in black). The formic acid could be replacing a bridging water. From the data it is not possible to determine how the excipient is affecting the ligand/protein conformation, but for a study of ligand binding in the absence of formic acid, this should be removed.
Figure 5.
Figure 5.. Examples of challenges encountered for ligand modelling using X-ray crystal structures.
The protein is shown in green and the ligand in orange. If not stated differently, the 2Fo-Fc maps are illustrated as grey isomesh at 2σ level. In some panels, the difference density Fo-Fc map is illustrated as cyan isomesh at +3σ level. (A) In PDB ID 3FLY, there is significant difference density, likely indicating that the ligand conformation is not modeled correctly. It is suspected that there is a low occupancy alternate conformation that is not modeled. (B) The suggested alternate structure of the same protein, PDB ID 6SFI, has no difference density. (C) PDB ID 2ZFF shows unexplained electron density in the binding pocket (difference map, bottom, center, cyan). This could be either water or a Na+ ion, as Na+ is present and modeled in other sites.
Figure 6.
Figure 6.. Experimental uncertainties can be on the order of 0.64 kcal mol−1.
The binding affinity of 365 molecules assayed by two different methods for the open source COVID moonshot project [106]. Molecules that were predicted to bind in one assay, but inactive (i.e., affinity lower than the assay limit) in the other are shown in blue. The RMSE agreement between the methods, for both purple and blue data points is 0.64 kcal mol−1. Data was collected from the PostEra website accessed 22/11/2020 [107]. The grey region indicates an assay variability of 0.64 kcal mol−1.
Figure 7.
Figure 7.. The larger the experimental uncertainty, the larger the affinity range required for a given Rmax2.
Corresponding to Equation 4, the maximum achievable R2 for a given dataset is limited by the range of affinities and the associated experimental uncertainty. The illustration assumes that σ(measurement error) and σ(affinity) are in the same units, with an experimental error of 0.64 kcal mol−1 indicated.
Figure 8.
Figure 8.. The larger the dataset, the smaller the uncertainty in the performance statistics.
(A) Kendall τ and (B) RMSE were evaluated for 1,000 toy datasets for a given size of the dataset N. The experimental data were simulated from a uniform distribution over the interval [−12:−5] and the predicted affinities were simulated from the experimental toy data using a Gaussian distribution with different standard deviation σ. The statistic was evaluated for the whole dataset and 95% confidence intervals were estimated via bootstrapping. These were then averaged over all 1,000 toy datasets. In (C-E) we illustrate a specific case, where two sampled sets of size N =10 were chosen for a closer inspection. (C) Their RMSE values have overlapping confidence intervals. (D) However, when investigating the underlying sets of points in a pair-wise manner, it appears that one case mostly yields values closer to experimental reference than the other. (E) Bootstrap analysis of these dependent samples reveals that the RMSE difference in this case is statistically significant at the confidence level of α=0.05.
Figure 9.
Figure 9.. Outline of the system preparation steps.
First the protein is prepared (left, Section 5.1.1) by modelling missing atoms, assigning bond orders, protonation and tautomeric states. Similarily, the chemical structure of the ligands is translated into a simulation model (right, Section 5.1.2). The ligands are simulated in two different environments, once complexed with the protein (bottom left) and once in solvent (bottom right). For the solvated complex, the ligand structures need to be docked into the binding site of the protein, typically by using the information of a reference ligand in the X-ray structure.
Figure 10.
Figure 10.. There are four simulations protocols available for for generating samples and evaluating the Hamiltonian at the λ states.
(A) Independent replicas run in parallel at different λs as indicated by differently colored arrows, (B) Replica exchange attempts after short simulation for each replica (C) Self-adjusted mixture sampling with a single replica exploring all of λ, (D) Non-equilibrium methods with equilibrium end-state simulation and frequent nonequilibrium switching between end states. The clock icon is indicating the flow of simulation time and the pair of dice indicate a Metropolis Hastings based trial move
Figure 11.
Figure 11.. Typically either star shaped perturbation maps or multi-connected perturbation maps are used in relative free energy calculations.
(A) The star map will have a central ligand, of which the crystal structure is known and all other ligands distributed in a star. (B) A multi-connected map introduces redundancies into the network, allows for larger perturbations through multiple connections and allows assessment of robustness of calculations. The diamond and green shading indicates the crystal structure.
Figure 12.
Figure 12.. Changes to the plotting style can change the appearance of the data.
The above three figures illustrate the same toy data. (A) shows the data correctly, with the same units (which are labelled) and scales on both axes. (B) shows the same data, however the limits on the y-axis have been changed such that the scales is not consistent. (C) is also not consistent, but this is due to the scale of the plot, rather than the limits.
Figure 13.
Figure 13.. Using correlation statistics with relative free energy results are unreliable.
(A) The original set of N datapoints of relative free energy results yields specific statistics for R2, Kendall τ and ρ. However, there are 2N−1 possible permutations in the sign for the datapoints, where the changes in sign result in a range of possible statistics from the same underlying data. (B) The distribution of possible values (210–1 = 512) for R2, Kendall τ and ρ are illustrated in the violin plot. In the following plots ((C)-(H)), the order of permutations are illustrated that result in the lowest (red: (C), (E) and (G)) and highest (green: plots (D), (F) and (H)) correlation statistic. The considered statistics are R2 ((C) and (D)), Kendall τ ((E) and (F)) and ρ ((G) and (H)). This illustrates how better correlation statistics for the same relative free energy results can be achieved by simply using different definitions of relative ‘directions’ for various edges. For this reason, best practise is to avoid reporting correlation statistics for the reporting of relative free energy calculations, and using accuracy statistics such as RMSE and MUE instead.

References

    1. Mobley DL, Gilson MK. Predicting Binding Free Energies: Frontiers and Benchmarks. Annual Review of Biophysics. 2017; 46(1):531–558. 10.1146/annurev-biophys-070816-033654. - DOI - PMC - PubMed
    1. van Gunsteren WF, Daura X, Hansen N, Mark AE, Oostenbrink C, Riniker S, Smith LJ. Validation of Molecular Simulation: An Overview of Issues. Angewandte Chemie International Edition. 2018; 57(4):884–902. 10.1002/anie.201702945. - DOI - PubMed
    1. Tsai HC, Tao Y, Lee TS, Merz KM, York DM. Validation of Free Energy Methods in AMBER. Journal of Chemical Information and Modeling. 2020; 60(11):5296–5300. 10.1021/acs.jcim.0c00285. - DOI - PMC - PubMed
    1. Abel R, Wang L, Mobley DL, Friesner RA. A Critical Review of Validation, Blind Testing, and Real-World Use of Alchemical Protein-Ligand Binding Free Energy Calculations. Current Topics in Medicinal Chemistry. 2017; 17(23):2577–2585. 10.2174/1568026617666170414142131. - DOI - PubMed
    1. Abel R, Manas ES, Friesner RA, Farid RS, Wang L. Modeling the Value of Predictive Affinity Scoring in Preclinical Drug Discovery. Current Opinion in Structural Biology. 2018; 52:103–110. 10.1016/j.sbi.2018.09.002. - DOI - PubMed