

Endothelial transmigration hotspots limit vascular leakage through heterogeneous expression of ICAM-1
- PMID: 36382783
- PMCID: PMC9827561
- DOI: 10.15252/embr.202255483
Endothelial transmigration hotspots limit vascular leakage through heterogeneous expression of ICAM-1
Abstract
Upon inflammation, leukocytes leave the circulation by crossing the endothelial monolayer at specific transmigration "hotspot" regions. Although these regions support leukocyte transmigration, their functionality is not clear. We found that endothelial hotspots function to limit vascular leakage during transmigration events. Using the photoconvertible probe mEos4b, we traced back and identified original endothelial transmigration hotspots. Using this method, we show that the heterogeneous distribution of ICAM-1 determines the location of the transmigration hotspot. Interestingly, the loss of ICAM-1 heterogeneity either by CRISPR/Cas9-induced knockout of ICAM-1 or equalizing the distribution of ICAM-1 in all endothelial cells results in the loss of TEM hotspots but not necessarily in reduced TEM events. Functionally, the loss of endothelial hotspots results in increased vascular leakage during TEM. Mechanistically, we demonstrate that the 3 extracellular Ig-like domains of ICAM-1 are crucial for hotspot recognition. However, the intracellular tail of ICAM-1 and the 4th Ig-like dimerization domain are not involved, indicating that intracellular signaling or ICAM-1 dimerization is not required for hotspot recognition. Together, we discovered that hotspots function to limit vascular leakage during inflammation-induced extravasation.
Keywords: ICAM-1; inflammation; leakage; transendothelial migration hotspots.
© 2022 The Authors. Published under the terms of the CC BY 4.0 license.
Figures
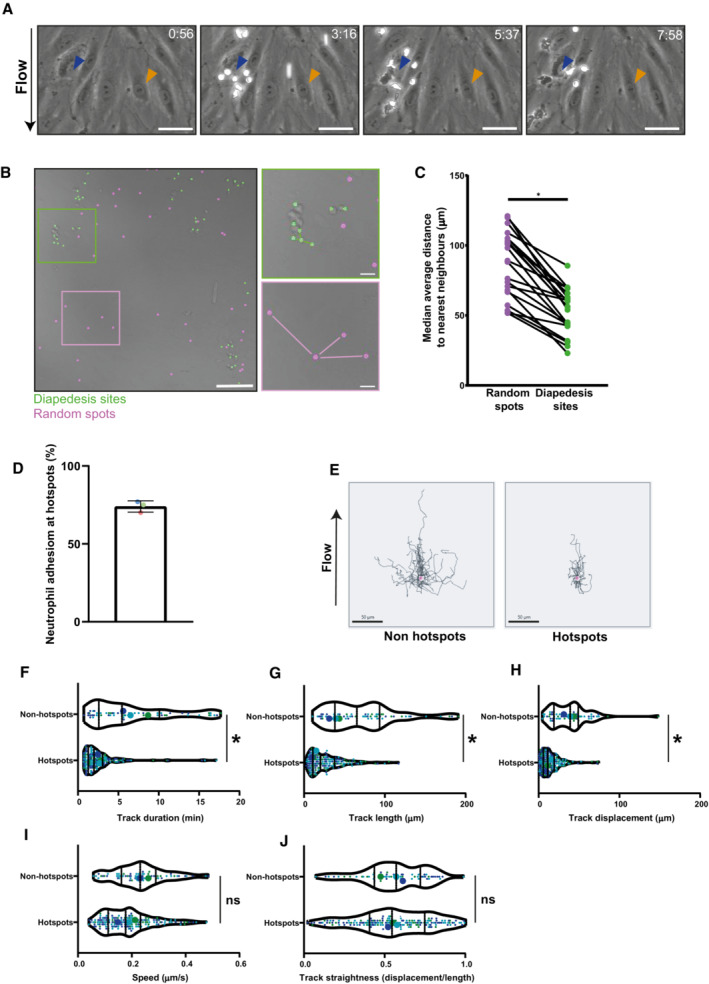
- A
Stills from a timelapse TEM assay under physiological flow with overnight TNFα‐treated HUVECs, showing a neutrophil TEM hotspot indicated with a blue arrow and a region largely ignored by neutrophils indicated with an orange arrow. The direction of flow is from top to bottom, time is indicated in minutes at the top right. Scale bar, 50 μm.
- B
Brightfield still image from a neutrophil TEM experiment under physiological flow with TNFα‐treated HUVECs, with marked the diapedesis sites (green) and computationally generated random spots (magenta). Scale bar, 100 μm and 20 μm in zoomed images.
- C
Medians of average distance to 3 nearest neighbors for each time lapse are plotted. Medians are paired with medians of average distance to 3 nearest neighbors of corresponding randomly generated spots. Paired t‐test (n = 21): *P < 0.0001. Each datapoint corresponds to 1 of 21 time lapses from 3 biological replicates.
- D
Bar graph of total percentage of neutrophils utilizing hotspots (≥2 diapedesis events). Means from 3 biological replicates are shown. Bar graph shows mean with SD.
- E
40 overlayed tracks of crawling neutrophils that eventually transmigrate at a TEM hotspot (right, ≥2 diapedesis events) or not (left, 1 diapedesis event). Scale bar, 50 μm.
- F–J
Small dots represent individual datapoints, large dots are medians of each biological replicate. The lines in the violin plot display the quartiles and median of all datapoints. 174 hotspot tracks and 62 nonhotspot tracks from 3 biological replicates are represented in 3 different colors. Paired t‐test on medians (n = 3) of three biological replicates. (F) Violin plot of track duration of crawling neutrophils that eventually transmigrate at a TEM hotspot or not. *P = 0.0121. (G) Violin plot of total track length of crawling neutrophils that eventually transmigrate at a hotspot or not. *P = 0.039. (H) Violin plot of the total displacement (distance between the beginning and the end of the track) of crawling neutrophils that eventually transmigrate at a TEM hotspot or not. *P = 0.019. (I) Violin plot of average speed of crawling neutrophils that eventually transmigrate at a TEM hotspot or not. P = 0.051. (J) Violin plot of Track straightness (displacement from (F)/length from (E)) of crawling neutrophils that eventually transmigrate at a TEM hotspot or not. P = 0.95.
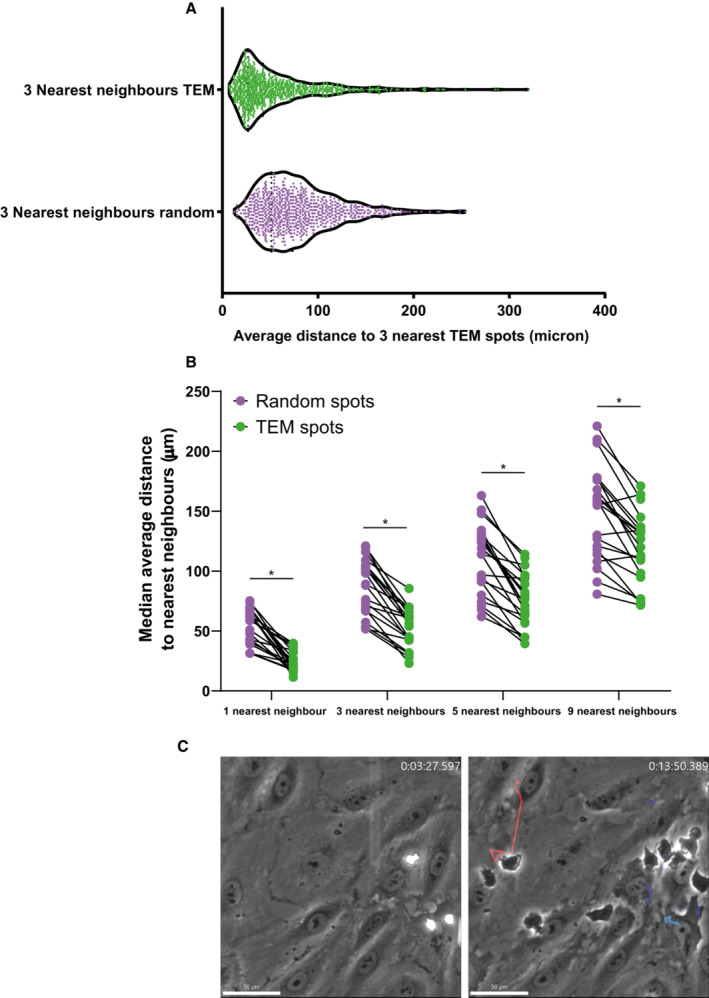
Violin plot of average distance to 3 nearest neighbors for actual diapedesis sites and randomly generated spots. Each datapoint corresponds to 1 diapedesis site and 729 datapoints from 21 time lapses are plotted from 3 biological replicates.
Comparison of analysis methods for nearest neighbor calculations. 1, 3, 5, and 9 nearest neighbor(s) for each TEM spot were calculated and compared with randomly generated spots. Data is from 21 videos from 3 biological replicates. Paired t‐test (n = 21) for every comparison: *P < 0.0001 for all.
Stills from a DIC timelapse TEM assay, showing neutrophils and their complete crawling tracks at hotspots, indicated with blue tracks, and non‐hotspots, indicated with a red track. The direction of flow is from top to bottom, time is indicated in min:sec at the top right. Scale bar, 50 μm.
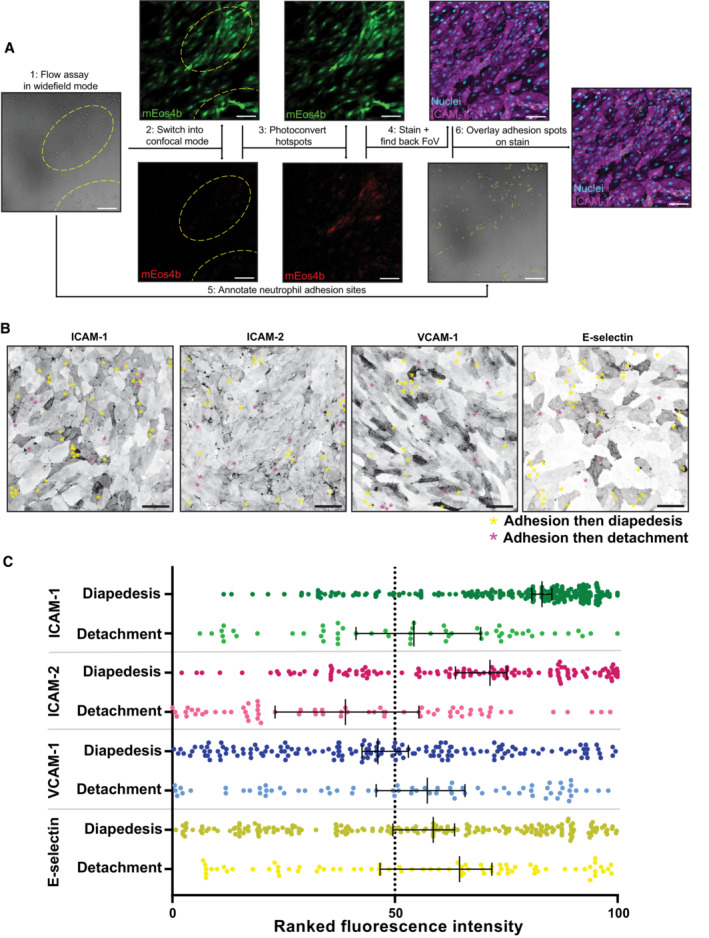
Simplified workflow for photoconversion experiments. (1) Neutrophil flow assays were performed in widefield mode with overnight TNFα‐treated HUVECs expressing mEos4b. (2) The same field of views were imaged in confocal mode. (3) Areas where hotspots had appeared in the widefield video were converted from green to red using a 405 nm laser. (4) The slides were fixed and the nuclei and an adhesion molecule were stained. The original fields of view were found backing by looking for red signal. (5) In the original video, all successful and unsuccessful adhesion events were annotated. (6) The adhesion spots were overlayed with the stained image. Scale bar, 100 μm.
Inverted greyscale LUT of immunofluorescence stains on overnight TNFα‐treated HUVECs for ICAM‐1, ICAM‐2, VCAM‐1, and E‐selectin of areas of which time lapses were made, relocated by photoconversion of mEos4b. With yellow asterisks, adhesion events that led to diapedesis are shown. With magenta asterisks, adhesion events that were followed by detachment are shown. Scale bar, 100 μm.
Quantification of adhesion events on overnight TNFα‐treated HUVEC cells ranked by their preference for diapedesis for expression levels of ICAM‐1 (green dots, 254 diapedesis adhesion events and 57 detachment adhesion events), ICAM‐2 (magenta dots 129 diapedesis adhesion events and 79 detachment adhesion events) VCAM‐1 (blue dots 163 diapedesis adhesion events and 72 detachment adhesion events) and E‐selectin (dark yellow dots = 199 diapedesis adhesion events and 78 detachment adhesion events). Data shown are from 9 (ICAM‐1 and VCAM‐1) or 6 (ICAM‐2 and E‐selectin) images from 3 biological replicates. Median with 95% CI is shown.
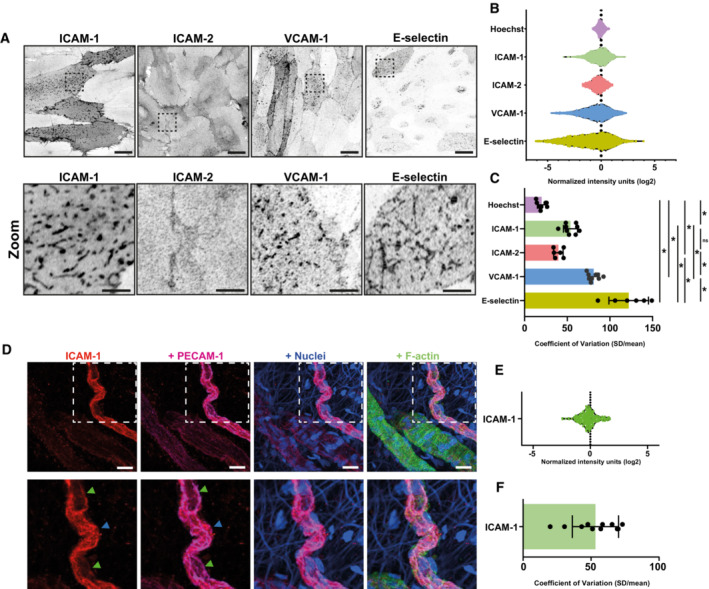
Inverted greyscale LUT of IF staining for ICAM‐1, ICAM‐2, VCAM‐1, and E‐selectin on HUVECs after overnight TNFα stimulation. ROIs represent zoom regions shown below. Scale bar, 20 μm in upper panels, 5 μm in bottom panels.
Violin plots showing Log2‐normalized heterogeneous expression levels of Hoechst (9 images, 1,583 cells), ICAM‐1 (9 images, 1,778 cells), ICAM‐2 (6 images, 1,097 cells), VCAM‐1 (9 images, 2,306 cells) and E‐selectin (6 images, 897 cells). Each dot represents an individual cell, and data are shown from 3 biological replicates. Data are normalized to mean intensity within an image to normalize for differences between each image. The dotted vertical line represents mean intensity.
Bar graphs of the calculated coefficient of variation (CoV; standard deviation/mean) for each field of view imaged in Fig 2B. Data are shown from 3 biological replicates. Bar graphs show mean with SD. One‐way ANOVA (n = 9 for Hoechst, ICAM‐1, and VCAM‐1, n = 6 for ICAM‐2 and E‐selectin) with multiple comparison correction was performed. Hoechst vs ICAM‐2: *P = 0.0175. ICAM‐1 vs ICAM‐2: *P = 0.1214. All other combinations: *P < 0.0001.
Ex vivo whole‐mount stains of colonic mesenterial adipose tissue of a patient with active inflammatory bowel disease, with ICAM‐1 low (green arrow) and ICAM‐1 high (blue) cells indicated. ICAM‐1 is shown in red, PECAM‐1 in magenta, nuclei in blue, and F‐actin in green. Scale bar, 20 μm.
Violin plots showing Log2‐normalized heterogeneous expression levels of ICAM‐1 (11 images, 233 cells). Each dot represents an individual cell, and data are shown from 3 biological replicates. Data are normalized to mean intensity within an image to normalize for differences between each image. The dotted vertical line represents mean intensity.
Bar graph of the calculated coefficient of variation (CoV; standard deviation/mean) for each field of view imaged in Fig 2E. Data are shown from 3 biological replicates. Bar graph shows mean with SD.
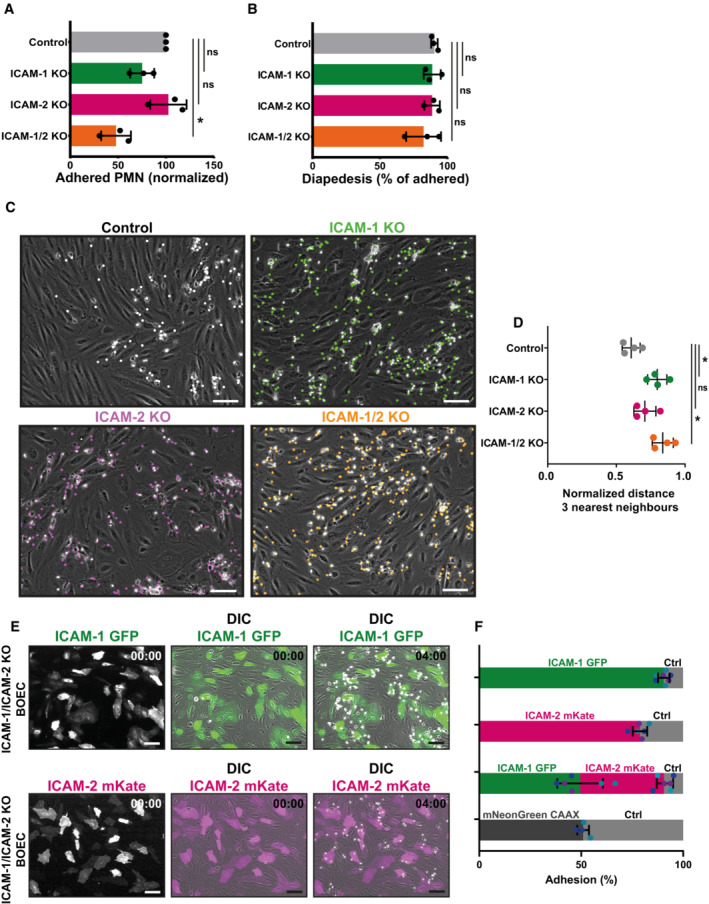
Quantification of number of adhered neutrophils (PMN) in TEM under flow assay using control BOECs (no gRNA), ICAM‐1 KO BOECs, ICAM‐2 KO BOECs, and double ICAM‐1/2 KO BOECs. Data are normalized to control conditions (100%). Data consists of 3 biological replicates, 27,141 total neutrophils measured. Bar graph displays mean with SD. One‐way paired ANOVA (n = 3) with multiple comparison correction, comparing all conditions with control. Control vs ICAM‐1 KO: P = 0.6139. Control vs ICAM‐2 KO: P = 0.9725. Control vs ICAM‐1/2 KO: *P = 0.0296.
Quantification of diapedesis efficacy (total transmigrated / total neutrophils detected *100%) of neutrophils through control, ICAM‐1 KO, ICAM‐2 KO, and ICAM‐1/2 KO BOECs. Data consists of 3 biological replicates, 27,141 total neutrophils measured. Bar graph displays mean with SD. One‐way paired ANOVA (n = 3) with multiple comparison correction, comparing all conditions with control. Control vs ICAM‐1 KO: P = 0.9679 Control vs ICAM‐2 KO: P = 0.9991. Control vs ICAM‐1/2 KO: P = 0.2281.
Stills from neutrophil flow time lapses over control, ICAM‐1 KO, ICAM‐2 KO, and ICAM‐1/2 KO BOECs. All neutrophil TEM spots that occurred in the time lapse are shown in gray (control), green (ICAM‐1 KO), magenta (ICAM‐2 KO), and ICAM‐1/2 KO (orange). Scale bar, 100 μm.
Medians of average distance of adhesion sites or TEM sites to 3 nearest neighbors, normalized against medians of the average distance to three nearest neighbors of the corresponding randomly generated spots. Data from 4 biological replicates are shown. One‐way paired ANOVA (n = 4) with multiple comparison correction, comparing all conditions with control. Control vs ICAM‐1: *P = 0.0150. Control vs ICAM‐2: P = 0.2077. Control vs ICAM‐1/2 KO: *P = 0.0049.
Timelapse imaging of TEM under flow with ICAM‐1/ICAM‐2 KO cells. Part of EC monolayer is rescued with ICAM‐1‐GFP (green) or ICAM‐2‐mKate (magenta). Time indicated in the upper right corner in minutes. Left panels show ICAM‐1‐ or ICAM‐2‐only channel, middle, and right channels are merged with DIC. White dots are adhering neutrophils. Scale bar, 100 μm.
Quantification of the preference for neutrophils to adhere to ICAM‐1‐GFP (green), ICAM‐2‐mKate (magenta), or CAAX‐mNeonGreen (dark gray) expressed in ICAM‐1/ICAM‐2 KO ECs or ICAM‐1/ICAM‐2 KO ECs (Ctrl; light gray). Bars represent percentage of neutrophil that adheres to indicated cell type. Numbers are corrected for the area occupied. Dots are percentages from individual timelapse images, colors represent data from 3 biological replicates. Bars represent mean with standard deviation.
- A, B
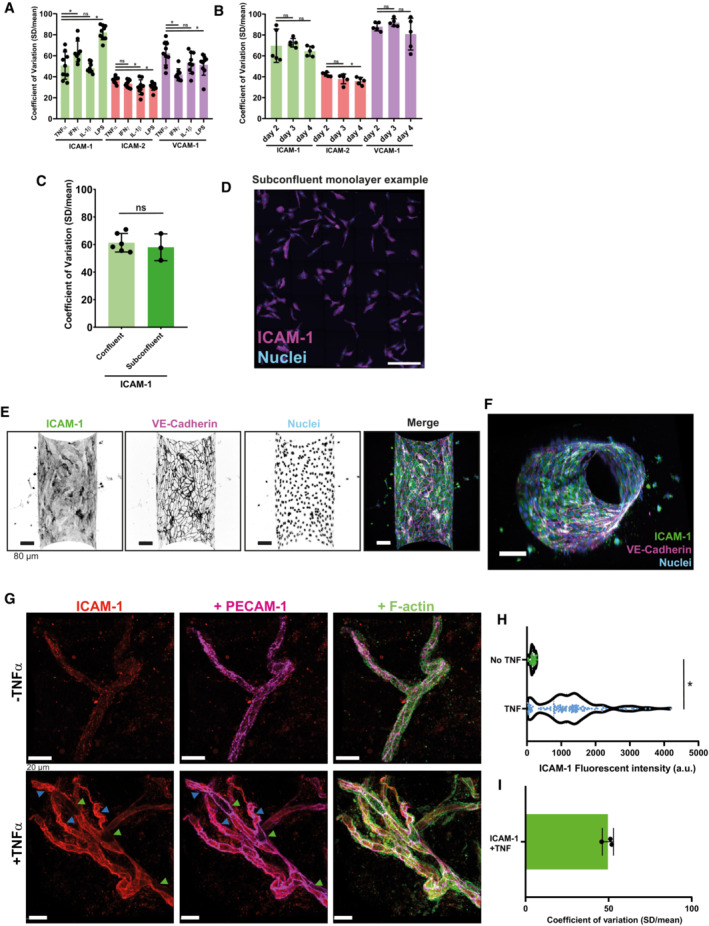
Bar graphs displaying coefficient of variations (CoV) of ICAM‐1, ICAM‐2, and VCAM‐1 for each field of view measured. Data are shown from 3 biological replicates. Bars show mean with SD. (A) Different inflammatory stimulants, all overnight incubated. One‐way ANOVA on means with multiple comparison correction against TNFα data, separate test for each protein (n = 9 images per condition). ICAM‐1 (TNFα vs IFN‐γ: *P = 0.0102. TNFα vs IL‐1β: P = 0.9171. TNFα vs LPS: *P < 0.0001). ICAM‐2 (TNFα vs IFN‐γ: P = 0.2900. TNFα vs IL‐1β: *P = 0.0107. TNFα vs LPS: *P = 0.0224). VCAM‐1 (TNFα vs IFN‐γ: *P = 0.0002. TNFα vs IL‐1β: P = 0.1192. TNFα vs LPS: *P = 0.0499). (B) Different maturation states of the endothelial monolayer were treated overnight with TNFα. One‐way ANOVA on means with multiple comparison correction against day 2 data, separate test for each protein (n = 5). ICAM‐1 (day 2 vs day 3: P = 0.8627. day 2 vs day 4: P = 0.6332.) ICAM‐2 (day 2 vs day 3: P = 0.1338. day 2 vs day 4: *P = 0.0262.) VCAM‐1 (day 2 vs day 3: P = 0.7364. day 2 vs day 4: P = 0.4043).
- C
Bar graphs displaying coefficient of variation (CoV) of ICAM‐1 expression in confluent HUVECs (6 images) versus subconfluent HUVECs (3 5 × 5 tile scans), treated overnight with TNFα, for each field of view measured. Confluent monolayer Mann–Whitney test (n = 6 for confluent and n = 3 for subconfluent): P = 0.5476. Data are shown from 3 biological replicates. Bars show mean with SD.
- D
Example of a 5 × 5 tile scan with subconfluent HUVECs, treated overnight with TNFα. ICAM‐1 is shown in magenta and nuclei are shown in blue. Scale bar, 300 μm.
- E
Inverted greyscale LUT of IF stain for ICAM‐1, VE‐cadherin, and nuclei of a TNFα‐treated vessel‐on‐a‐chip composing of HUVECs. Scale bar, 80 μm. Only the bottom half of the Z‐stack is shown.
- F
Side view of whole vessel‐on‐a‐chip, shown in Fig EV2D. Stained for ICAM‐1 (green), VE‐cadherin (magenta), and nuclei (blue). Scale bar, 20 μm.
- G
Ex vivo whole‐mount stains of healthy mesenterial adipose tissue of a carcinoma patient, incubated without or with TNFα for 4 h. ICAM‐1 low (green arrow) and ICAM‐1 high (blue) cells indicated. ICAM‐1 is shown in red, PECAM‐1 in magenta, and F‐actin in green. Scale bar, 20 μm.
- H
Violin plot showing the fluorescent intensity of ICAM‐1 in ex vivo whole‐mount stains of healthy mesenterial adipose tissue of a carcinoma patient, incubated without or with TNFα for 4 h. Each datapoint corresponds to 1 EC and 32 (no TNFα) and 123 (with TNFα) datapoints are plotted from 3 biological replicates. Mann–Whitney test (n = 32 for no TNFα and n = 123 for with TNFα): *P < 0.0001.
- I
Bar graph of the calculated coefficient of variation (CoV; standard deviation/mean) for each field of view image in Fig EV2H. Data are shown from 3 biological replicates. Bar graph shows mean with SD.
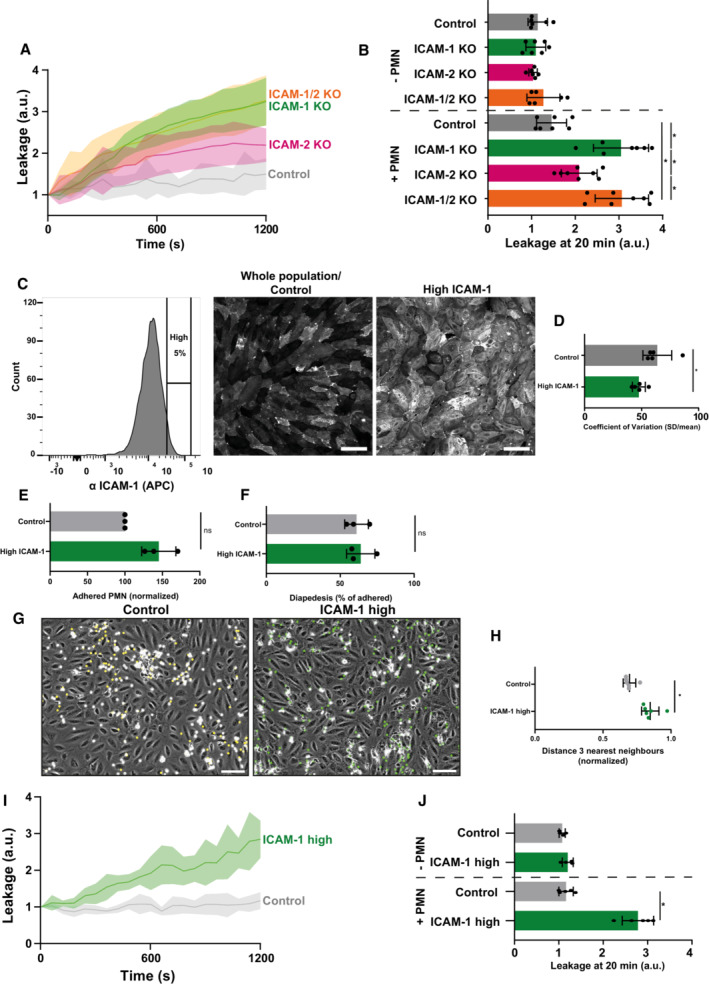
Texas‐Red‐dextran extravasation kinetics through control (gray), ICAM‐1 KO (green), ICAM‐2 KO (magenta), and ICAM‐1/2 KO (orange) BOECs, treated overnight with TNFα, cultured on 3‐μm pore permeable filters. DiO‐stained neutrophils transmigrated towards C5a located in the lower compartment. Lines show means with 95% CIs of a total of 6 to 8 wells from 3 biological replicates.
Quantification of Texas‐Red‐dextran extravasation kinetics through control, ICAM‐1 KO, ICAM‐2 KO, and ICAM‐1/2 KO BOECs after 20 min. Bar graphs represent mean and SD. One‐way ANOVA (n = 3) with multiple comparison corrections was performed within both the conditions without and with neutrophils. Without neutrophils (Control vs ICAM‐1 KO: P = 0.9893, Control vs ICAM‐2 KO: P = 0.8830, Control vs ICAM‐1/2 KO: P = 0.7988, ICAM‐1 KO vs ICAM‐2 KO: P = 0.9689, ICAM‐1 KO vs ICAM‐1/2 KO: P = 0.5993, ICAM‐2 KO vs ICAM‐1/2 KO: P = 0.3768). With neutrophils (Control vs ICAM‐1 KO: *P < 0.0001, Control vs ICAM‐2 KO: P = 0.1082, Control vs ICAM‐1/2 KO: *P < 0.0001, ICAM‐1 KO vs ICAM‐2 KO: *P = 0.0068, ICAM‐1 KO vs ICAM‐1/2 KO: P = 0.9999, ICAM‐2 KO vs ICAM‐1/2 KO: *P = 0.0042).
FACS graph displaying the top 5% sorted cells with the highest ICAM‐1 expression levels based on fluorescence intensity. These cells are now called ICAM‐1 high. Example images of reseeded whole population/control HUVECs and ICAM‐1 high HUVECs are shown and stained for ICAM‐1. Scale bar, 100 μm.
Bar graphs of the calculated coefficient of variation (CoV; standard deviation/mean) for control HUVECs (5 images) versus ICAM‐1 high sorted HUVECs (5 images), treated overnight with TNFα. Data are shown from 5 technical replicates. Bar graphs show mean with SD. Mann–Whitney (n = 5): *P = 0.0159.
Quantification of number of adhered neutrophils (PMN) in TEM under flow assay using control HUVECs and ICAM‐1 high HUVECs. Data are normalized to control conditions (100%). Data consists of 3 biological replicates, 25,646 total neutrophils measured. Bar graph displays mean with SD. Paired t‐test (n = 3): P = 0.0754.
Quantification of transmigration efficacy of neutrophils (PMN; total transmigrated / total neutrophils detected *100%) through control HUVECs and ICAM‐1 high HUVECs. Data are normalized to control conditions (100%). Data consist of 3 biological replicates, 25,646 total neutrophils measured. Bar graph displays mean with SD. Paired t‐test (n = 3): P = 0.7923.
Stills from neutrophil flow time lapses over control, and ICAM‐1 high HUVECs, treated overnight with TNFα. All neutrophil TEM spots that occurred in the time lapse are shown in yellow (control) and green (ICAM‐1 high). Scale bar, 100 μm.
Medians of average distance of adhesion sites or TEM sites to 3 nearest neighbors, normalized against medians of the average distance to the three nearest neighbors of the corresponding randomly generated spots. Data of 6 videos from 3 biological replicates are shown. Mann–Whitney test (n = 6): *P = 0.0022.
Texas‐Red‐dextran extravasation kinetics through control (gray) and ICAM‐1 high sorted (green) HUVECs, treated overnight with TNFα, cultured on 3‐μm pore permeable filters DiO‐stained neutrophils transmigrated towards C5a located in the lower compartment. Lines show means with 95% CIs of a total of 4 (without PMNs) and 8 (with PMNs) wells from 4 biological replicates.
Quantification of Texas‐Red‐dextran extravasation kinetics through control and ICAM‐1 high sorted HUVECs at 20 min. Bar graph displays mean with SD. Paired t‐test (n = 4 without neutrophils, n = 8 with neutrophils) was performed within conditions without and with neutrophils. Without neutrophils (Control vs ICAM‐1 high: P = 0.1271). With neutrophils (Control vs ICAM‐1 high: *P < 0.0001).
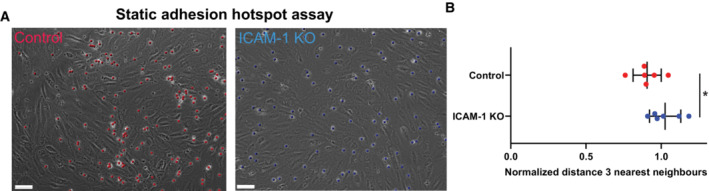
DIC images of Control and ICAM‐1 KO BOECs, treated overnight with TNFα and treated 5 min with neutrophils to allow firm adhesion. Red dots show location of adhered neutrophils on control BOECs, and blue dots show location of adhered neutrophils on ICAM‐1 KO BOECs. Scale bar, 70 μm.
Medians of average distance of adhesion sites or TEM sites to 3 nearest neighbors, normalized against medians of the average distance to three nearest neighbors of the corresponding randomly generated spots. Data from 6 biological replicates are shown. Mann–Whitney: *P = 0.0411.
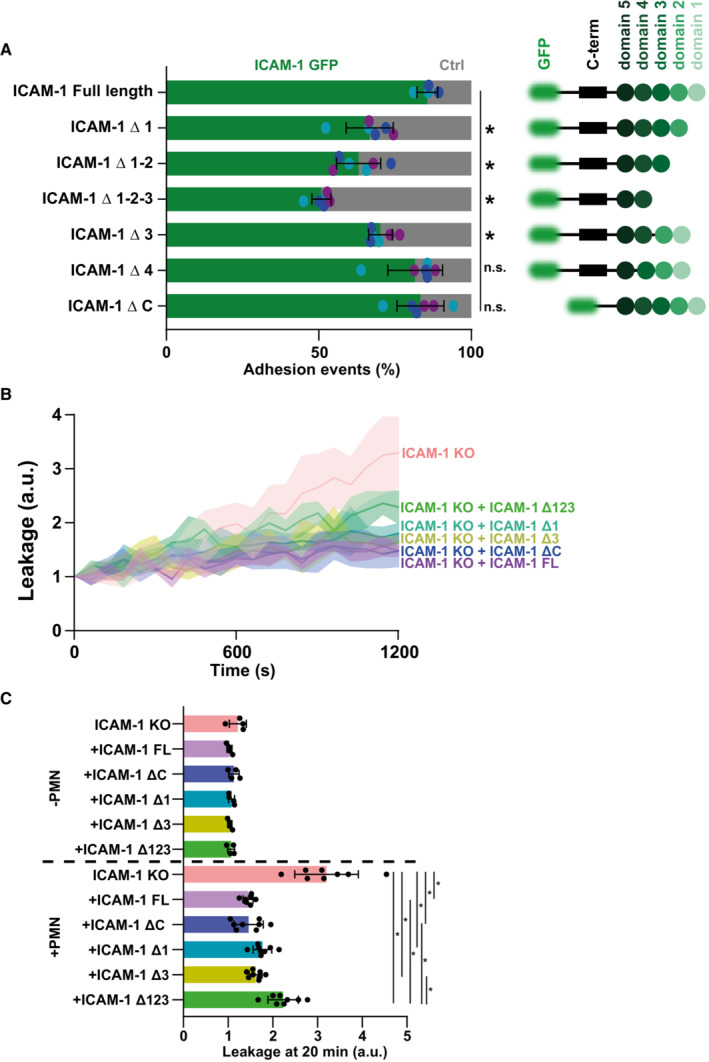
Quantification of preference for neutrophils to adhere to ICAM‐1‐GFP truncations (green) expressed in ICAM‐1/2 KO BOECs or ICAM‐1/2 KO BOECs (Ctrl; light gray), treated overnight with TNFα. A schematic overview of all cloned ICAM‐1 truncations is displayed as well. Bars represent the percentage of neutrophils that adhere to indicated transfected ECs. Numbers are corrected for area occupied. Dots are percentages from individual timelapse images. Bars represent mean with standard deviation. Colors represent data from 6 videos from 3 biological replicates (2 videos from 2 biological replicates for the control). One‐way ANOVA (n = 4 for FL ICAM‐1, n = 6 for all others). With multiple comparison corrections, comparing all conditions to FL ICAM‐1. FL vs Δ 1: *P = 0.0004. FL vs Δ 12: *P < 0.0001. FL vs Δ 123: *P < 0.0001. FL vs Δ 3: *P < 0.0029. FL vs Δ 4: P = 0.5848. FL vs Δ C: P = 0.6014.
Texas‐Red‐Dextran extravasation kinetics through ICAM‐1/2 KO (pink) BOECs, treated overnight with TNFα, with mosaicly expressed ICAM‐1‐GFP (purple), ICAM‐1‐GFP Δ123 (green), ICAM‐1‐GFP Δ1 (cyan), ICAM‐1‐GFP Δ3 (yellow) and ICAM‐1‐GFP ΔC (blue), cultured on 3‐μm pore filters. DiO‐stained neutrophils transmigrated towards C5a located in the lower compartment. Lines show means with 95% CIs of a total of 4 (without neutrophils) or 8 (with neutrophils) wells from 4 biological replicates.
Quantification of Texas‐Red‐dextran extravasation kinetics through ICAM‐1/2 KO BOECs, treated overnight with TNFα, with mosaicly expressed ICAM‐1‐GFP, ICAM‐1‐GFP Δ123, ICAM‐1‐GFP Δ1, ICAM‐1‐GFP Δ3 and ICAM‐1‐GFP ΔC, after 20 min. Bar graphs represent mean and SD. One‐way ANOVA (n = 4 without PMNs, n = 8 with PMNs) with multiple comparison corrections was performed within both the conditions without and with neutrophils. Without neutrophils (ICAM‐1 KO vs FL: P = 0.1864, ICAM‐1 KO vs ΔC: P = 0.8335, ICAM‐1 KO vs Δ123: P = 0.3649, ICAM‐1 KO vs Δ1: P = 0.4300, ICAM‐1 KO vs Δ3: P = 0.2031, FL vs ΔC: P = 0.7616, FL vs Δ123: P = 0.9953, FL vs Δ1: P = 0.9975, FL vs Δ3: P > 0.9999, ΔC vs Δ123: P = 0.9570, ΔC vs Δ1: P = 0.9782, ΔC vs Δ3: P = 0.8222, Δ123 vs Δ1: P > 0.9999, Δ123 vs Δ3: P = 0.9987, Δ1 vs Δ3: P = 0.9952). With neutrophils (ICAM‐1 KO vs FL: *P < 0.0001, ICAM‐1 KO vs ΔC: *P < 0.0001, ICAM‐1 KO vs Δ123: *P < 0.0001, ICAM‐1 KO vs Δ1: *P < 0.0001, ICAM‐1 KO vs Δ3: *P < 0.0001, FL vs ΔC: P > 0.9999, FL vs Δ123: *P = 0.0014, FL vs Δ1: P = 0.5035, FL vs Δ3: P = 0.9375, ΔC vs Δ123: *P = 0.0017, ΔC vs Δ1: P = 0.5433, ΔC vs Δ3: P = 0.9532, Δ123 vs Δ1: P = 0.1420, Δ123 vs Δ3: P = 0.0199, Δ1 vs Δ3: P = 0.9600).
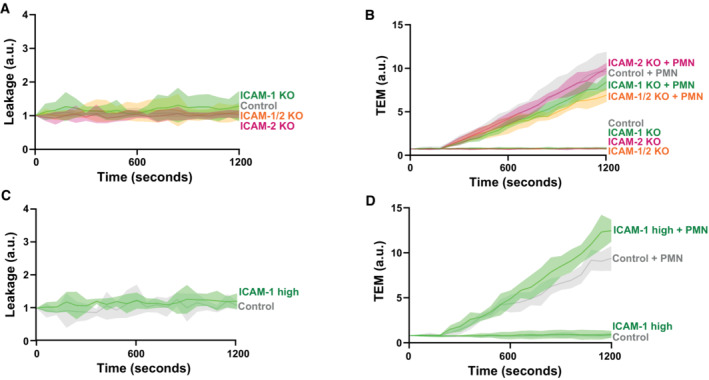
Basal leakage measured with Texas‐Red‐dextran extravasation kinetics through control (gray), ICAM‐1 KO (green), ICAM‐2 KO (magenta), and ICAM‐1/2 KO (orange) BOECs, treated overnight with TNFα. Lines show means with 95% CIs of a total of 6 to 8 wells from 3 biological replicates.
Neutrophil extravasation kinetics through control (gray), ICAM‐1 KO (green), ICAM‐2 KO (magenta), and ICAM‐1/2 KO (orange) BOECs cultured on 3‐μm pore permeable filters. DiO‐stained neutrophils transmigrated towards C5a located in the lower compartment. Lines show means with 95% Cis of a total of 6 to 8 wells from 3 biological replicates.
Basal leakage measured with Texas‐Red‐dextran extravasation kinetics through control (gray) and ICAM‐1 high sorted (green) HUVECs BOECs. Lines show means with 95% Cis of 3 wells from 3 biological replicates.
Neutrophil extravasation kinetics through control (gray) and ICAM‐1 high sorted (green) HUVECs cultured on 3‐μm pore permeable filters. DiO‐stained neutrophils transmigrated towards C5a located in the lower compartment. Lines show means with 95% CIs of 3 wells from 3 biological replicates.
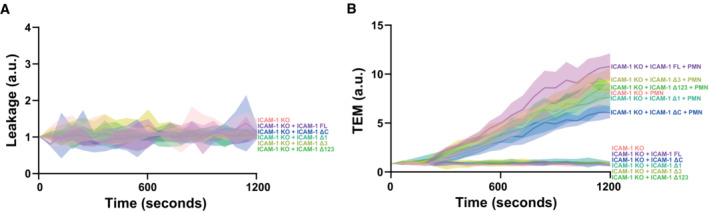
Basal leakage measured with Texas‐Red‐dextran extravasation kinetics through ICAM‐1 KO (pink) BOECs, treated overnight with TNFα, with mosaicly expressed ICAM‐1‐GFP (purple), ICAM‐1‐GFP Δ123 (green), ICAM‐1‐GFP Δ1 (cyan), ICAM‐1‐GFP Δ3 (yellow) and ICAM‐1‐GFP ΔC (blue). Lines show means with 95% CIs of 4 wells from 3 biological replicates.
Neutrophil extravasation kinetics through ICAM‐1 KO (pink) BOECs with mosaicly expressed ICAM‐1‐GFP (purple), ICAM‐1‐GFP Δ123 (green), ICAM‐1‐GFP Δ1 (cyan), ICAM‐1‐GFP Δ3 (yellow) and ICAM‐1‐GFP ΔC (blue). cultured on 3‐μm pore permeable filters. DiO‐stained neutrophils transmigrated towards C5a located in the lower compartment. Lines show means with 95% CIs of a total of 4 (without neutrophils) or 8 (with neutrophils) wells from 3 biological replicates.
References
-
- Alon R, van Buul JD (2017) Leukocyte breaching of endothelial barriers: the Actin link. Trends Immunol 38: 606–615 - PubMed
-
- Avellino AM, Dailey AT, Harlan JM, Sharar SR, Winn RK, McNutt LD, Kliot M (2004) Blocking of up‐regulated ICAM‐1 does not prevent macrophage infiltration during Wallerian degeneration of peripheral nerve. Exp Neurol 187: 430–444 - PubMed
Publication types
MeSH terms
Substances
LinkOut - more resources
Full Text Sources
Miscellaneous
