

Regulation of cGAS activity by RNA-modulated phase separation
- PMID: 36382803
- PMCID: PMC9900338
- DOI: 10.15252/embr.202051800
Regulation of cGAS activity by RNA-modulated phase separation
Abstract
Cyclic GMP-AMP synthase (cGAS) is a double-stranded DNA (dsDNA) sensor that functions in the innate immune system. Upon binding dsDNA, cGAS and dsDNA form phase-separated condensates in which cGAS catalyzes the synthesis of 2'3'-cyclic GMP-AMP that subsequently triggers a STING-dependent, type I interferon (IFN-I) response. Here, we show that cytoplasmic RNAs regulate cGAS activity. We discover that RNAs do not activate cGAS but rather promote phase separation of cGAS in vitro. In cells, cGAS colocalizes with RNA and forms complexes with RNA. In the presence of cytoplasmic dsDNA, RNAs colocalize with phase-separated condensates of cGAS and dsDNA. Further in vitro assays showed that RNAs promote the formation of cGAS-containing phase separations and enhance cGAS activity when the dsDNA concentration is low. Cotransfection of RNA with a small amount of dsDNA into THP1 cells significantly enhances the production of the downstream signaling molecule interferon beta (IFNB). This enhancement can be blocked by a cGAS-specific inhibitor. Thus, cytoplasmic RNAs could regulate cGAS activity by modulating the formation of cGAS-containing condensates.
Keywords: RNA; cGAS; innate immunity; phase separation; regulation.
© 2022 The Authors.
Figures
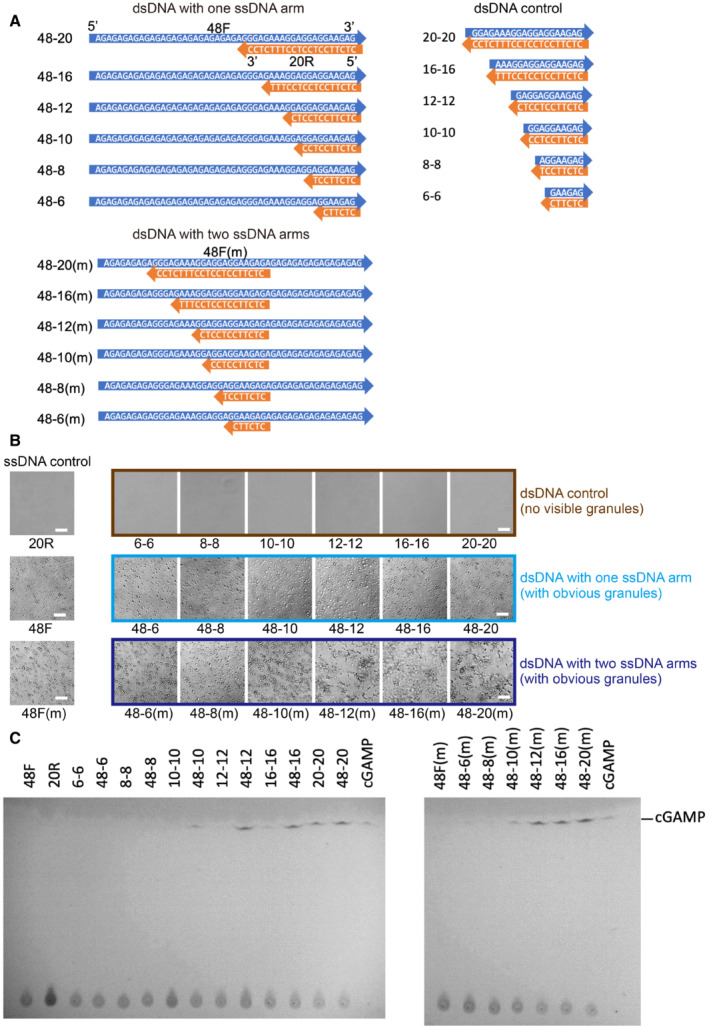
Diagrams showing sequences of short dsDNAs with ssDNA arms and the short dsDNA controls.
Photographs of FL‐hcGAS (0.294 mg/ml, 5.0 μM) mixed with indicated DNAs (2.5 μM) showing phase‐separated droplets or condensates induced by short dsDNAs with ssDNA arms but not the short dsDNA controls (n = 2, biological replicates, data from one representative independent biological replicate are shown). The corresponding concentration in mg/ml were 0.009 for 6–6, 0.012 for 8–8, 0.014 for 10–10, 0.018 for 12–12, 0.024 for 16–16, 0.031 for 20–20, 0.043 for 48–6 and 48‐6(m), 0.044 for 48–8 and 48‐8(m), 0.046 for 48–10 and 48–10(m), 0.047 for 48–12 and 48‐12(m), 0.05 for 48–16 and 48–16(m), 0.053 for 48–20 and 48–20(m), 0.015 for 20R, and 0.038 for 48F and 48F(m). The scale bar represents 20 μm.
TLC analysis for cGAMP, which is indicative of cGAS activation. cGAMP was detected in samples containing short dsDNAs with ssDNA arms but not in samples containing the short dsDNA or ssDNA controls (n = 2, biological replicates, data from one representative independent biological replicate are shown). The FL‐hcGAS and DNA concentrations were (0.294 mg/ml, 5.0 μM) and 2.5 μM, respectively. Samples were prepared in 20 mM HEPES at pH 7.5 and 150 mM NaCl and were incubated at room temperature for 1 h.
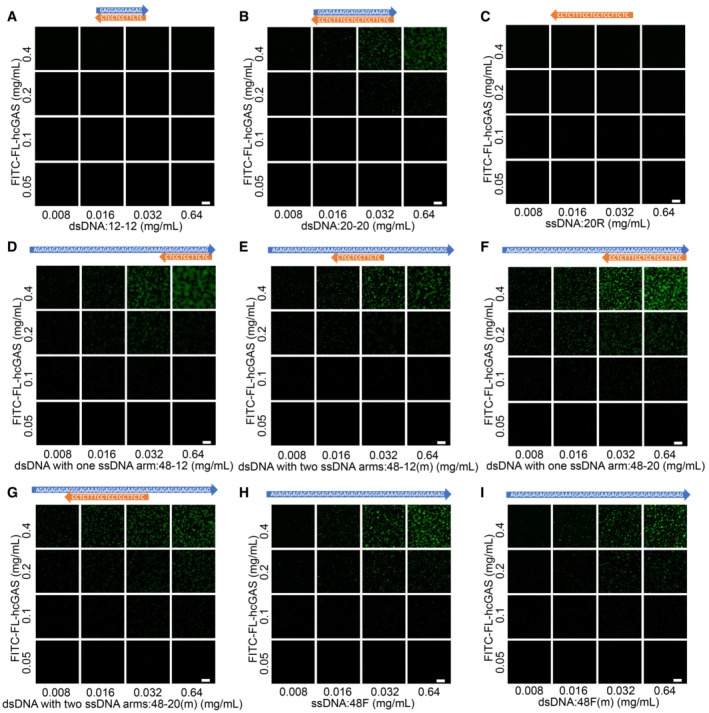
Phase diagram of cGAS and the 12‐bp dsDNA (12–12) as indicated in Fig EV1A. The scale bar represents 20 μm.
Phase diagram of cGAS and the 20‐bp dsDNA (20–20) as indicated in Fig EV1A. The scale bar represents 20 μm.
Phase diagram of cGAS and the 20 nt ssDNA (20R) as indicated in Fig EV1A. The scale bar represents 20 μm.
Phase diagram of cGAS and a 12‐bp dsDNA with one ssDNA arms (48–12) as indicated in Fig EV1A. The scale bar represents 20 μm.
Phase diagram of cGAS and a 12‐bp dsDNA with two ssDNA arms (48–12(m)) as indicated in Fig EV1A. The scale bar represents 20 μm.
Phase diagram of cGAS and a 20‐bp dsDNA with one ssDNA arms (48–20) as indicated in Fig EV1A. The scale bar represents 20 μm.
Phase diagram of cGAS and the 20‐bp dsDNA with two ssDNA arm (48–20(m)) as indicated in Fig EV1A. The scale bar represents 20 μm.
Phase diagram of cGAS and a 48 nt ssDNA (48F) that has the same sequence as the ssDNA arm strand in “D” and “F.” The scale bar represents 20 μm.
Phase diagram of cGAS and a 48 nt ssDNA (48F(m)) that has the same sequence as the ssDNA arm strand in “E” and “G.” The scale bar represents 20 μm.
- A, B
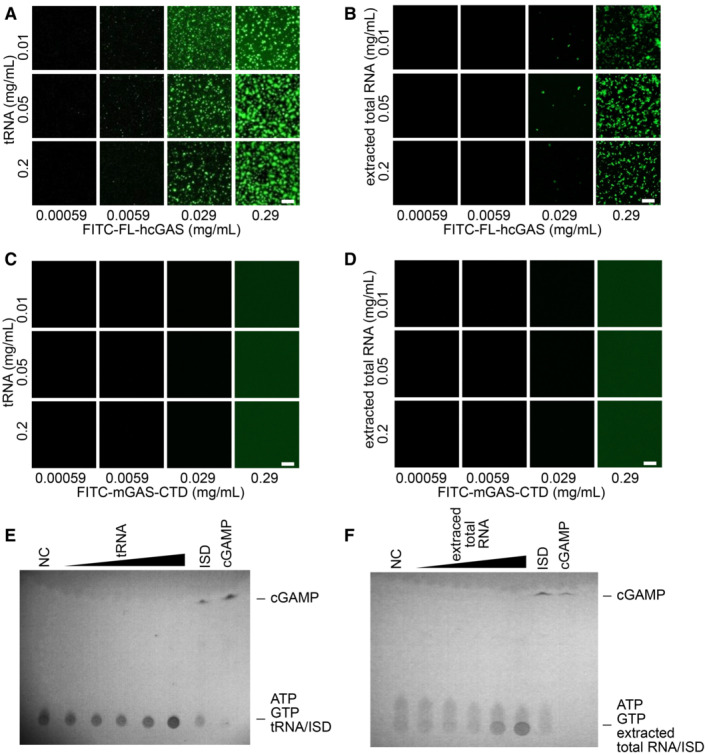
Fluorescence images of FITC‐labeled full‐length human cGAS (FITC‐FL‐hcGAS) incubated with (A) yeast tRNA or (B) extracted total RNA from HeLa cells at the indicated concentrations (n = 2, biological replicates, data from one representative independent biological replicate are shown). The scale bars represent 20 μm.
- C, D
Negative controls. Fluorescence images of FITC‐labeled C‐terminal domain of mouse cGAS (FITC‐mcGAS‐CTD) incubated with (C) yeast tRNA or (D) extracted total RNA from HeLa cells at the indicated concentrations (n = 2, biological replicates, data from one representative independent biological replicate are shown). mcGAS‐CTD is known not to form phase separation.
- E, F
TLC analysis of cGAMP, which is indicative of cGAS activation, upon incubation with (E) tRNA or (F) total RNA (n = 2, biological replicates, data from one representative independent biological replicate are shown). The FL‐hcGAS concentration was 0.265 mg/ml. The tRNA concentrations from low to high were 0.025, 0.05, 0.1, 0.25, and 0.85 mg/ml. The extracted total RNA concentrations from low to high were 0.025, 0.05, 0.1, 0.25, and 0.5 mg/ml. NC indicates the negative control that has only the FL‐hcGAS. dsDNA ISD at a concentration of 0.05 mg/ml was used as a positive control. All the samples were prepared in 20 mM HEPES at pH 7.5 and 150 mM NaCl.
- A–D
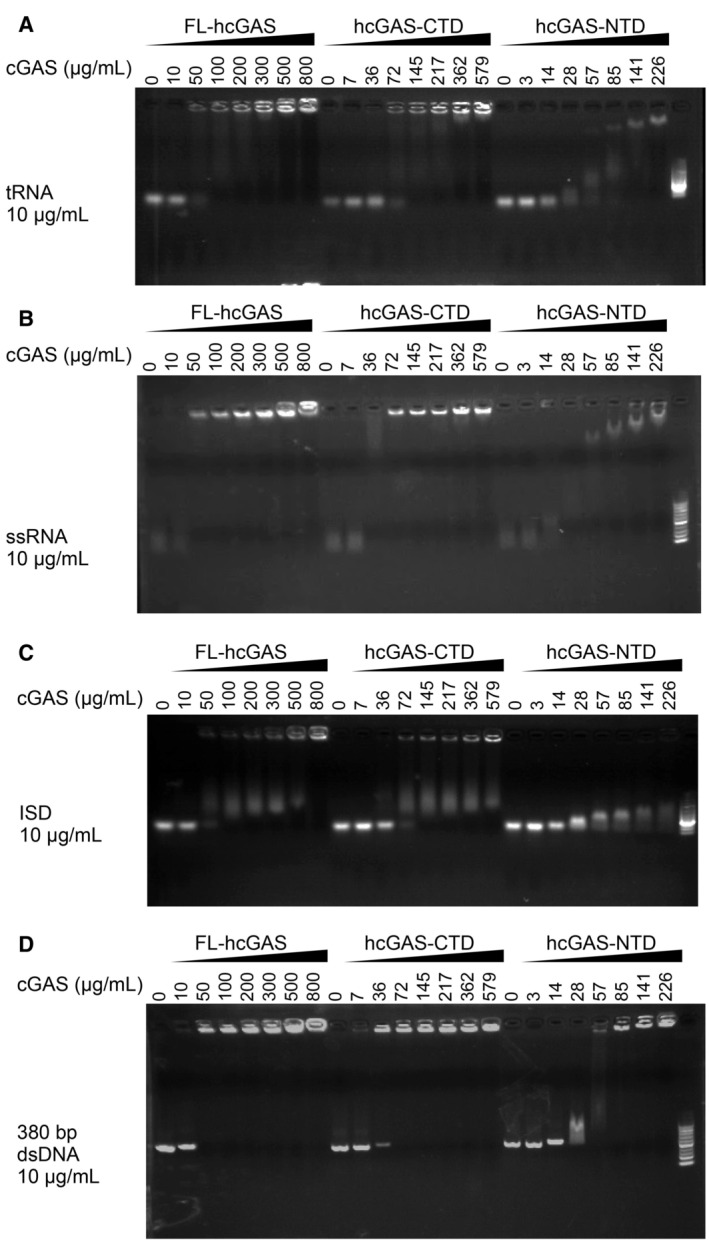
Electrophoretic mobility shift analysis (EMSA) of (A) yeast tRNA, (B) ssRNA, (C) ISD, and (D) 380‐bp dsDNA in presence of FL‐hcGAS (n = 2, biological replicates, data from one representative independent biological replicate are shown). The nucleic acid concentration was 10 μg/ml. The FL‐hcGAS concentrations were 0, 10, 50, 100, 200, 300, 500, and 800 μg/ml. The hcGAS‐CTD concentrations were 0, 7, 36, 72, 145, 217, 362, and 579 μg/ml. The hcGAS‐NTD concentrations were 0, 3, 14, 28, 57, 85, 141, and 226 μg/ml.
- A
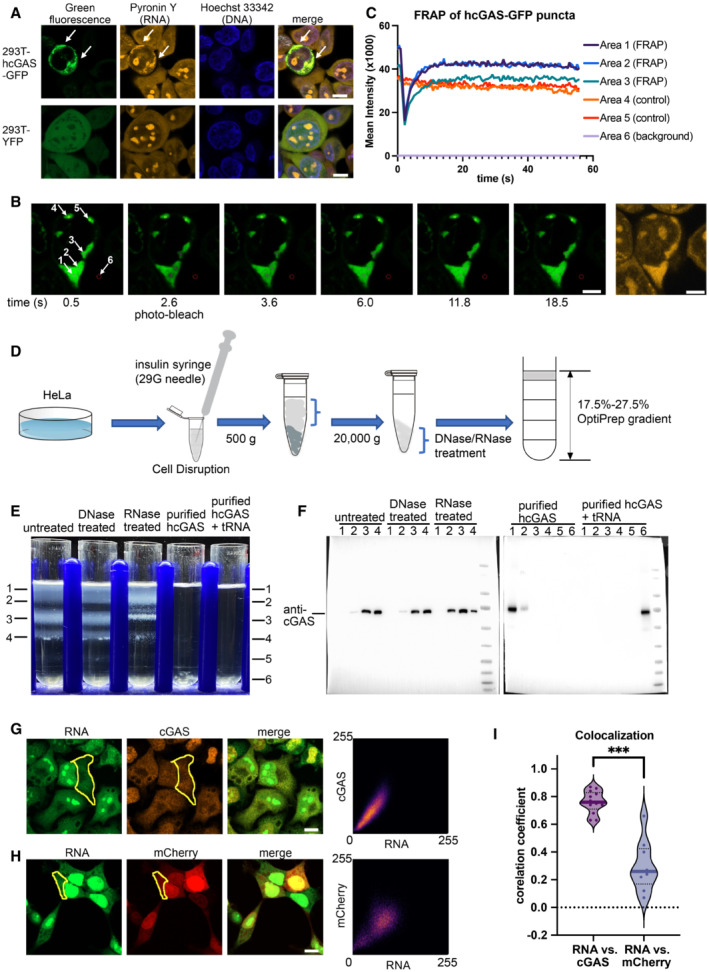
Hoechst 33342 and pyronin Y staining of HEK293T cells showing colocalization of the hcGAS‐GFP granules and RNAs (n = 3, biological replicates, data from one representative independent biological replicate are shown). Expression of the hcGAS‐GFP was induced by doxycycline at a concentration of 0.1 μg/ml. HEK293T cells that express YFP were used as the negative controls. The scale bars represent 10 μm.
- B, C
Fluorescence recovery after photo‐bleaching (FRAP) assay of hcGAS‐GFP granules in HEK293T cells (n = 4, biological replicates, data from one representative independent biological replicate are shown). (B) Images (left 1–6) of a 293T cell showing the hcGAS‐GFP signal in the cell. The selected areas are indicated with circles and arrows and are numbered in the left‐most image. Areas 1, 2, and 3 were photo‐bleached at the time indicated below images. Areas 4 and 5 were not photo‐bleached and were used as the controls. Signal in area 6 was taken as background. The yellow fluorescence image on the right showing the pyronin Y‐stained RNA signal, which colocalizes with the hcGAS‐GFP signal in the cytoplasm. The scale bars represent 5 μm. (C) Quantification of the fluorescence intensity changes in the 6 selected areas of the FRAP assay indicated in panel “B.”
- D
A schematic diagram showing the HeLa cell cytoplasm extraction and fractionation procedure. To release the cytoplasm without disrupting the nuclear membrane, the cell membranes were disrupted by suspension in a hypotonic buffer and passing the cells through a 29G needle three times. The hypotonic buffer contains 10 mM HEPES at pH 7.5, 5 mM KCl and 3 mM MgCl2.
- E
OptiPrep density gradient analyses of the HeLa cell cytoplasm extracts and purified hcGAS with and without tRNA (n = 3, biological replicates, data from one representative independent biological replicate are shown).
- F
Western blot analysis of the OptiPrep gradient fractions with or without DNase and RNase treatments.
- G
The three images on the left showing fluorescence signals of endogenous cGAS and RNA in HeLa cells (n = 13, biological replicates, data from one representative independent biological replicate are shown). The scale bar represents 10 μm. The scatterplot on the right plots the signal intensities of cGAS versus RNA at each pixel in the indicated cytoplasmic area (yellow circle).
- H
The three images on the left showing the fluorescence signals of mCherry and RNA in HEK293T cells (n = 9, biological replicates, data from one representative independent biological replicate are shown). The scale bar represents 10 μm. The scatterplot on the right plots signal intensities of mCherry versus RNA at each pixel in the indicated cytoplasmic area (yellow circle).
- I
Pearson's correlation coefficient (CC) analysis of the fluorescence signals of cGAS vs. RNA (n = 13, biological replicates), and mCherry vs. RNA (n = 9, biological replicates). The median values were calculated and used for the evaluation of significance. ***P < 0.001 (two‐tailed Mann–Whitney test).
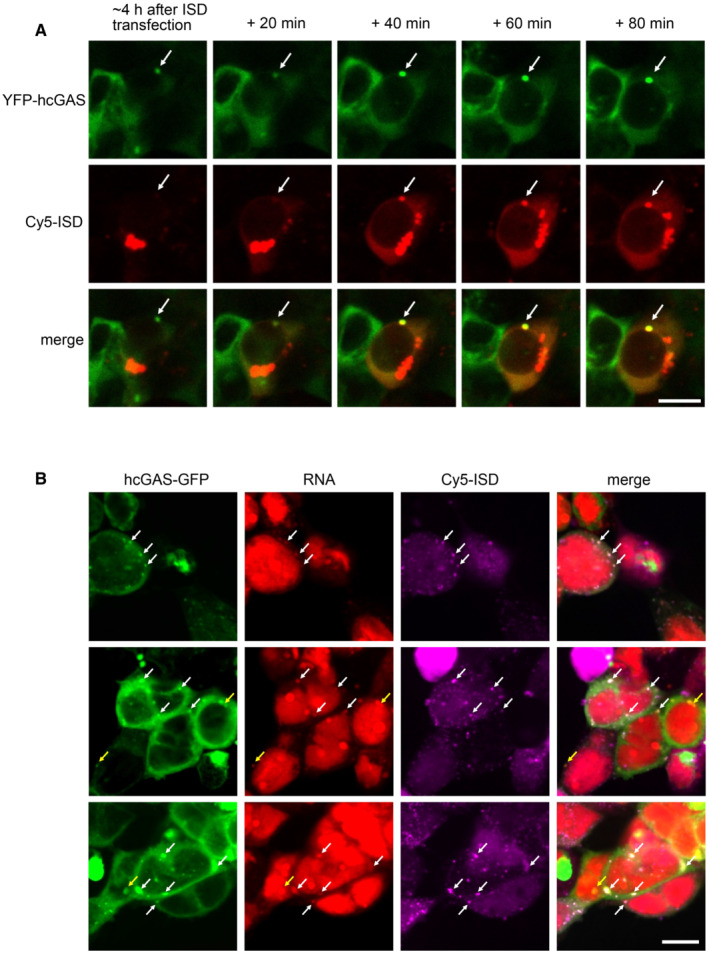
Real‐time observation showing the gradual incorporation of Cy5‐ISD into a preformed granule of YFP‐hcGAS in a HEK293T cell (n = 2, biological replicates, data from one representative independent biological replicate are shown). The Cy5‐ISD was transfected into cells with Lipofectamine 2000. White arrows indicate the granule. The scale bar represents 10 μm.
Representative fluorescence images showing colocalization of Cy5‐ISD with both hcGAS‐GFP and endogenous RNA in HEK293T cells (n = 3, biological replicates, data from one representative independent biological replicate are shown). Endogenous RNAs were specifically labeled by using a click reaction‐based method. White arrows indicate the granules with colocalized Cy5‐ISD, hcGAS‐GFP, and endogenous RNA. Yellow arrows indicate the granules with colocalized hcGAS‐GFP and endogenous RNA. The scale bar represents 10 μm.
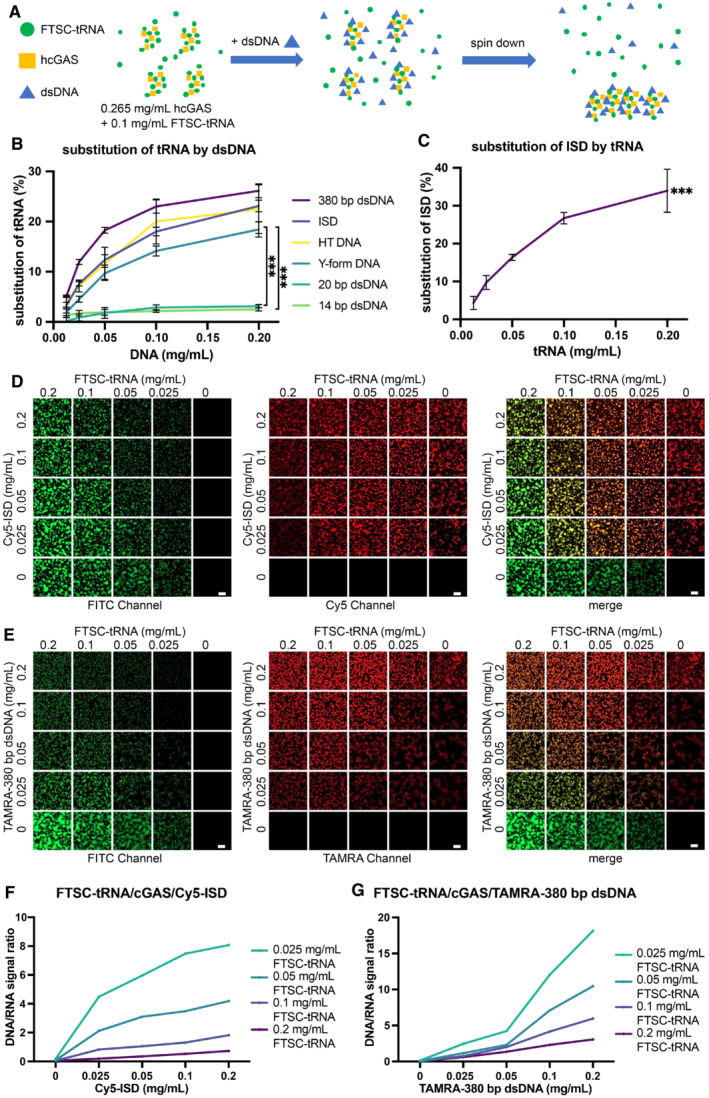
A schematic diagram of the methods used to quantify tRNA/dsDNA released from the phase‐separated granules. FTSC‐tRNA and FL‐hcGAS were premixed. dsDNA was added, and the sample was centrifuged. The fluorescence signal of FTSC‐tRNA in supernatant was measured.
The percentage of FTSC‐tRNA released into the supernatant after the addition of the indicated dsDNA as measured by fluorescence spectroscopy (n = 3, biological replicates). The percentage of FTSC‐tRNA released from the condensates was calculated by using the following equation: P = (Fi–F0) * 100/(F–F0). P: percentage of substituted FTSC‐tRNA. Fi: fluorescence of FTSC‐tRNA in the supernatant of each test. F0: fluorescence signal of FTSC‐tRNA in the supernatant when DNA was not added. F: fluorescence signal of FTSC‐tRNA without the addition of DNA and cGAS. The dsDNAs tested were ISD, 14‐bp dsDNA, 20‐bp dsDNA, 380‐bp dsDNA, herring testis DNA (HT DNA) and Y‐form DNA (a 14‐bp dsDNA with unpaired GGG on each end). Data are presented as mean ± SD. Significance was calculated for Y‐form DNA vs. 14‐bp dsDNA and Y‐from DNA vs. 20‐bp dsDNA, ***P < 0.001 (two‐way ANOVA).
The percentage of Cy5‐ISD released into the supernatant over time after the addition of yeast tRNA as measured by fluorescence spectroscopy (n = 3, biological replicates). The yeast tRNA was used to trigger the release of the ISD from the phase separations of cGAS‐ISD. The percentage of Cy5‐ISD released from the condensates was calculated by using the following equation: P = (Fi–F0) * 100/(F–F0). P: percentage of substituted Cy5‐ISD. Fi: fluorescence signal of Cy5‐ISD in the supernatant of each test. F0: fluorescence signal of Cy5‐ISD in the supernatant when tRNA was not added. F: fluorescence signal of Cy5‐ISD without adding tRNA and cGAS. Data are presented as mean ± SD. ***P < 0.001 (one‐way ANOVA).
Fluorescence microscopy images showing the replacement of FTSC‐tRNA by Cy5‐ISD at indicated concentrations in preformed granules of hcGAS and FTSC‐tRNA (n = 2, biological replicates, data from one representative independent biological replicate are shown). In each square, a representative area that is 1/16 of the raw image is displayed. The scale bars represent 20 μm.
Fluorescence microscopy images showing the replacement of FTSC‐tRNA by TAMRA‐380‐bp dsDNA at indicated concentrations in preformed granules of hcGAS and FTSC‐tRNA (n = 2, biological replicates, data from one representative independent biological replicate are shown). In each square, a representative area that is 1/16 of the raw image is displayed. The scale bars represent 20 μm.
Quantification of the replacement in “D.” For each square, the raw image used was evenly divided into four parts. Fluorescence signal ratios of Cy5‐ISD over FTSC‐tRNA in the four parts were calculated, averaged and plotted.
Quantification of the replacement in “E.” For each square, the raw image used was evenly divided into four parts. Fluorescence signal ratios of TAMRA‐380‐bp dsDNA over FTSC‐tRNA in the four parts were calculated, averaged and plotted.
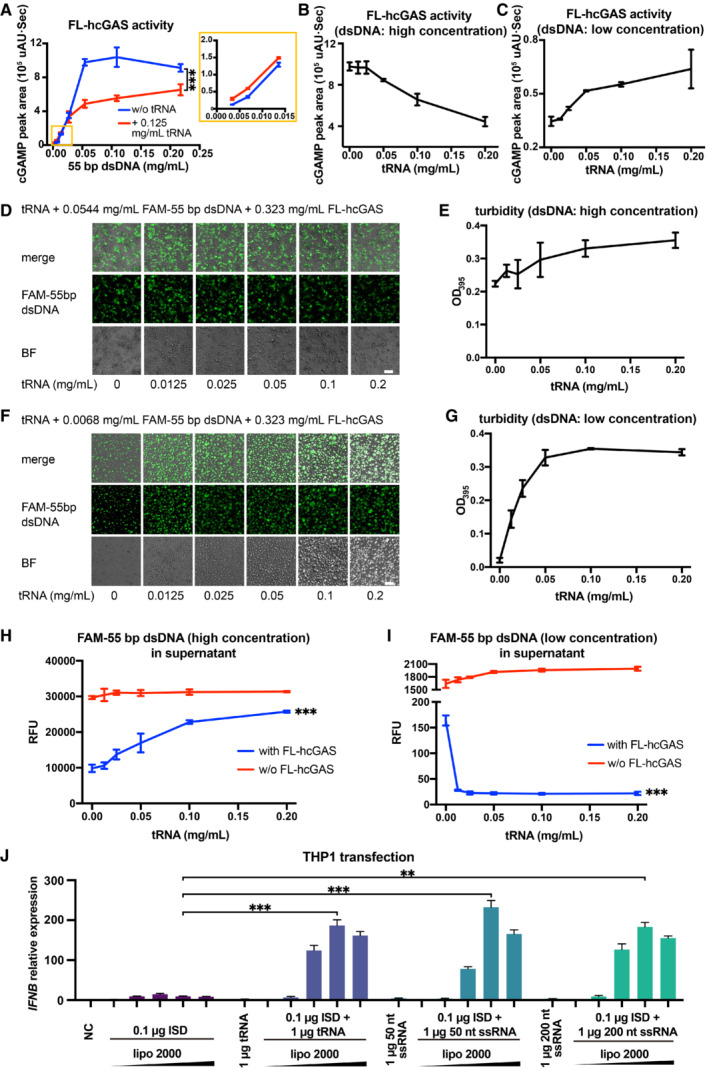
cGAS activity (as measured by the HPLC peak area of cGAMP) in the presence of a 55‐bp dsDNA at indicated concentrations and in presence or absence of 0.125 mg/ml tRNA (n = 3, biological replicates). The inset is an expanded view of the region boxed in yellow. ***P < 0.001 (two‐way ANOVA).
cGAS activity in the presence of 0.0544 mg/ml 55‐bp dsDNA and tRNA at indicated concentrations plotted as mean ± SD (n = 3, biological replicates).
cGAS activity in the presence of 0.0068 mg/ml 55‐bp dsDNA and tRNA at indicated concentrations (n = 3, biological replicates).
Fluorescence and bright‐field photographs of phase‐separated granules of FL‐hcGAS and 0.0544 mg/ml FAM‐labeled 55‐bp dsDNA in presence of tRNA at indicated concentrations (n = 2, biological replicates, data from one representative independent biological replicate are shown). The scale bar represents 20 μm.
Turbidities of FL‐hcGAS and 0.0544 mg/ml FAM‐labeled 55‐bp dsDNA in presence of tRNA at indicated concentrations as measured by absorption at 395 nm plotted as mean ± SD (n = 3, biological replicates).
Fluorescence and bright‐field photographs of phase‐separated granules of FL‐hcGAS and 0.0068 mg/ml FAM‐labeled 55‐bp dsDNA in presence of tRNA at indicated concentrations (n = 2, biological replicates, data from one representative independent biological replicate are shown). The scale bar represents 20 μm.
Turbidities of FL‐hcGAS and 0.0068 mg/ml FAM‐labeled 55‐bp dsDNA in presence of tRNA at indicated concentrations as measured by absorption at 395 nm plotted as mean ± SD (n = 3, biological replicates).
Fluorescence signals of the FAM‐labeled 55‐bp dsDNA in the supernatants of FL‐hcGAS and 0.0544 mg/ml FAM‐labeled 55‐bp dsDNA in presence of tRNA at indicated concentrations plotted as mean ± SD (n = 3, biological replicates). ***P < 0.001 (one‐way ANOVA).
Fluorescence signals of the FAM‐labeled 55‐bp dsDNA in the supernatants of FL‐hcGAS and 0.0068 mg/ml FAM‐labeled 55‐bp dsDNA in presence of tRNA at indicated concentrations (n = 3, biological replicates). ***P < 0.001 (one‐way ANOVA).
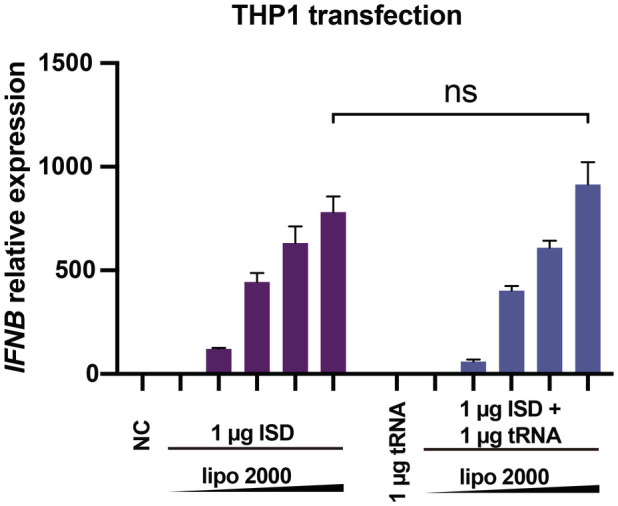
IFNB mRNA levels in THP1 cells induced by co‐transfecting dsDNA (ISD) and different RNAs (tRNA, 50 nt ssRNA and 200 nt ssRNA) plotted as mean ± SEM (n = 4, biological replicates). The volumes of Lipofectamine 2000 from low to high were 1, 2, 4, 6, and 8 μl. Significance was determined by two‐way ANOVA, **P < 0.01, ***P < 0.001.
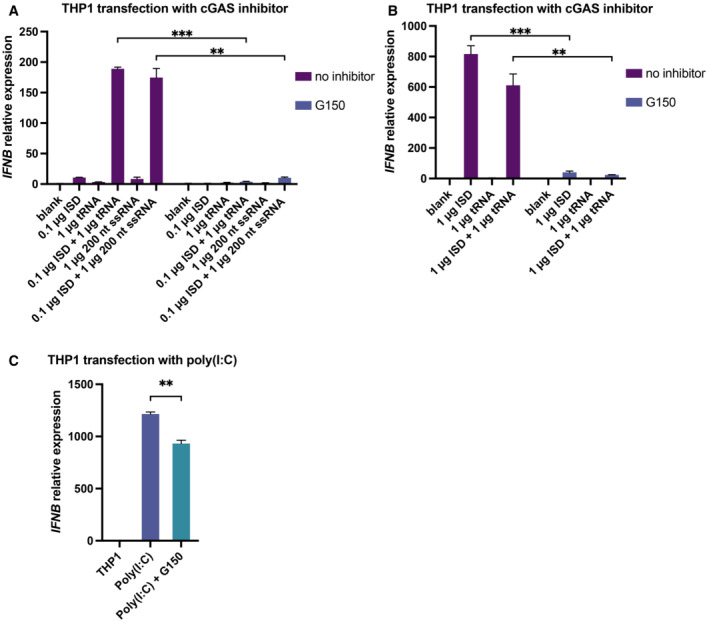
Expression of IFNB mRNA in THP1 cells transfected with 0.1 μg dsDNA (ISD) and 1 μg tRNA or 200 nt ssRNA with or without the cGAS‐specific inhibitor G150 (n = 4, biological replicates).
Expression of IFNB mRNA in THP1 cells transfected with 1 μg dsDNA (ISD) and 1 μg tRNA with or without the cGAS‐specific inhibitor G150 (n = 4, biological replicates).
Expression of IFNB mRNA in THP1 cells transfected with 1 μg poly(I:C) with or without cGAS‐specific inhibitor G150 (n = 3, biological replicates).
Similar articles
-
ZCCHC3 is a co-sensor of cGAS for dsDNA recognition in innate immune response.Nat Commun. 2018 Aug 22;9(1):3349. doi: 10.1038/s41467-018-05559-w. Nat Commun. 2018. PMID: 30135424 Free PMC article.
-
Restriction of Human Cytomegalovirus Replication by ISG15, a Host Effector Regulated by cGAS-STING Double-Stranded-DNA Sensing.J Virol. 2017 Apr 13;91(9):e02483-16. doi: 10.1128/JVI.02483-16. Print 2017 May 1. J Virol. 2017. PMID: 28202760 Free PMC article.
-
African Swine Fever Virus Armenia/07 Virulent Strain Controls Interferon Beta Production through the cGAS-STING Pathway.J Virol. 2019 May 29;93(12):e02298-18. doi: 10.1128/JVI.02298-18. Print 2019 Jun 15. J Virol. 2019. PMID: 30918080 Free PMC article.
-
Regulation of cGAS-STING signalling in cancer: Approach for combination therapy.Biochim Biophys Acta Rev Cancer. 2023 May;1878(3):188896. doi: 10.1016/j.bbcan.2023.188896. Epub 2023 Apr 17. Biochim Biophys Acta Rev Cancer. 2023. PMID: 37088059 Review.
-
Molecular mechanisms and cellular functions of cGAS-STING signalling.Nat Rev Mol Cell Biol. 2020 Sep;21(9):501-521. doi: 10.1038/s41580-020-0244-x. Epub 2020 May 18. Nat Rev Mol Cell Biol. 2020. PMID: 32424334 Review.
Cited by
-
Powering on cGAMP mini factories.EMBO Rep. 2022 Jan 5;23(1):e54231. doi: 10.15252/embr.202154231. Epub 2021 Nov 19. EMBO Rep. 2022. PMID: 34796613 Free PMC article.
-
Emerging mechanisms and implications of cGAS-STING signaling in cancer immunotherapy strategies.Cancer Biol Med. 2024 Jan 3;21(1):45-64. doi: 10.20892/j.issn.2095-3941.2023.0440. Cancer Biol Med. 2024. PMID: 38172538 Free PMC article. Review.
-
Mechanisms of phase-separation-mediated cGAS activation revealed by dcFCCS.PNAS Nexus. 2022 Jul 8;1(3):pgac109. doi: 10.1093/pnasnexus/pgac109. eCollection 2022 Jul. PNAS Nexus. 2022. PMID: 36741445 Free PMC article.
-
At the Crossroads of the cGAS-cGAMP-STING Pathway and the DNA Damage Response: Implications for Cancer Progression and Treatment.Pharmaceuticals (Basel). 2023 Dec 1;16(12):1675. doi: 10.3390/ph16121675. Pharmaceuticals (Basel). 2023. PMID: 38139802 Free PMC article. Review.
-
Phase separation in immune signalling.Nat Rev Immunol. 2022 Mar;22(3):188-199. doi: 10.1038/s41577-021-00572-5. Epub 2021 Jul 6. Nat Rev Immunol. 2022. PMID: 34230650 Free PMC article. Review.
References
-
- Andreeva L, Hiller B, Kostrewa D, Lassig C, de Oliveira Mann CC, Jan Drexler D, Maiser A, Gaidt M, Leonhardt H, Hornung V et al (2017) cGAS senses long and HMGB/TFAM‐bound U‐turn DNA by forming protein‐DNA ladders. Nature 549: 394–398 - PubMed
-
- Barbalat R, Ewald SE, Mouchess ML, Barton GM (2011) Nucleic acid recognition by the innate immune system. Annu Rev Immunol 29: 185–214 - PubMed
-
- Brangwynne CP, Eckmann CR, Courson DS, Rybarska A, Hoege C, Gharakhani J, Julicher F, Hyman AA (2009) Germline P granules are liquid droplets that localize by controlled dissolution/condensation. Science 324: 1729–1732 - PubMed
Publication types
MeSH terms
Substances
LinkOut - more resources
Full Text Sources
Research Materials
