. 2022 Nov 18;8(46):eadc9222.
doi: 10.1126/sciadv.adc9222. Epub 2022 Nov 16.

CTR9 drives osteochondral lineage differentiation of human mesenchymal stem cells via epigenetic regulation of BMP-2 signaling

Affiliations

CTR9 drives osteochondral lineage differentiation of human mesenchymal stem cells via epigenetic regulation of BMP-2 signaling

Ngai Ting Chan et al. Sci Adv. .

Abstract

Cell fate determination of human mesenchymal stem/stromal cells (hMSCs) is precisely regulated by lineage-specific transcription factors and epigenetic enzymes. We found that CTR9, a key scaffold subunit of polymerase-associated factor complex (PAFc), selectively regulates hMSC differentiation to osteoblasts and chondrocytes, but not to adipocytes. An in vivo ectopic osteogenesis assay confirmed the essentiality of CTR9 in hMSC-derived bone formation. CTR9 counteracts the activity of Enhancer Of Zeste 2 (EZH2), the epigenetic enzyme that deposits H3K27me3, in hMSCs. Accordingly, CTR9 knockdown (KD) hMSCs gain H3K27me3 mark, and the osteogenic differentiation defects of CTR9 KD hMSCs can be partially rescued by treatment with EZH2 inhibitors. Transcriptome analyses identified bone morphology protein-2 (BMP-2) as a downstream effector of CTR9. BMP-2 secretion, membrane anchorage, and the BMP-SMAD pathway were impaired in CTR9 KD MSCs, and the effects were rescued by BMP-2 supplementation. This study uncovers an epigenetic mechanism engaging the CTR9-H3K27me3-BMP-2 axis to regulate the osteochondral lineage differentiation of hMSCs.


Figures

Fig. 1.
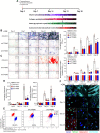
Fig. 1.. CTR9 KD has minor effects on viability, morphology, and proliferation of hMSCs.
(A) CTR9 levels in two CTR9 KD early-passage (p3/p4) clones of hMSCs derived from three donors as compared withhMSCs expressing shControl. β-Actin served as a loading control. MW, molecular weight; hBMSCs, human bone marrow-derived mesenchymal stem/stomal cells. (B) Immunofluorescence staining of nuclei (blue), F-actin (red), β-tubulin (green), and H3K27me3 (cyan) in shControl and shCTR9 hMSCs . Scale bar, 40× (applied to all images). (C) Flow cytometry of PI staining and annexin-V–fluorescein isothiocyanate (FITC) of shControl and two shCTR9 hMSC lines. Hydrogen peroxide (H2O2) served as a positive control. (D) WB of indicated proteins in shControl, shCTR9 hMSCs, and serum-starved hMSCs treated with sodium arsenite. The bands’ intensities were normalized with glyceraldehyde-3-phosphate dehydrogenase (GAPDH). PCNA, proliferating cell nuclear antigen; (E) Cell cycle profiles of shControl or shCTR9 hMSCs. Data are represented as means ± SD (n = 3). P values were calculated by two-tailed t test (*P < 0.05). (F) Immunofluorescence staining of Ki67 (green), G3BP1 (red), β-galactosidase (cyan), and nuclei (Hoechst 33342) in shControl and shCTR9 hMSCs. Parental hMSCs were treated as in (D). Scale bar, 60× (applied to all images). (G) Top: Representative hematoxyin and eosin (H&E) staining of 3D spheroids of shControl or shCTR9 hMSCs 72 hour after seeding. Bottom: Representative images of 3D spheroids by equal numbers of shControl or shCTR9 hMSCs after seeding at indicated time. Scale bar, 10× (at the bottom right applied to all images). (H) Reverse transcription quantitative polymerase chain reaction analyses of CTR9, stemness genes (OCT4/NANOG/SOX2/TRET), and MSC-specific surface antigens (CD73/CD90/CD105) in shControl and shCTR9 hMSCs. Relative fold change (FC) in mRNA levels is represented as means ± SD (n = 3) and were normalized to β-actin. P values were calculated by two-tailed t test (*P < 0.05; n.s., not significant).
Fig. 2.
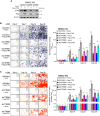
Fig. 2.. Osteogenic differentiation was impaired in CTR9 KD hMSCs.
(A) Schematic workflow of osteogenic induction of hMSCs in vitro. (B) Left: Representative images showing the ALP activity–associated BCIP-NBT staining (violet blue) in shControl or shCTR9 hMSCs (shCTR9#3/#5) from days 0 to 28 of osteogenic induction. Scale bar, 20× (at the bottom right applied to all corresponding images). Right: Quantification of ALP activity by optical density at 595 nm (OD595nm) absorbance normalized with respective DNA content. Data are represented as means ± SD (n = 3). P values were calculated by two-tailed t test with *P < 0.05 and **P < 0.01. OM, osteogenic induction medium. (C) Left: Representative images showing the calcium matrix formation stained with Alizarin Red S of shControl or shCTR9 hMSCs (shCTR9#3/#5) from days 0 to 28 of osteogenic induction. Scale bar, 20× (at the bottom right applied to all corresponding images). Right: Quantification of ECM formation by OD540nm absorbance normalized with the respective DNA content. Data are represented as means ± SD (n = 3). P values were calculated by two-tailed t test with *P < 0.05 and **P < 0.01. (D) Osteocalcin (left) and Osteopontin (right) secretion of shControl or shCTR9 hMSCs (shCTR9#3/#5) measured using the human Osteocalcin/Osteopontin enzyme-linked immunosorbent assay (ELISA) kit after 0, 14, or 28 days of osteogenic induction followed by 2-day culture in serum-free medium. Data normalized by the respective DNA content are represented as means ± SD (n = 6). P values were calculated by two-tailed t test with *P < 0.05 , **P < 0.01 and ***P < 0.001. (E) Flow cytometry analyses of CD73/CD90, the undifferentiated hMSCs markers, and Osteocalcin/Osteopontin, the osteogenic differentiated hMSCs markers, in shControl or shCTR9 hMSCs (shCTR9#3/#5) on days 0 and 21 of osteogenic induction. (F) Immunofluorescence imaging of CD73/CD90 (cyan), RUNX2 (green), and Osteocalcin in shControl or shCTR9 hMSCs (shCTR9#3/#5) from days 0 to 28 of osteogenic induction. Nuclei were stained by Hoechst 33342 in blue.
Fig. 3.
Fig. 3.. Osteogenic differentiation potential of hMSCs is CTR9 dose dependent.
(A) WB analyses of CTR9 levels in shControl or shCTR9 hMSCs (shCTR9#3/#5) exogenously express Flag-CTR9. Blank vectors were transfected as controls (+ Vector). (B) Right: Representative images of BCIP-NBT staining (violet blue) of shControl or shCTR9 hMSCs (shCTR9#3/#5) transfected with blank vector (+ Vector) or Flag-CTR9 plasmid (+ Flag-CTR9) from days 0 to 28 of osteogenic induction. Scale bar, 20× (at the bottom right applied to all corresponding images). Left: Quantification of ALP activity by OD595nm absorbance normalized with the respective DNA content. Data are represented as means ± SD (n = 6). P values were calculated by two-tailed t test with *P < 0.05 and **P < 0.01. (C) Right: Representative images showing the ECM formation with Alizarin Red S staining of shControl or shCTR9 hMSCs (shCTR9#3/shCTR9#5) transfected with blank vector (+ Vector) or Flag-CTR9 plasmid (+ Flag-CTR9) from days 0 to 28 of osteogenic induction. Scale bar, 20× (at the bottom right applied to all corresponding images). Left: Quantification of ECM formation by OD540nm absorbance normalized with the respective DNA content. Data are represented as means ± SD (n = 6). P values were calculated by two-tailed t test with *P < 0.05 and **P < 0.01.
Fig. 4.
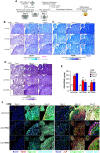
Fig. 4.. CTR9 is required for in vivo bone formation.
(A) Schematic workflow for in vivo ectopic bone formation assay using mock, shControl, and two shCTR9 hMSC lines. (B) Scatter dot plot showing the calculated volume (cubic millimeter) of calcification within the implanted 3D scaffolds after micro-CT scanning. Data are depicted as means ± SD (n = 8). P values that were calculated by two-tailed t test with Welch’s correction were shown. (C) Box plot showing the converted mineral density (milligram per cubic millimeter) of calcification within the implanted 3D scaffolds after in vivo micro-CT scanning. Box and whiskers depict 5th to 95th percentiles, and error lines depict the minimum to maximum box plot (n = 8). Mean was labeled with “+.” P values that were calculated by two-tailed t test with Welch’s correction were shown. (D) ALP activity staining in a quarter of sectioned scaffolds seeded with shControl or shCTR9 hMSCs after 8-week implantation in mice. A 10-μl tip at the left serves as a scale bar in the integral view. (E) Calcium matrix deposition staining (Alizarin Red S) of scaffolds described in (D) with the same scale bar. (F) Confocal immunofluorescence staining of nuclei (blue), F-actin (red), and osteocalcin (green) of scaffolds described in (D). Scale bar, 10× (applied to all images). (G) Quantification of osteocalcin (left) and osteopontin (right) expression by ELISA in scaffolds described in (D). The mock group served as a background control. Data were prenormalized with the respective dry weight of 3D scaffolds and presented as means ± SD (n = 8). P values were calculated by two-tailed t test with Welch’s correction (*P < 0.05 and **P < 0.01). (H to L) Representative H&E (H), Von-Kossa (I), Masson’s trichome (J), Picrosirius red (K), and fast red TR/naphthol AS-MX phosphate staining (for ALP) (L) on scaffolds described in (D). Calcification spots or areas with clustered collagen enrichment or elevated ALP activity were denoted with arrowheads or with zoomed dash boxes, respectively.
Fig. 5.
Fig. 5.. CTR9 loss impairs chondrogenesis of hMSCs.
(A) Schematic workflow of chondrogenic induction of hMSCs using 3D spheroid culture model. (B) Representative images of Alcian blue (pH 2.5) staining on 3D spheroids of shControl or shCTR9 hMSCs (shCTR9#3/#5) after 0 to 21 days of chondrogenic induction. CECM was stained in light blue. Nuclei were stained in pink, and cytoplasms were stained in pale pink. CM, chondrogenic induction medium. (C) Representative images of Toluidine blue staining of 3D spheroids of shControl and shCTR9 hMSCs (shCTR9#3/#5) after 0 to 21 days of chondrogenic induction. CECM was stained in dark blue. Nuclei were stained in violet blue. (D) Representative images of DMMB staining of 3D spheroids of shControl and shCTR9 hMSCs (shCTR9#3/#5) after 0 to 21 days of chondrogenic induction. GAGs were stained in dark purple. (E) Quantification of GAGs content in 3D spheroids of shControl and shCTR9 hMSCs (shCTR9#3/#5) after 0 to 21 days of chondrogenic induction. Data normalized by the respective DNA content are represented as means ± SD (n = 3). P values were calculated by two-tailed t test with Welch’s correction (*P < 0.05 and **P < 0.01). (F) Multiplex immunofluorescence staining of SOX9/aggrecan/chondroadherin (left) and ALP/collagen type II/type I (right) in 3D spheroids of shControl and shCTR9 hMSCs (shCTR9#3/#5) after 0 to 21 days of chondrogenic induction. Nuclei were stained in blue by Hoechst 33342. Scale bar, 60× (at the bottom right applied to all images).
Fig. 6.
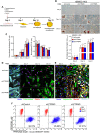
Fig. 6.. hMSC adipogenic differentiation was not affected by loss of CTR9.
(A) Schematic workflow of adipogenic induction of hMSCs in vitro. (B) Top: Representative images showing the lipid vesicles formation with Oil Red O staining on shControl or shCTR9 hMSCs (shCTR9#3/#5) after 0 to 21 days of adipogenic induction. Scale bar, 20× (at the bottom right applied to all images). AM, adipogenic induction medium. Bottom: Quantification of lipid vesicles measured by OD492nm absorbance normalized with the respective DNA content. Data are represented as means ± SD (n = 3). P values were calculated by two-tailed t test. (C) Quantification of cholesterol and FFA concentration in total lipids extracted from shControl or shCTR9 hMSCs (shCTR9#3/#5) after 0 to 21 days of adipogenic induction. Data normalized by the respective DNA content are represented as means ± SD (n = 3). P values were calculated by two-tailed t test (*P < 0.05). (D) Immunofluorescence imaging of undifferentiated hMSCs markers CD73/CD90 (cyan), adipogenic-differentiated MSCs marker PPARγ (red), and neutral lipid droplets (green) in shControl or shCTR9 hMSCs (shCTR9#3/#5) after 0 to 21 days of adipogenic induction. Nuclei were stained by Hoechst 33342 in blue. Scale bar, 60× (at the bottom right applied to all images). (E) Immunofluorescence imaging of adiponectin (green), Periplin-1 (cyan), and lipid droplets indicated by Nile red in shControl or shCTR9 hMSCs (shCTR9#3/#5) after 0 to 21 days of adipogenic induction. Nuclei were stained by Hoechst 33342 in blue. Scale bar, 60× (at the bottom right applied to all images). (F) Flow cytometry analyses of CD73/CD90 and PPARγ/lipid droplet (BODIPY 493/503) in shControl or shCTR9 hMSCs (shCTR9#3/#5) after 0 to 21 days of adipogenic induction.
Fig. 7.
Fig. 7.. BMP-2/SMAD pathway was impaired in CTR9 KD hMSCs during osteogenic differentiation.
(A) Schematic workflow for preparation of shControl and shCTR9 hMSCs to RNA-seq. (B) Volcano plots of RNA-seq data showing the up- or down-regulated genes in shCTR9 hMSCs in compared to shControl hMSCs after 7 days of osteogenic induction. Blue dots indicated the significantly down-regulated genes. Red dots indicated the significant upregulated genes (n = 3). (C) Reactome pathway analysis of significant down-regulated genes in shCTR9 hMSCs. (D) Gene set enrichment analysis analysis of significant down-regulated genes on BMP signaling pathway. FDR, false discovery rate. (E) Immunofluorescence staining of BMP-2 (Red) along with the ER marker calnexin (green) and cell/nuclear membrane dye (DiD; cyan) in shControl or shCTR9 hMSCs from days 0 to 14 of osteogenic induction. Scale bar, 60× (at the bottom right applied to all images with merged colors). (F) WB of BMP-2 in different cellular fractions derived from shControl or shCTR9 hMSCs after 0 to 14 days of osteogenic induction. Histone H3, GAPDH, and Na+,K+-ATPase (Na+- and K+-dependent ATPase) served as loading controls for corresponding cellular fractions. (G) Representative images showing the ALP activity–associated BCIP-NBT staining (left) and Alizarin Red S staining of ECM formation (right) in shControl or shCTR9 hMSCs with or without the supplement of BMP-2 peptide after indicated days of osteogenic induction. Scale bar, 20× (at the bottom right applied to all images).
Fig. 8.
Fig. 8.. The osteogenic differentiation defects by loss of CTR9 were rescued by an EZH2 inhibitor.
(A) Representative images showing the ALP activity–associated BCIP-NBT staining (violet blue) on shControl or shCTR9 hMSCs (shCTR9#3/#5) treated with DMSO, 1 μM UNC2400, or 0.5/1 μM UNC1999 during 0 to 28 days of osteogenic induction. (B) Quantification of ALP activities in the respective conditions of (A). Data are represented as means ± SD (n = 3). P values were calculated by two-tailed t test with *P < 0.05 and **P < 0.01. (C) WB analysis of H3K27me3 levels in shControl or shCTR9 hMSCs (shCTR9#3/#5) after 0 to 21 days of osteogenic induction (top). Ponceau S staining of histones (bottom). Each sample is loaded in twofold dilution. Total histone H3 served as a loading control. (D) H3K27me3 levels in shControl or shCTR9 hMSCs (shCTR9#3/#5) after 0 to 21 days of osteogenic induction measured by ELISA assays. Data were normalized to the respective total histone H3 levels and shown in minimum to maximum box blot (+, mean; error bars, SD; n = 6). (E) Immunofluorescence imaging of EZH2 (green), KDM6A (red), and H3K27me3 (cyan) in shControl or shCTR9 hMSCs from days 0 to 21 of osteogenic induction. Nuclei were stained by Hoechst 33342 in blue. Scale bar, 60× (at the bottom right applied to all images).

References

    1. J. Feng, A. Mantesso, C. De Bari, A. Nishiyama, P. T. Sharpe,Dual origin of mesenchymal stem cells contributing to organ growth and repair. Proc. Natl. Acad. Sci. U.S.A. 108,6503–6508 (2011). - PMC - PubMed
    1. L. A. Marquez-Curtis, A. Janowska-Wieczorek, L. E. McGann, J. A. Elliott,Mesenchymal stromal cells derived from various tissues: Biological, clinical and cryopreservation aspects. Cryobiology 71,181–197 (2015). - PubMed
    1. G. Sheng,The developmental basis of mesenchymal stem/stromal cells (MSCs). BMC Dev. Biol. 15,44 (2015). - PMC - PubMed
    1. T. Hoshiba, N. Kawazoe, G. Chen,The balance of osteogenic and adipogenic differentiation in human mesenchymal stem cells by matrices that mimic stepwise tissue development. Biomaterials 33,2025–2031 (2012). - PubMed
    1. I. Shur, O. Reish, E. Ezra, D. Benayahu,Analysis of mesenchymal cells derived from an chondrodysplasia punctuate patient and donors. J. Cell. Biochem. 93,112–119 (2004). - PubMed