. 2022 Nov 18;8(46):eabo2098.
doi: 10.1126/sciadv.abo2098. Epub 2022 Nov 16.

Astrocyte dysfunction drives abnormal resting-state functional connectivity in depression

Affiliations

Astrocyte dysfunction drives abnormal resting-state functional connectivity in depression

Jiaming Liu et al. Sci Adv. .

Abstract

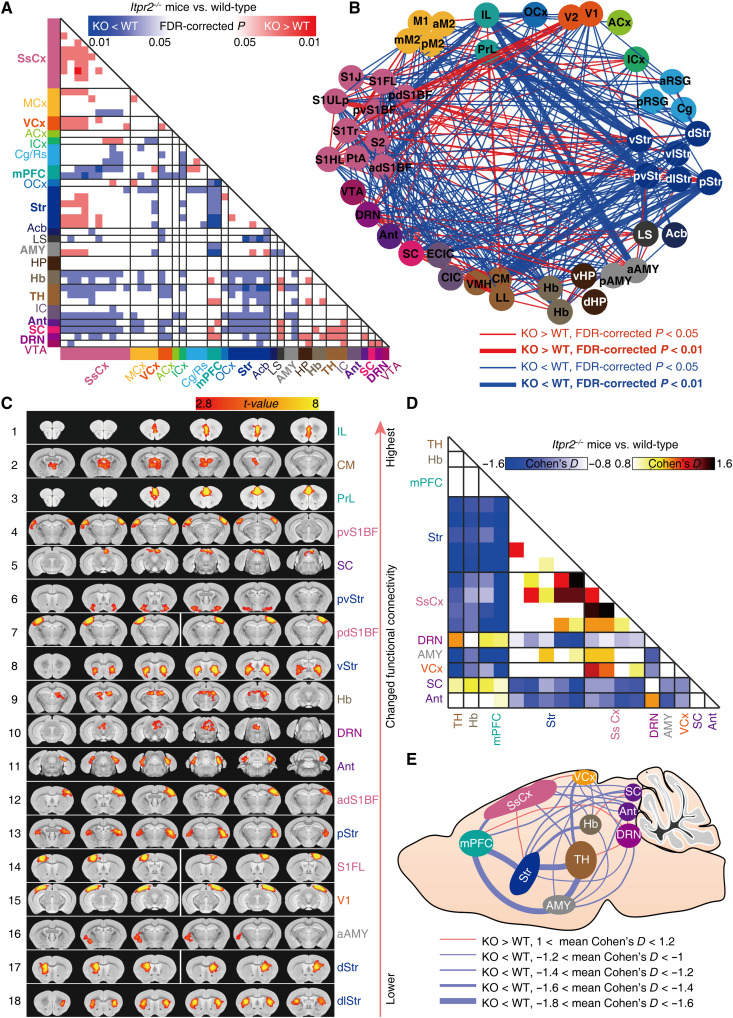
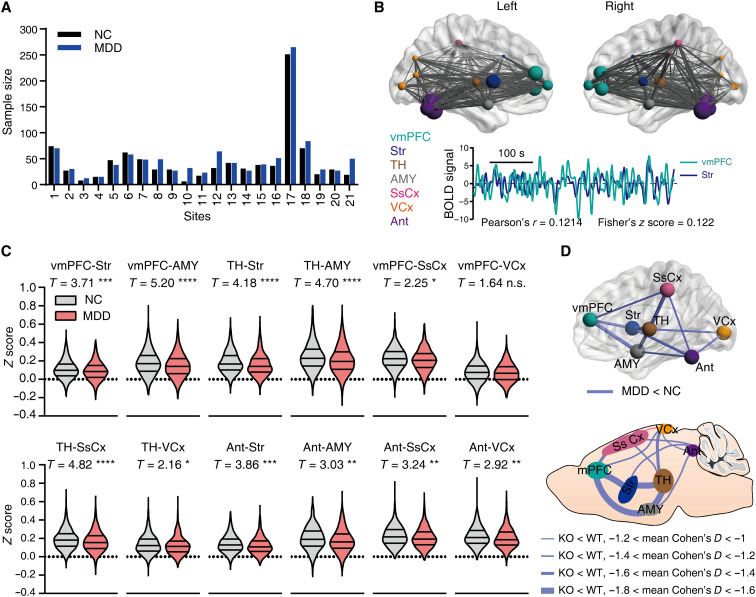
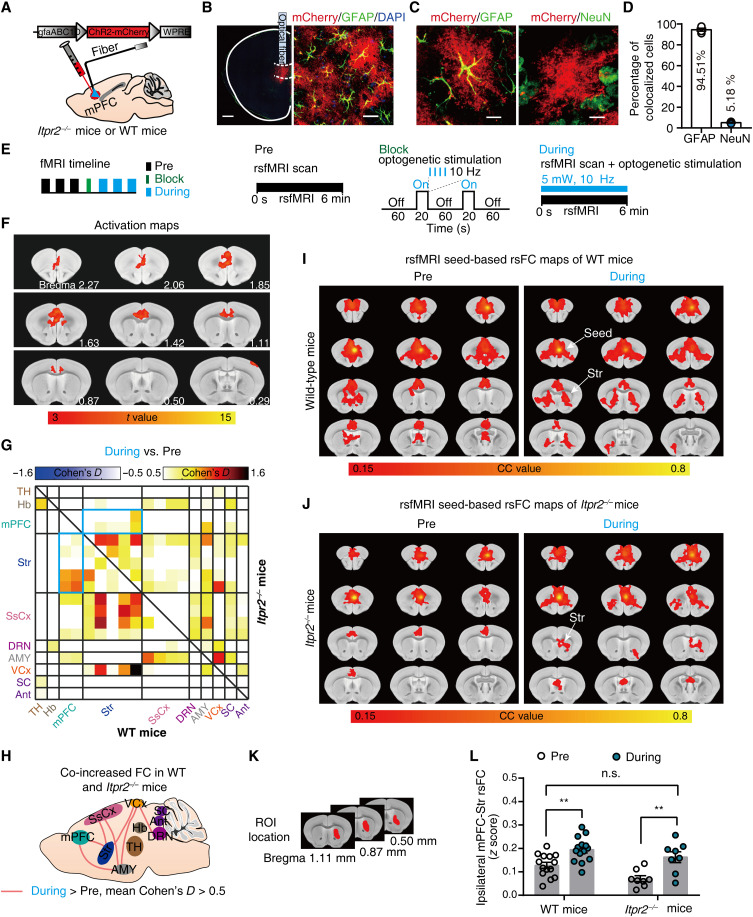
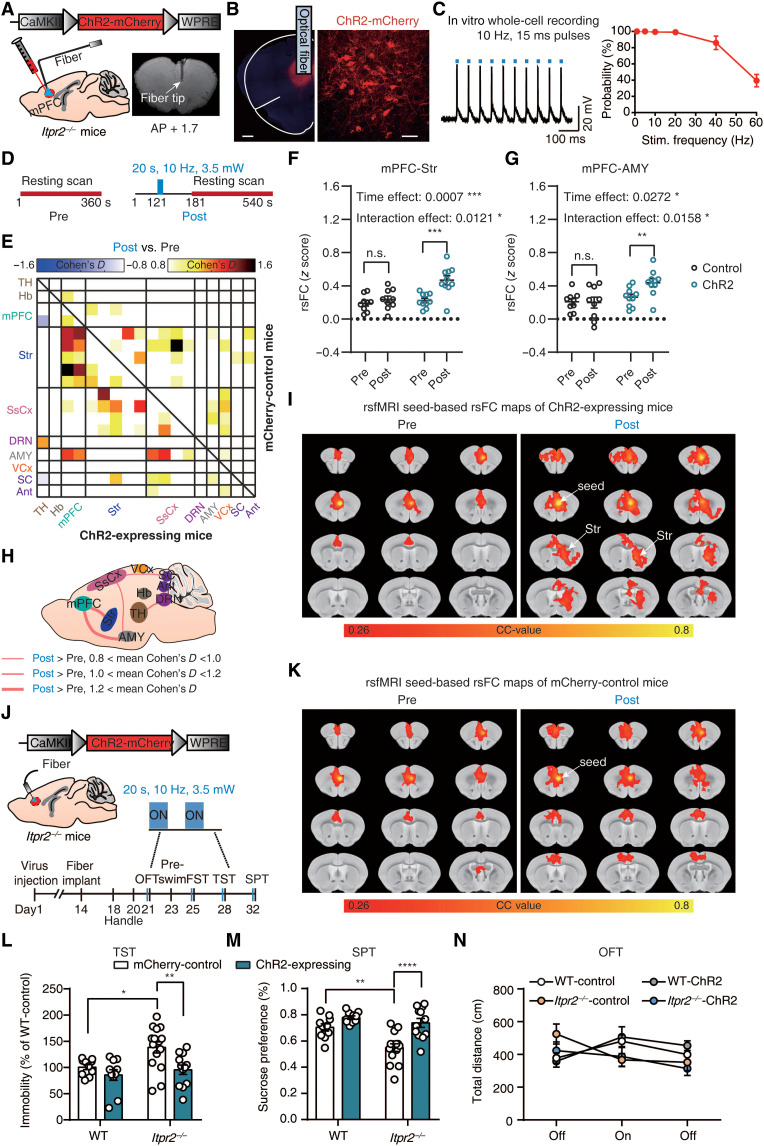
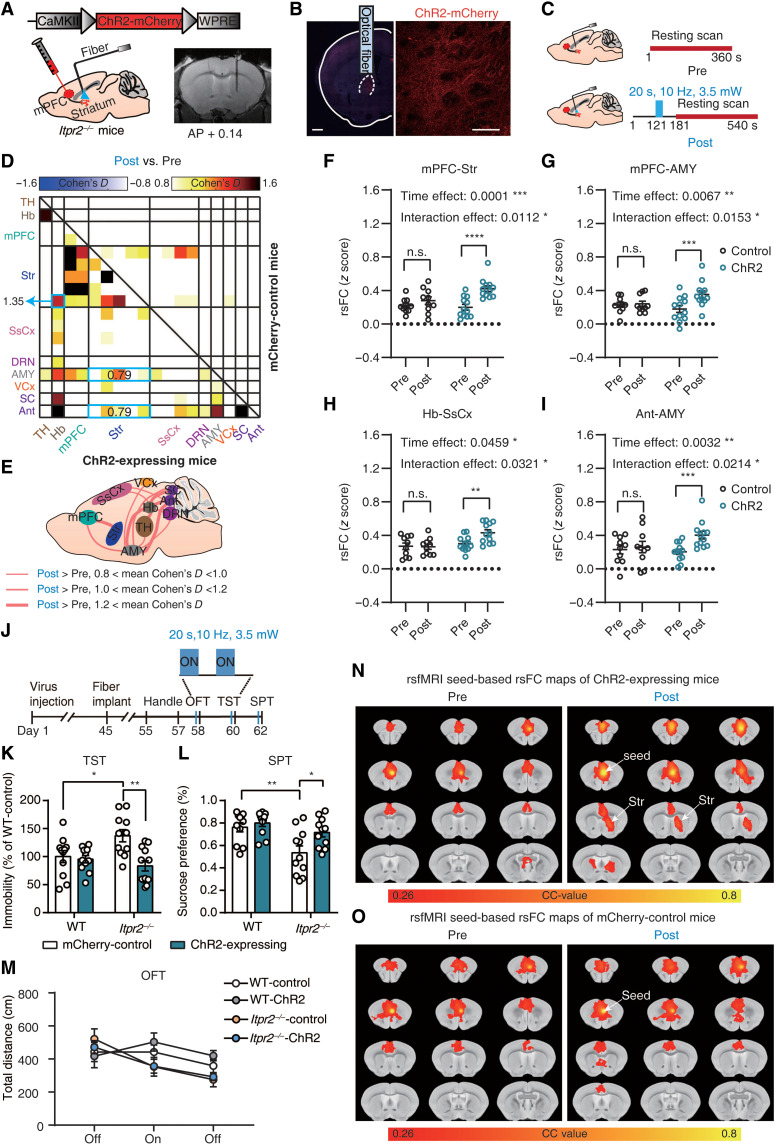
Major depressive disorder (MDD) is a devastating mental disorder that affects up to 17% of the population worldwide. Although brain-wide network-level abnormalities in MDD patients via resting-state functional magnetic resonance imaging (rsfMRI) exist, the mechanisms underlying these network changes are unknown, despite their immense potential for depression diagnosis and management. Here, we show that the astrocytic calcium-deficient mice, inositol 1,4,5-trisphosphate-type-2 receptor knockout mice (Itpr2-/- mice), display abnormal rsfMRI functional connectivity (rsFC) in depression-related networks, especially decreased rsFC in medial prefrontal cortex (mPFC)-related pathways. We further uncover rsFC decreases in MDD patients highly consistent with those of Itpr2-/- mice, especially in mPFC-related pathways. Optogenetic activation of mPFC astrocytes partially enhances rsFC in depression-related networks in both Itpr2-/- and wild-type mice. Optogenetic activation of the mPFC neurons or mPFC-striatum pathway rescues disrupted rsFC and depressive-like behaviors in Itpr2-/- mice. Our results identify the previously unknown role of astrocyte dysfunction in driving rsFC abnormalities in depression.


Figures

Fig. 1.
Fig. 1.. Brain-wide functional connectivity mapping of Itpr2−/− and WT mice by rsfMRI.
(A and B) Intergroup statistical comparison of rsFC of Itpr2−/− and WT mice (n = 11 and 13 mice for Itpr2−/− and WT mice, respectively), shown as matrix (A) and network graph (B). The nodes correspond to 47 brain regions detected from ICA (listed in table S1). Independent sample t test, P < 0.05, false discovery rate (FDR) correction for multiple comparisons; only the significantly changed pathways (FDR-corrected P < 0.05) are shown. (C) The 47 brain regions are ranked in the order of the overall rsFC changes, and the top 18 ROIs (mean effect size > 0.7) are shown in (C) to (E). The effect size matrix (D) and schematic diagram (E) showing the changed rsFC between top 18 ROIs. MCx, motor cortex; ACx, auditory cortex; ICx, insular cortex; Cg/Rs, cingulate/retrosplenial cortex; OCx, orbital cortex; Acb, accumbens nucleus; LS, lateral septal nucleus; Hb, habenular nucleus; IC, inferior colliculus; IL, infralimbic cortex; PrL, prelimbic cortex; CM, central medial thalamus nucleus. For the abbreviation details, see table S1.
Fig. 2.
Fig. 2.. Attenuated rsFC in MDD patients consistent with that in Itpr2−/− mice.
(A) Sample size for MDD patients (1080 MDD) and normal controls (931 NC). The horizontal axis represents 21 study sites from China. See also table S2. (B) Locations of ROIs and data analysis schematic. For each subject, rsFC was generated by calculating the Pearson’s correlation coefficient (r) of the BOLD signals and then transformed to Fisher’s z score, as in this representative subject. (C) Violin figures showing the distribution of rsFC for MDD and NC subjects. Linear mixed models. *P < 0.05, **P < 0.01, ***P < 0.001, and ****P < 0.0001; FDR for multiple comparison correction, n.s., no significance. (D) Similar rsFC changes in MDD patients and Itpr2−/− mice. See table S3 for MNI coordinates for ROIs in (B).
Fig. 3.
Fig. 3.. Optogenetic stimulation of mPFC astrocytes increases rsFC within depression-related networks.
(A) Schematic showing the virus injection and optical fiber implantation. (B) Confocal images demonstrate ChR2 expression in mPFC astrocytes. Red, ChR2-mCherry; green, GFAP; blue, 4′,6-diamidino-2-phenylindole (DAPI). Scale bars, 500 μm (left) and 25 μm (right). (C) Representative histology of ChR2-mCherry colocalized with GFAP (left) or NeuN (right). Scale bars, 10 μm. (D) Quantitative analysis of the percentage of ChR2-positive cells that colocalized with GFAP (n = 290 mCherry-positive cells; 12 fields of view; four mice) and NeuN (n = 409 mCherry-positive cells; 17 fields of view; four mice). (E) Schematics of fMRI scanning timeline and corresponding paradigms. (F) Representative activation maps at 10-Hz stimulation. (G) Effect size matrix (Cohen’s D > 0.5) showing effect of optogenetic stimulation on ipsilateral rsFC within depression-related networks in WT (n = 14; bottom-left part) and Itpr2−/− mice (n = 8; top-right part). The blue matrix box indicates the effect size of mPFC-Str rsFC. (H) Effect size schematic diagram shows co-increased ipsilateral rsFC in WT and Itpr2−/− mice. (I and J) Resting-state correlation maps of ipsilateral mPFC of WT and Itpr2−/− mice before and during optogenetic stimulation. (K) Str ROI used to extract the CC value in the rsFC maps of mPFC (I and J). (L) Quantification of ipsilateral mPFC-Str rsFC in WT and Itpr2−/− mice. Two-way analysis of variance (ANOVA) followed by Sidak’s multiple comparison test, data are expressed as means ± SEM, **P < 0.01.
Fig. 4.
Fig. 4.. Deletion of Itpr2 impairs the mPFC-to-Str neuronal communication.
(A) Schematic and a representative T1-weighted image illustrate the infusion site of MnCl2. (B) Experimental paradigm for dynamic manganese-enhanced MRI (MEMRI). (C) Representative three-dimensional maximum density projection images of a WT mouse showing the spread of Mn2+ enhancement 8.5 hours after infusion. (D) Definitions of ROIs. (E) Average color-coded MEMRI images. (F) Quantitative analysis of Mn2+ dynamic accumulation in the defined ROIs. Two-way repeated-measures ANOVA followed by Sidak’s multiple comparison test; *P < 0.5, n = 9 mice in each group. Data are expressed as means ± SEM.
Fig. 5.
Fig. 5.. Optogenetic activation of mPFC neurons rescues partial rsFC and depressive-like behaviors in Itpr2−/− mice.
(A) Schematic showing the virus injection and optical fiber implantation. (B) Confocal images displaying ChR2 expression in neurons within mPFC. Red, ChR2-mCherry; blue, DAPI. Scale bars, 500 μm (left) and 50 μm (right). (C) In vitro slice recording (n = 4 neurons from three mice). (D) Optogenetic fMRI scanning paradigm. Pre, pre-stimulation; Post, post-stimulation. (E) Effect size matrix showing effect of optogenetic stimulation on ipsilateral rsFC within depression-related networks of ChR2-expressing (n = 10; bottom-left part) and control mice (n = 9; top-right part). (F and G) Quantitative analyses of ipsilateral mPFC-Str and mPFC-AMY rsFC before and after optogenetic stimulation. Two-way ANOVA with group (control versus ChR2) and time (Pre versus Post) as factors followed by Sidak’s multiple comparison test. (H) Effect size schematic diagram of ipsilateral rsFC of ChR2-expressing mice. (I and K) Average resting-state correlation maps of ipsilateral mPFC. (J) Schematic (top) and timeline (bottom) of behavioral tests. (L to N) Behavior performances of Itpr2−/− and WT mice in the TST, sucrose preference (SPT), and open-field test (OFT) after optogenetic stimulation (TST and SPT: n = 10, 10, 15, and 12, OFT: n = 10, 10, 13, and 12 for WT control, WT ChR2, Itpr2−/− control, and Itpr2−/− ChR2 mice, respectively). Two-way ANOVA followed by Sidak’s multiple comparison test. All data are expressed as means ± SEM. *P < 0.05, **P < 0.01, ***P < 0.001, and ****P < 0.0001.
Fig. 6.
Fig. 6.. Optogenetic activation of mPFC terminals in the Str partially rescues rsFC and depressive-like behaviors.
(A) Schematic showing the virus injection and optical fiber implantation. (B) Confocal images demonstrate ChR2 expression in mPFC projection to Str. Red, ChR2-mCherry; blue, DAPI. Scale bars, 500 μm (left) and 50 μm (right). (C) Schematic of optogenetic fMRI scan paradigm. Pre, pre-stimulation; Post, post-stimulation. (D) Effect size matrix showing effect of optogenetic stimulation on ipsilateral rsFC within depression-related networks of ChR2-expressing mice (n = 12; bottom-left part) and control mice (n = 10; top-right part). (E) Effect size schematic diagram of ipsilateral rsFC of ChR2-expressing mice. (F to I) Quantitative analyses of ipsilateral mPFC-Str, mPFC-AMY, Hb-SsCx, and Ant-AMY rsFC before and after optogenetic stimulation. Two-way ANOVA with Sidak’s multiple comparison test. (J) Experimental timeline for behavioral tests. (K to M) Behavioral performances of Itpr2−/− and WT mice in TST (n = 11, 11, 11, and 12 for WT control, WT ChR2, Itpr2−/− control, and Itpr2−/− ChR2 mice, respectively), SPT (n = 11 mice in each group), and OFT (n = 11, 11, 11, and 12 for WT control, WT ChR2, Itpr2−/− control, and Itpr2−/− ChR2 mice, respectively) after optogenetic activation of mPFC-Str projection. Two-way ANOVA followed by Sidak’s multiple comparison test. All data are expressed as means ± SEM. *P < 0.05, **P < 0.01, ***P < 0.001, and ****P < 0.0001. (N and O) Average resting-state correlation maps of ipsilateral mPFC before and after optogenetic activation of mPFC-Str projection.

References

    1. Kessler R. C., Berglund P., Demler O., Jin R., Koretz D., Merikangas K. R., Rush A. J., Walters E. E., Wang P. S.; National Comorbidity Survey Replication , The epidemiology of major depressive disorder: Results from the National Comorbidity Survey Replication (NCS-R). JAMA 289, 3095–3105 (2003). - PubMed
    1. Spellman T., Liston C., Toward circuit mechanisms of pathophysiology in depression. Am. J. Psychiatry 177, 381–390 (2020). - PMC - PubMed
    1. Castren E., Is mood chemistry? Nat. Rev. Neurosci. 6, 241–246 (2005). - PubMed
    1. Fox M. D., Raichle M. E., Spontaneous fluctuations in brain activity observed with functional magnetic resonance imaging. Nat. Rev. Neurosci. 8, 700–711 (2007). - PubMed
    1. Biswal B., Yetkin F. Z., Haughton V. M., Hyde J. S., Functional connectivity in the motor cortex of resting human brain using echo-planar MRI. Magn. Reson. Med. 34, 537–541 (1995). - PubMed

LinkOut - more resources