. 2022 Nov 16;14(671):eabo3445.
doi: 10.1126/scitranslmed.abo3445. Epub 2022 Nov 16.

Diet-derived metabolites and mucus link the gut microbiome to fever after cytotoxic cancer treatment

Affiliations

Diet-derived metabolites and mucus link the gut microbiome to fever after cytotoxic cancer treatment

Zaker I Schwabkey et al. Sci Transl Med. .

Abstract

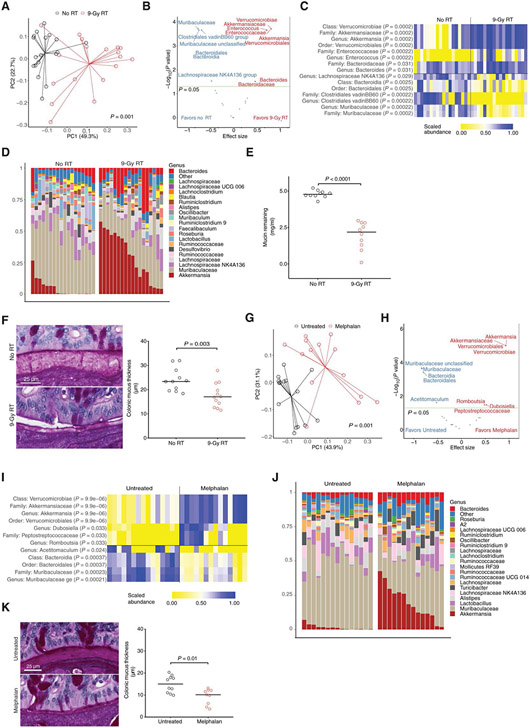
Not all patients with cancer and severe neutropenia develop fever, and the fecal microbiome may play a role. In a single-center study of patients undergoing hematopoietic cell transplant (n = 119), the fecal microbiome was characterized at onset of severe neutropenia. A total of 63 patients (53%) developed a subsequent fever, and their fecal microbiome displayed increased relative abundances of Akkermansia muciniphila, a species of mucin-degrading bacteria (P = 0.006, corrected for multiple comparisons). Two therapies that induce neutropenia, irradiation and melphalan, similarly expanded A. muciniphila and additionally thinned the colonic mucus layer in mice. Caloric restriction of unirradiated mice also expanded A. muciniphila and thinned the colonic mucus layer. Antibiotic treatment to eradicate A. muciniphila before caloric restriction preserved colonic mucus, whereas A. muciniphila reintroduction restored mucus thinning. Caloric restriction of unirradiated mice raised colonic luminal pH and reduced acetate, propionate, and butyrate. Culturing A. muciniphila in vitro with propionate reduced utilization of mucin as well as of fucose. Treating irradiated mice with an antibiotic targeting A. muciniphila or propionate preserved the mucus layer, suppressed translocation of flagellin, reduced inflammatory cytokines in the colon, and improved thermoregulation. These results suggest that diet, metabolites, and colonic mucus link the microbiome to neutropenic fever and may guide future microbiome-based preventive strategies.


Figures

Figure 1.
Figure 1.. Mucin-degrading intestinal bacteria are associated with development of fever after onset of post-HCT neutropenia.
Intestinal microbiome parameters at neutropenia onset and subsequent fever were evaluated in a cohort of patients undergoing HCT. Stool samples were collected at onset of neutropenia (+/− 2 days), and fever outcome was determined by inpatient monitoring every 4 hours in the subsequent 4 days after collection. A) Principal Coordinates of Analysis (PCoA) was performed on weighted UniFrac distances based on 16S rRNA gene sequencing. Statistical significance was determined by permutational MANOVA testing. B) Volcano plot of bacterial taxa that were differentially abundant in A). Taxa above the green line have a p value less than 0.05; p values were adjusted for multiple comparisons using the Benjamini-Hochberg method. C) Relative abundances of bacteria at the genus level in samples from A) are indicated in stacked bar graphs. D) Relative abundances of bacteria of the indicated taxa are depicted for samples from A); p values were adjusted for multiple comparisons. E) Mucin glycan consumption by frozen aliquots of stool samples in A) was assayed. Fecal bacteria were cultivated in liquid media supplemented with porcine gastric mucin as the predominant source of carbon, followed by quantification of remaining mucin glycans after 48 hours. Samples were stratified by median sum relative abundance of Akkermansia and Bacteroides. Statistical significance was determined by the Mann-Whitney U test. F) In the subset of patients who later developed neutropenic fever, relative abundances of bacteria from the indicated taxa in stool samples collected at onset of neutropenia were compared to results of a baseline stool sample collected earlier in the hospitalization, using the Wilcoxon signed-rank test.
Figure 2.
Figure 2.. Systemic cytotoxic therapy increases the relative abundance of mucin-degrading intestinal bacteria in mice.
Evaluation of intestinal microbiome parameters was performed in adult C57BL/6 female mice 6 days after total body radiotherapy (9 Gy RT, panels A-E) or 6 days after melphalan therapy (20 mg/kg, panels G-K). A) After 9 Gy RT, PCoA was performed on weighted UniFrac distances; combined results of 3 experiments. Statistical significance was determined by permutational MANOVA testing. B) Volcano plot of bacterial taxa that were differentially abundant in A); p values were adjusted for multiple comparisons using the Benjamini-Hochberg method. C) Heatmap of scaled relative bacterial relative abundances of the indicated taxa are depicted for samples from A). D) Relative abundances of bacteria at the genus level in samples from A) are indicated in stacked bar graphs. E) Bacteria from frozen stool samples collected from mice in A) were evaluated for mucin glycan consumption; combined results of 2 experiments. Statistical significance was determined by the Mann-Whitney U test. F) Thickness of the dense inner colonic mucus layer was evaluated histologically in mice in A). Representative images are provided with combined results of 3 experiments. Statistical significance was determined by the Mann-Whitney U test. G) After melphalan therapy, PCoA was performed on weighted UniFrac distances; combined results of 3 experiments. Statistical significance was determined by permutational MANOVA testing. H) Volcano plot of bacterial taxa that were differentially abundant in G); p values were adjusted for multiple comparisons using the Benjamini-Hochberg method. I) Heat map of scaled relative bacterial relative abundances of the indicated taxa are depicted for samples from G). J) Relative abundances of bacteria at the genus level in samples from G) are indicated in stacked bar graphs. K) Thickness of the dense inner colonic mucus layer was evaluated histologically in mice in G). Representative images are provided with combined results of 2 experiments. Statistical significance was determined by the Mann-Whitney U test.
Figure 3.
Figure 3.. Caloric restriction increases the relative abundance of mucin-degrading intestinal bacteria in mice.
A) After 9 Gy RT, mice were individually housed in metabolic cages and monitored daily for food consumption, water consumption, and weight. Statistical significance was determined by the Mann-Whitney U test. B) Intestinal microbiome parameters were evaluated in normal mice after undergoing caloric restriction (2 g/mouse/day) for one week. PCoA was performed on weighted UniFrac distances; combined results of 3 experiments. Statistical significance was determined by permutational MANOVA testing. C) Volcano plot of bacterial taxa that were differentially abundant in B); p values were adjusted for multiple comparisons using the Benjamini-Hochberg method. D) Heat map of scaled relative bacterial relative abundances of the indicated taxa are depicted for samples from B). E) Relative abundances of bacteria at the genus level in samples from A) are indicated in stacked bar graphs. F) Bacteria from frozen stool samples collected from mice in B) were evaluated for mucin glycan consumption; combined results of 2 experiments. Statistical significance was determined by the Mann-Whitney U test. G) Thickness of the dense inner colonic mucus layer was evaluated histologically in mice in B). Representative images are provided with combined results of 3 experiments. Statistical significance was determined by the Mann-Whitney U test. H) Experimental schema. Mice underwent caloric restriction as in B), with the addition of narrow-spectrum antibiotics administered in the drinking water starting 5 days prior to onset of restriction. I) Relative abundances of bacteria at the genus level in samples are indicated in stacked bar graphs; combined results of 2 experiments. J) Thickness of the dense inner colonic mucus layer was evaluated histologically in mice in I). Representative images are provided with combined results of 2 experiments. Statistical significance was determined by the Mann-Whitney U test.
Figure 4.
Figure 4.. A) Experimental schema.
Mice were pre-treated with tetracycline administered in the drinking water for 21 days to clear the intestines of A. muciniphilia. A murine isolate of A. muciniphila (MDA-JAX AM001) was re-introduced 5 days before the onset of restriction. B) Relative abundances of Akkermansia on day 7 after CR was quantified by 16S rRNA gene sequencing. Combined results of 4 experiments. Statistical significance was determined by the Mann-Whitney U test. C) Thickness of the dense inner colonic mucus layer was evaluated histologically in mice in B). Statistical significance was determined by the Mann-Whitney U test.
Figure 5.
Figure 5.. Bacterial metabolites link caloric restriction to mucolytic bacteria.
A) In mice that underwent one week of caloric restriction, cecal luminal contents were assessed for caloric content by bomb calorimetry; combined results of 2 experiments. B) Colonic luminal contents were assessed for pH in mice after one week of caloric restriction; combined results of 3 experiments. C) Metabolites from samples in B) were quantified using ion chromatography-mass spectrometry (IC-MS); combined results of 2 experiments. D) Murine A. muciniphila (MDA-JAX AM001) was cultivated under anaerobic conditions of varying pH in 4 replicates, and growth and mucin glycan consumption were quantified after 48 hours of culture; results of one of two experiments with similar results. p < 0.0001, growth of A. muciniphila at pH 5.0 vs. pH 6.75; p = 0.03, mucin degradation at pH 5.0 vs. pH 6.75. E) Murine A. muciniphila (MDA-JAX AM001) was cultivated under varying pH and varying concentrations of sodium acetate, sodium propionate, and sodium butyrate in 4 replicates, and mucin glycan consumption was quantified after 48 hours of culture; results of one of two experiments with similar results. pH 6.8: P = 0.03, 0 mM vs. 5 & 10 mM propionate; P = NS, 0 mM vs. 2.5 mM propionate; P = NS, 0 mM vs. 2.5, 5, and 10 mM acetate and butyrate. F) Murine A. muciniphila (MDA-JAX AM001) was cultivated with varying concentrations of sodium acetate, sodium propionate, and sodium butyrate. Mucin glycan consumption was quantified after 24 hours of culture. Values are shown as averages; results of 3 experiments. P = 0.002, 0 mM vs. 10- and 20-mM propionate; P = NS, 0 mM vs. 10 and 20 mM acetate and butyrate. G) Murine A. muciniphila was cultivated with SCFAs as in F). Growth was monitored continuously up to 48 hours. Values are shown as averages; results of one of two experiments with similar results; H) Normal mice received one week of caloric restriction, as well as supplementation with sodium acetate or sodium propionate in the drinking water, acidified to pH3. Relative abundances of Akkermansia was quantified by 16S rRNA gene sequencing; combined results of 3 experiments. I) Thickness of the dense inner colonic mucus layer was evaluated histologically in mice in F). Representative images are provided with combined results of 3 experiments.
Figure 6.
Figure 6.
Propionate suppresses L-fucose utilization by A. muciniphilia. A) Transcriptomic profiling identifies A. muciniphila (MDA-JAX AM001) genes similarly regulated by diet in vivo and propionate in vitro. RNA sequencing was performed on murine A. muciniphila cultivated at pH 6.8 with varying concentrations of sodium propionate (as in Figure 5E) in 3 replicates (left panel), and on fecal pellets from mice after one week of dietary restriction (n=5, right panel). Sequences aligning with the genome of murine A. muciniphila were quantified, and the scaled abundances of the subset of genes similarly regulated by diet and propionate are depicted in the heat map, along with annotations obtained using both the CAZy and NCBI RefSeq Protein databases. B) Relative abundance of fucose isomerase gene (A) and MFS transporter gene obtained by RNA sequencing performed on murine A. muciniphila cultivated at pH 6.8 with varying concentrations of sodium propionate. C) Murine A. muciniphila was cultivated in carbohydrate-poor BYEM10 media with and without L-fucose supplementation. Growth was monitored continuously up to 72 hours. D) Murine A. muciniphila was cultivated with fucose and varying concentrations of sodium acetate, sodium propionate, and sodium butyrate. Growth was monitored continuously up to 72 hours. Values are shown as averages; results from 3 experiments. E) Murine A. muciniphila was cultivated with fucose and varying concentrations of sodium acetate, sodium propionate, and sodium butyrate. Fucose remaining was quantified after 40 hours of culture. Values are shown as averages; results of 3 experiments. F) Schematic diagram for the conversion of L-fucose to L-fuculose mediated by L-fucose isomerase (Left panel). (Center and right panel) In vitro enzymatic activity of L-fucose isomerase from murine A. muciniphila grown in mucin with or without propionate. L-fucose remaining and L-fuculose generated was quantified after a 1-hour incubation. Values are shown as averages; results of 3 experiments. L-fuculose concentrations were normalized to median L-fuculose concentration of the Akkermansia lysate group. Statistical significance for each graphical data set was determined by the Mann-Whitney U test.
Figure 7.
Figure 7.. Strategies targeting mucolytic bacteria in mice receiving RT preserve colonic mucus, reduce hypothermia, and reduce colonic inflammation.
In the setting of 9 Gy RT, mice were treated with azithromycin or sodium propionate. A) Relative abundances of Akkermansia on day 6 after RT was quantified by 16S rRNA gene sequencing. Combined results of 3 experiments. Statistical significance was determined by the Mann-Whitney U test. B) Thickness of the dense inner colonic mucus layer was evaluated histologically. Representative images are provided with combined results of 2 experiments. Statistical significance was determined by the Mann-Whitney U test. C) Serum flagellin concentrations were quantified on day 6 after RT. Statistical significance was determined by the Mann-Whitney U test. D) On day 6 after RT, mice were harvested, and colonic tissues were processed to quantify concentrations of cytokines. Combined results of 3 experiments. Statistical significance was determined by the Mann-Whitney U test. E) Ocular temperatures were monitored daily. Representative images 6 days after RT are provided with combined results of 2 experiments. Statistical significance was determined by the Mann-Whitney U test. F) Quantification of the correlation between flagellin concentrations and ocular temperature on day 6 after RT by Pearson coefficient.

References

    1. Kuderer NM, Dale DC, Crawford J, Cosler LE, Lyman GH, Mortality, morbidity, and cost associated with febrile neutropenia in adult cancer patients. Cancer 106, 2258–2266 (2006); published online EpubMay 15 (10.1002/cncr.21847). - DOI - PubMed
    1. Tai E, Guy GP, Dunbar A, Richardson LC, Cost of Cancer-Related Neutropenia or Fever Hospitalizations, United States, 2012. J Oncol Pract 13, e552–e561 (2017); published online EpubJun (10.1200/JOP.2016.019588). - DOI - PMC - PubMed
    1. Taplitz RA, Kennedy EB, Bow EJ, Crews J, Gleason C, Hawley DK, Langston AA, Nastoupil LJ, Rajotte M, Rolston KV, Strasfeld L, Flowers CR, Antimicrobial Prophylaxis for Adult Patients With Cancer-Related Immunosuppression: ASCO and IDSA Clinical Practice Guideline Update. J Clin Oncol 36, 3043–3054 (2018); published online EpubOct 20 (10.1200/JCO.18.00374). - DOI - PubMed
    1. Bodey GP, The changing face of febrile neutropenia-from monotherapy to moulds to mucositis. Fever and neutropenia: the early years. J Antimicrob Chemother 63 Suppl 1, i3–13 (2009); published online EpubMay (10.1093/jac/dkp074). - DOI - PubMed
    1. Freifeld AG, Bow EJ, Sepkowitz KA, Boeckh MJ, Ito JI, Mullen CA, Raad II, Rolston KV, Young JA, Wingard JR, Infectious A Diseases Society of, Clinical practice guideline for the use of antimicrobial agents in neutropenic patients with cancer: 2010 update by the infectious diseases society of america. Clinical infectious diseases : an official publication of the Infectious Diseases Society of America 52, e56–93 (2011); published online EpubFeb 15 (10.1093/cid/cir073). - DOI - PubMed

Publication types