. 2022 Nov 16;14(671):eabl5849.
doi: 10.1126/scitranslmed.abl5849. Epub 2022 Nov 16.

Visualization of exhaled breath metabolites reveals distinct diagnostic signatures for acute cardiorespiratory breathlessness

Affiliations

Visualization of exhaled breath metabolites reveals distinct diagnostic signatures for acute cardiorespiratory breathlessness

Wadah Ibrahim et al. Sci Transl Med. .

Abstract

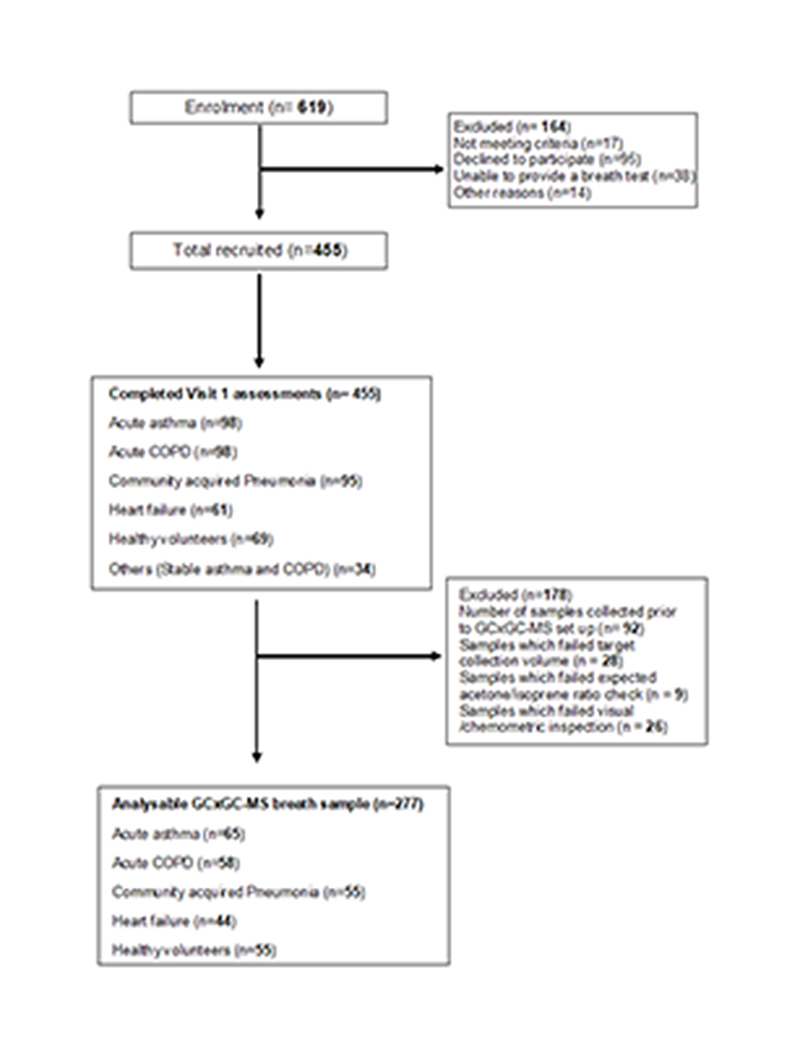
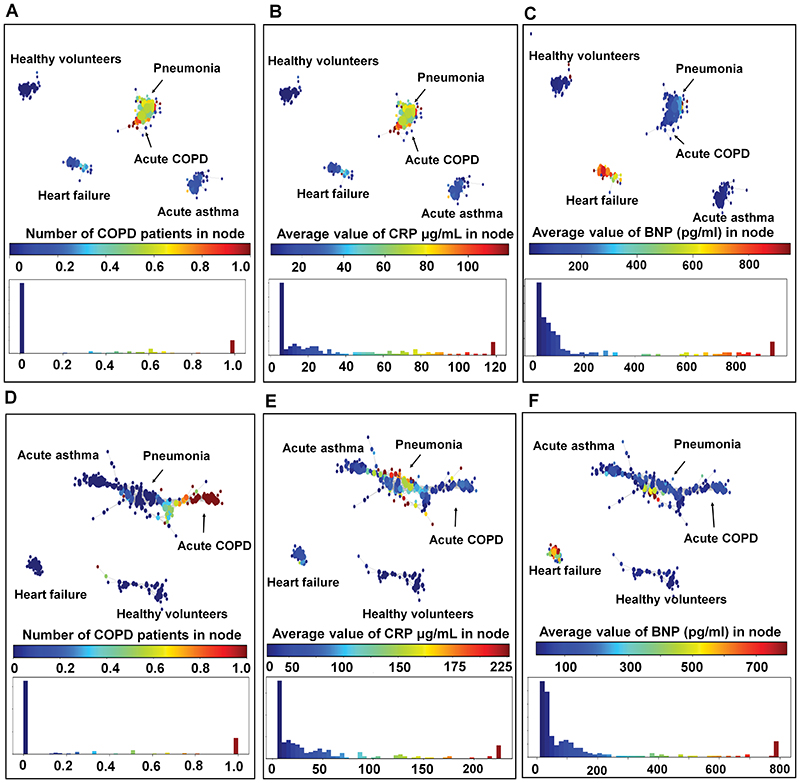
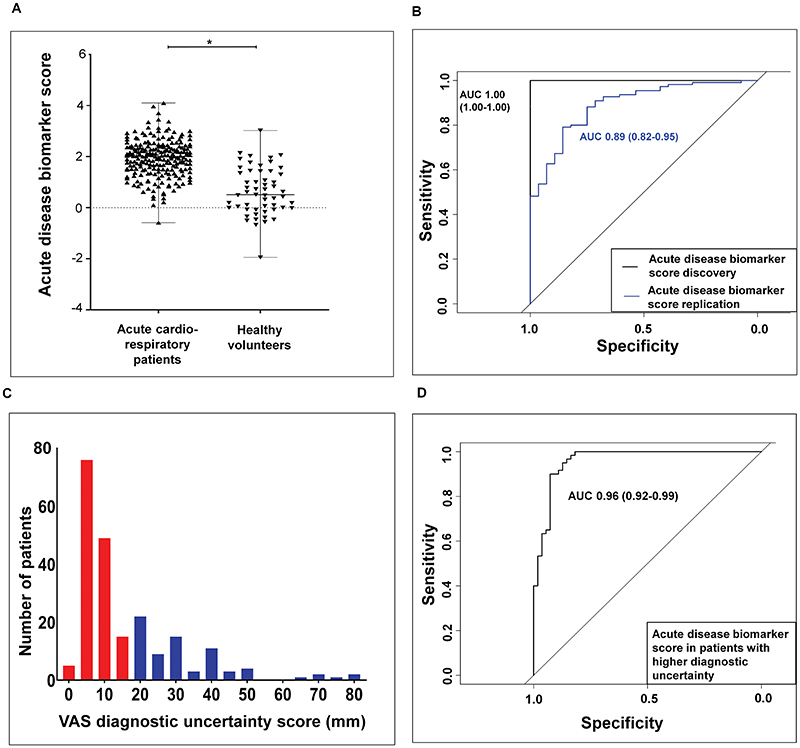
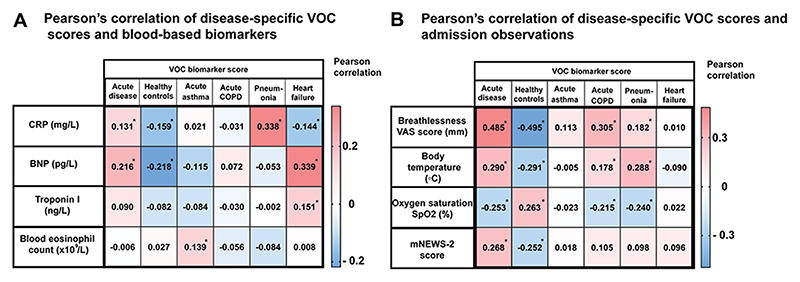
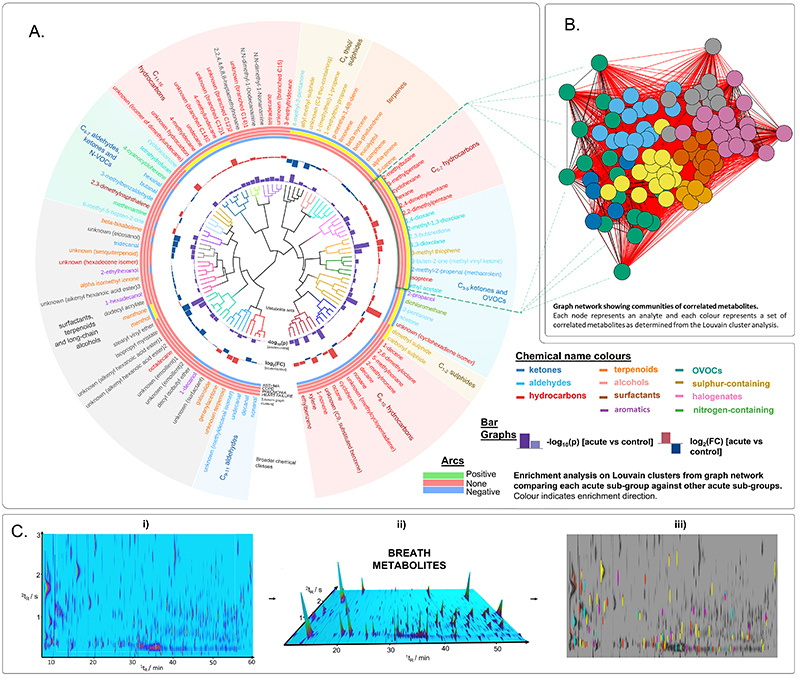
Acute cardiorespiratory breathlessness accounts for one in eight of all emergency hospitalizations. Early, noninvasive diagnostic testing is a clinical priority that allows rapid triage and treatment. Here, we sought to find and replicate diagnostic breath volatile organic compound (VOC) biomarkers of acute cardiorespiratory disease and understand breath metabolite network enrichment in acute disease, with a view to gaining mechanistic insight of breath biochemical derangements. We collected and analyzed exhaled breath samples from 277 participants presenting acute cardiorespiratory exacerbations and aged-matched healthy volunteers. Topological data analysis phenotypes differentiated acute disease from health and acute cardiorespiratory exacerbation subtypes (acute heart failure, acute asthma, acute chronic obstructive pulmonary disease, and community-acquired pneumonia). A multibiomarker score (101 breath biomarkers) demonstrated good diagnostic sensitivity and specificity (≥80%) in both discovery and replication sets and was associated with all-cause mortality at 2 years. In addition, VOC biomarker scores differentiated metabolic subgroups of cardiorespiratory exacerbation. Louvain clustering of VOCs coupled with metabolite enrichment and similarity assessment revealed highly specific enrichment patterns in all acute disease subgroups, for example, selective enrichment of correlated C5-7 hydrocarbons and C3-5 carbonyls in heart failure and selective depletion of correlated aldehydes in acute asthma. This study identified breath VOCs that differentiate acute cardiorespiratory exacerbations and associated subtypes and metabolic clusters of disease-associated VOCs.


Conflict of interest statement

Competing interests

C.E.B. has received consultancy and or grants paid to his Institution from GlaxoSmithKline (GSK), Astrazeneca (AZ), Boehringer Ingelheim (BI), Novartis, Chiesi,Genentech, Roche, Sanofi, Regeneron, TEVA Pharmaceuticals, MSD, Mologic, CSL Behring, Gossamer and 4Dpharma. SS has received funding from the MRC/EPSRC and University of Leicester for the research program presented in the manuscript. S.S. has engaged in consultancies/received speaker fees related to asthma, COPD, lung physiology and eosinophilic airway diseases from the following companies: Boehringer Ingelheim, Chiesi, Novartis, GSK, AZ, ERT Medical, Owlstone Medical, CSL Behring, Mundipharma, Knopp biotech. The rest of the co-authors have no competing interests to declare. E.G reports consultancy work for Boehringer Ingelheim with money paid to the institution (University of Leicester); Investigator led research grant from Circassia Group, Gilead Sciences, Chiesi Limited and Propeller Health; Research collaboration with Medimmune and Adherium (NZ) Limited; and speaker fees Circassia Group. The work presented in this paper has been filed by S.S, R.C, M.W, C.E.B, D.S, and P.T as part of UK Patent Application No. 2110365.0 and International Patent Application No. PCT/GB2022/051858.

Figures

Fig. 1
Fig. 1. Study Consort diagram.
Consort diagram outlining the acute study recruitment and number of analysable GCxGC-MS breath samples.
Fig. 2
Fig. 2. Topological data analysis (TDA) representing the various acute disease groups annotated by blood biomarkers.
Each circle or ‘node’ in the TDA graph represents a subject or group of subjects. Similar subjects are grouped together in the same node and the relative similarity of the subjects is represented by the proximity of the nodes. The size of each node is determined by the number of subjects within it. A: Visual mapping of the acute disease groups in the discovery cohort (n=139), based on the discriminatory 805 features and coloured by proportion of acute COPD exacerbations in each node. B: The network is colour coded by the average values of CRP in each node in the discovery cohort (n=139). Higher CRP values corresponded topologically with the COPD and pneumonia patients. C: The network is colour coded by the average values of BNP in each node in the discovery cohort (n=139). Higher BNP values corresponded topologically with the heart failure patients. D: The network is coloured by proportion of acute COPD exacerbations in each node in the replication cohort (n=138). In replication cohort, Pneumonia and COPD exacerbation subjects occupied polar ends of the same TDA network. E: The networks are coloured by the average values of CRP in each node. High CRP values corresponded topologically with the pneumonia subjects. F: The networks are coloured by the average values of BNP in each node. High BNP values corresponded topologically with the heart failure subjects.
Fig. 3
Fig. 3. Diagnostic accuracy of an acute VOC biomarker score.
A Scatter plot demonstrating significant difference between breath VOC biomarker score values in acute cardiorespiratory patients compared to healthy volunteers. The black horizontal line within the scatter plot represents the median value of the biomarker score. Mann Whitney test *P < 0.0001. B: Receiver operating characteristic (ROC) curve of participants in the discovery [black line - AUC 1.00 (1.00-1.00)] and replication [blue line - AUC 0.89 (0.82-0.95)] cohorts P < 0.0001. C: Histogram showing the number of patients with higher diagnostic uncertainty (blue bars with values > upper quartile value of 20 mm). D: ROC curve assessing the discriminatory power of exhaled breath VOCs in participants with higher diagnostic uncertainty. AUC 0.96 (0.92-.99) P < 0.0001
Fig. 4
Fig. 4. Correlation of VOC biomarker score with blood biomarkers and disease acuity.
A: Pearson’s correlation of disease-specific VOC scores and blood-based biomarkers. Pearson correlation demonstrating the positive and negative correlations between breath VOC scores and blood-based biomarkers. *P < 0.05. B: Pearson’s correlation of disease-specific VOC scores and admission observations. Pearson correlation between the VOC biomarker score and admission vital signs. VAS: Visual Analogue Scale (100 mm), participants were asked to rate their breathlessness on a 100 mm VAS on admission.
Fig. 5
Fig. 5. VOC biomarker chemical enrichment in acute cardiorespiratory exacerbations.
A: Circular correlation tree generated based on metabolite set enrichment and chemical similarity analysis of 101 breath volatiles associated with acute breathlessness. Branches depict metabolite sets derived using the ChemRICH; bar graphs portray -log10(p) and log2(fold change) values of 101 features extracted using LASSO regression (table S4) in acute breathlessness compared with control group. The arcs represent the Louvain clusters, derived from the correlation graph (green for upregulated, red for not significant, blue for downregulated according to K-S test result). Chemical names are coloured based on their chemical classification and coloured regions used to summarise broader chemical groups. B: Correlation graph showing metabolite communities identified using Louvain clustering, with the identity and location of the cluster enriched in heart failure projected onto the circular dendrogram. C: i) Example GCxGC chromatogram showing complex profile of breath metabolites; ii) 3D render of chromatogram showing visualisation of breath markers; and iii) phenotypic differences based on features included in the breath biomarker scores (table S9) (yellow, asthma; red, pneumonia; magenta, COPD; cyan, heart failure).

References

    1. Hutchinson A, Pickering A, Williams P, Bland JM, Johnson MJ. Breathlessness and presentation to the emergency department: a survey and clinical record review. BMC Pulmonary Medicine. 2017;17:53. doi: 10.1186/s12890-017-0396-4. published online Epub2017/03/20. - DOI - PMC - PubMed
    1. D. American Thoracic Society Committee on. Parshall MB, Schwartzstein RM, Adams L, Banzett RB, Manning HL, Bourbeau J, Calverley PM, Gift AG, Harver A, Lareau SC, et al. An official American Thoracic Society statement: update on the mechanisms, assessment, and management of dyspnea. American journal of respiratory and critical care medicine. 2012;185:435–452. doi: 10.1164/rccm.201111-2042ST. - DOI - PMC - PubMed
    1. Ibrahim W, Carr L, Cordell R, Wilde MJ, Salman D, Monks PS, Thomas P, Brightling CE, Siddiqui S, Greening NJ. Breathomics for the clinician: the use of volatile organic compounds in respiratory diseases. Thorax. 2021 doi: 10.1136/thoraxjnl-2020-215667. thoraxjnl-2020-215667. - DOI - PMC - PubMed
    1. Schleich FN, Zanella D, Stefanuto PH, Bessonov K, Smolinska A, Dallinga JW, Henket M, Paulus V, Guissard F, Graff S, Moermans C, et al. Exhaled Volatile Organic Compounds are Able to Discriminate between Neutrophilic and Eosinophilic Asthma. Am J Respir Crit Care Med. 2019 doi: 10.1164/rccm.201811-2210OC. published online EpubApr 11. - DOI - PubMed
    1. Wilde MJ, Cordell RL, Salman D, Zhao B, Ibrahim W, Bryant L, Ruszkiewicz D, Singapuri A, Free RC, Gaillard EA, Beardsmore C, et al. Breath analysis by two-dimensional gas chromatography with dual flame ionisation and mass spectrometric detection - Method optimisation and integration within a large-scale clinical study. J Chromatogr A. 2019;1594:160–172. doi: 10.1016/j.chroma.2019.02.001. published online EpubJun 7. - DOI - PMC - PubMed

Publication types