. 2022 Nov 15;3(11):100812.
doi: 10.1016/j.xcrm.2022.100812.

Tissue-specific transcriptional profiles and heterogeneity of natural killer cells and group 1 innate lymphoid cells

Affiliations

Tissue-specific transcriptional profiles and heterogeneity of natural killer cells and group 1 innate lymphoid cells

Noella Lopes et al. Cell Rep Med. .

Abstract

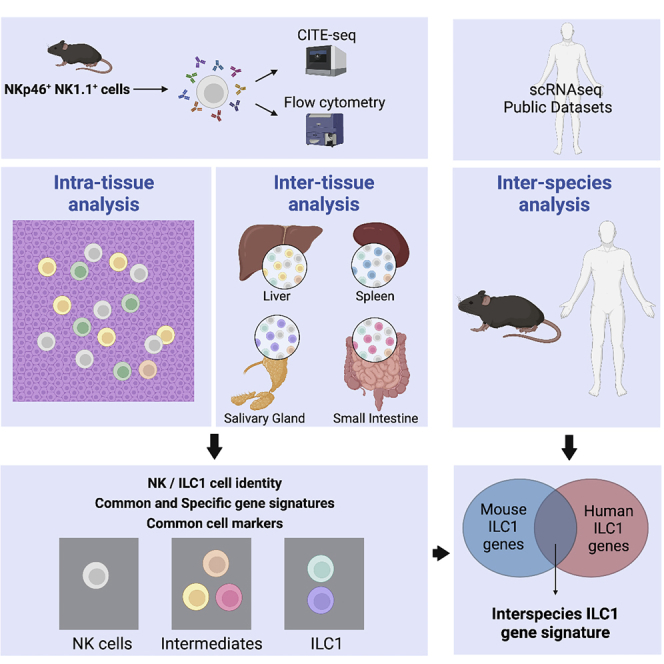
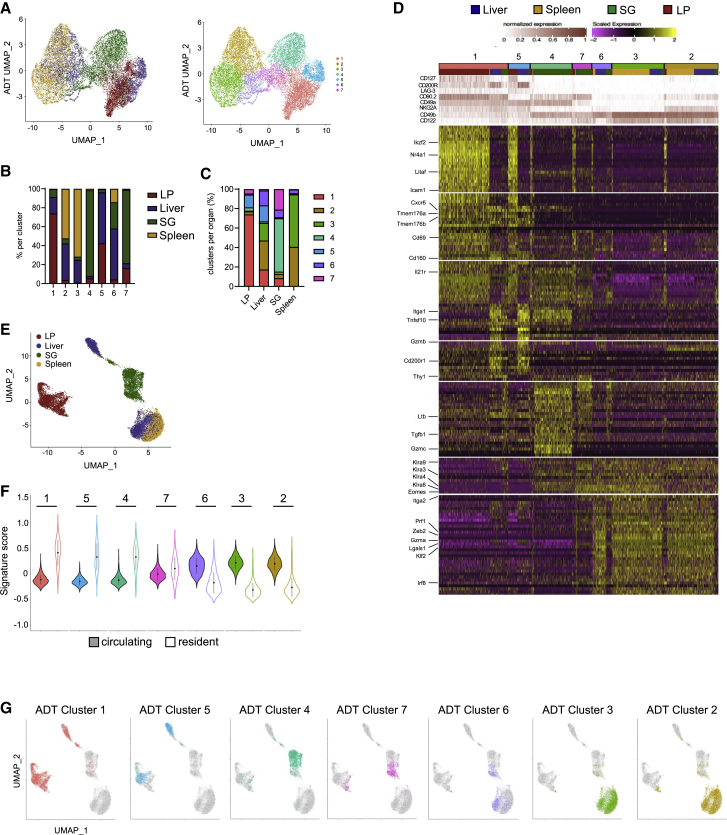
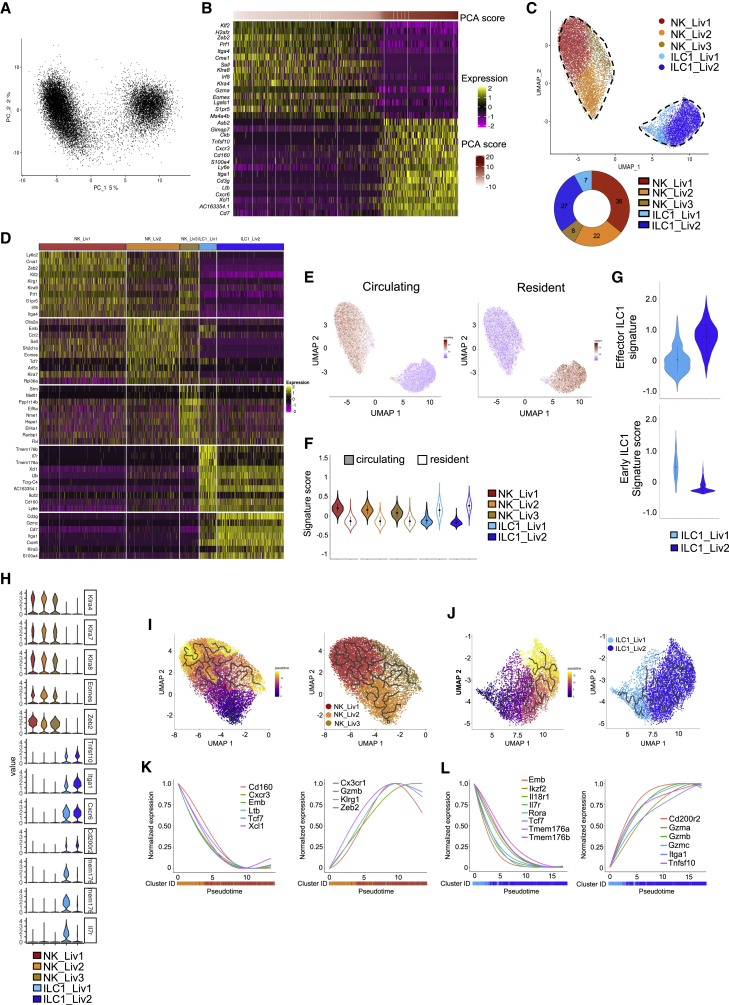
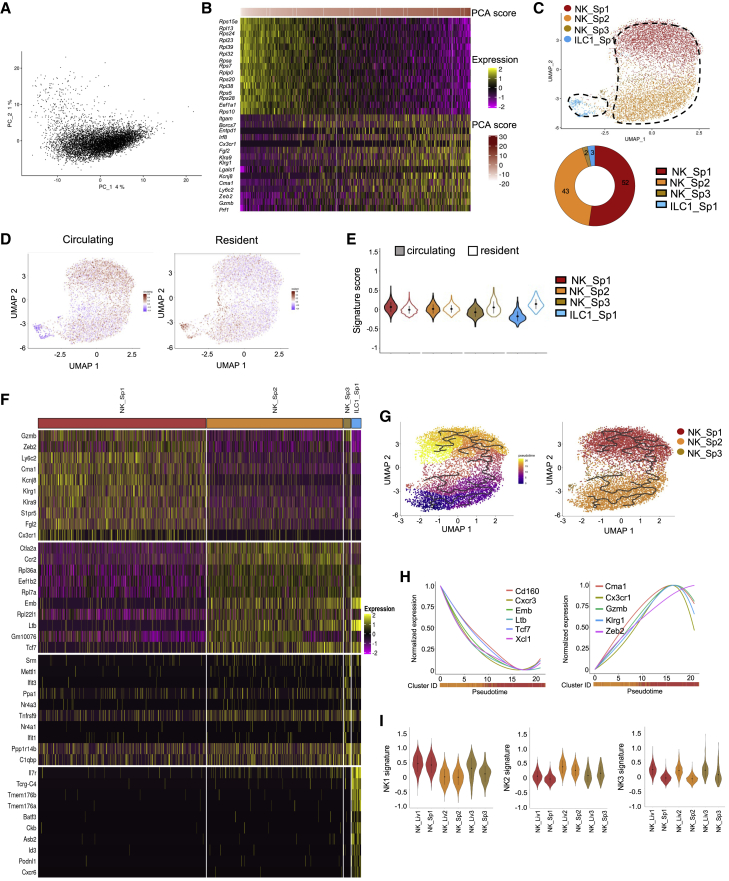
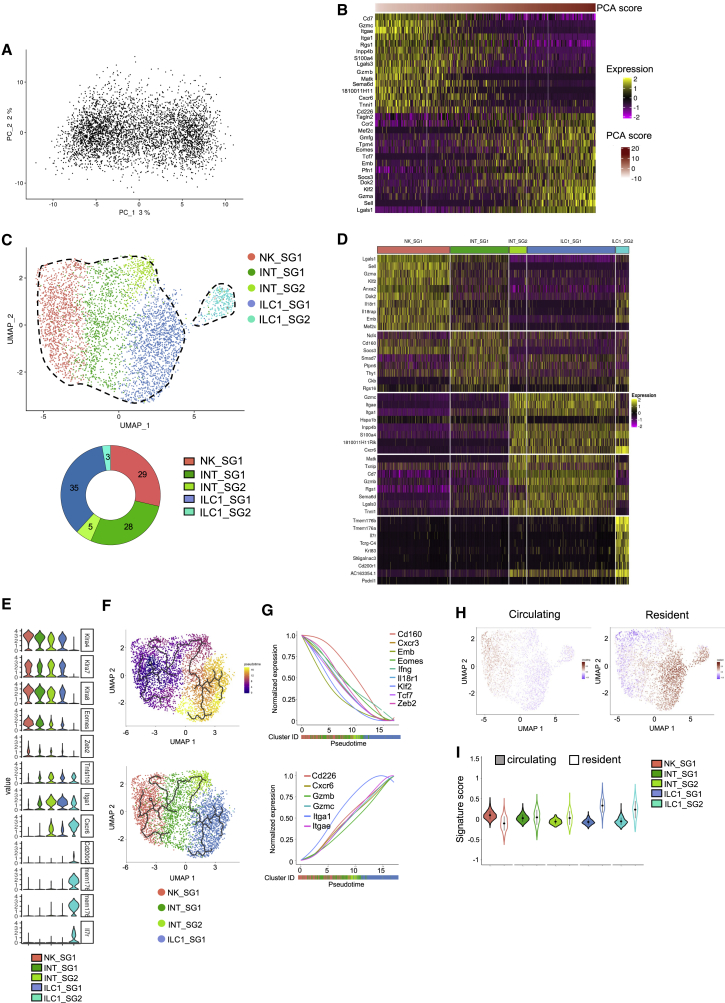
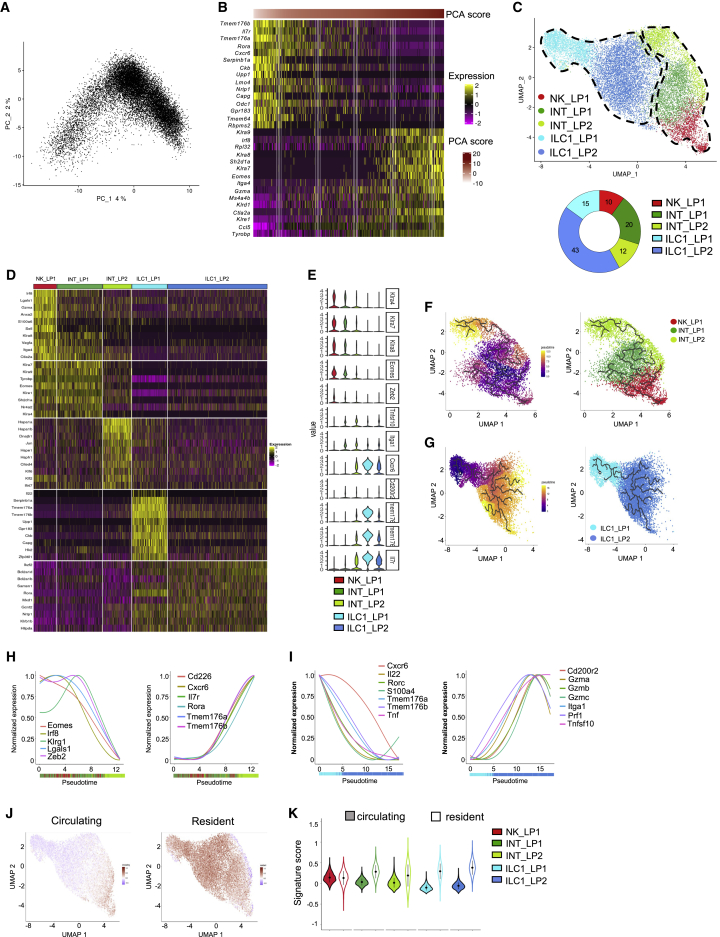
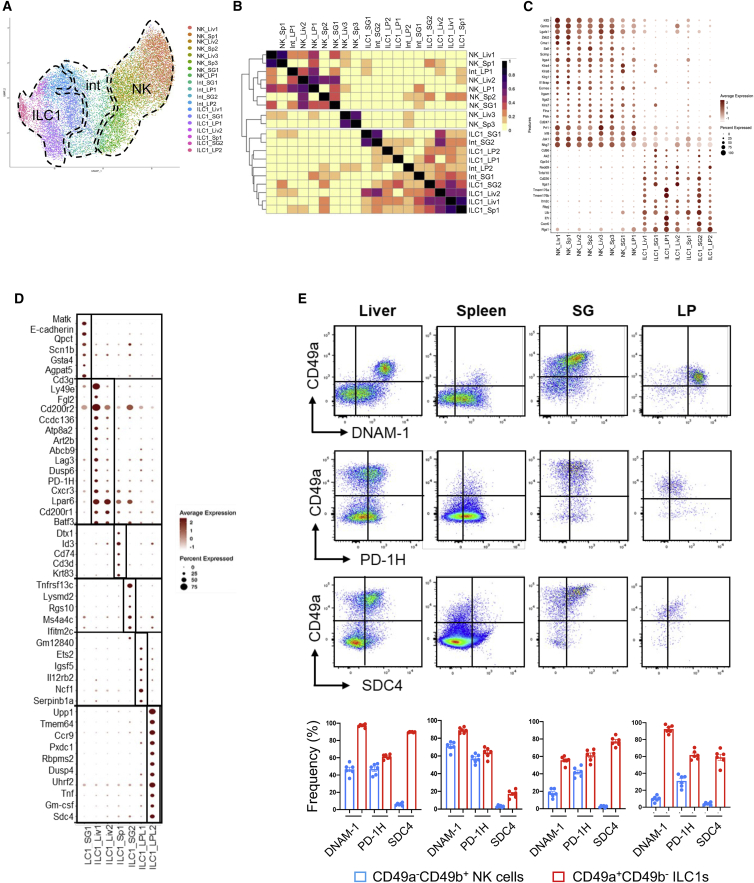
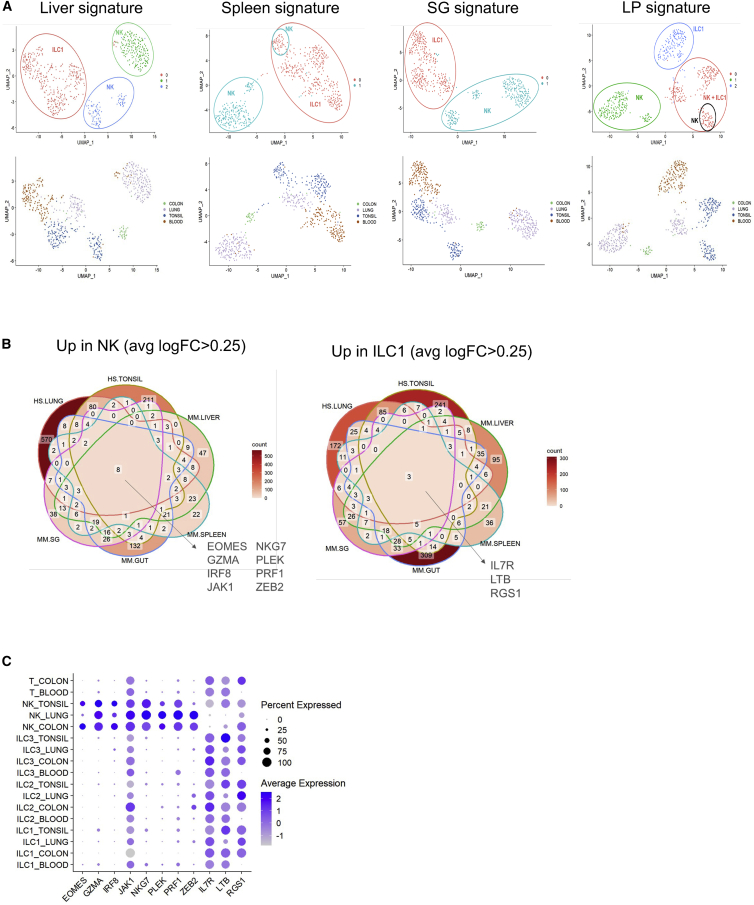
Natural killer (NK) cells and type 1 innate lymphoid cells (ILC1s) are populations of non-T, non-B lymphocytes in peripheral tissues. Although NK and ILC1 subsets have been described, their identification and characteristics remain unclear. We performed single-cell RNA sequencing and CITE-seq to explore NK and ILC1 heterogeneity between tissues. We observed that although NK1 and NK2 subsets are conserved in spleen and liver, ILC1s are heterogeneous across tissues. We identified sets of genes expressed by related subsets or characterizing unique ILC1 populations in each organ. The syndecan-4 appeared as a marker discriminating murine ILC1 from NK cells across organs. Finally, we revealed that the expressions of EOMES, GZMA, IRF8, JAK1, NKG7, PLEK, PRF1, and ZEB2 define NK cells and that IL7R, LTB, and RGS1 differentiate ILC1s from NK cells in mice and humans. Our data constitute an important resource to improve our understanding of NK-ILC1 origin, phenotype, and biology.

Keywords: CITE-seq; ILC1; NK; immunology; innate immunity; innate lymphoid cells; single-cell RNA-seq.


Conflict of interest statement

Declaration of interests E.V. is a cofounder and employee of Innate Pharma. S.C. is an employee of Innate Pharma.

Figures

None
Graphical abstract
Figure 1
Figure 1
Tissue-specific transcriptional profile of ILC1s (A) UMAP showing the clustering of 17,820 NKp46+NK1.1+ cells from the liver, spleen, SG, and lamina propria (LP) on the basis of phenotypic markers from CITE-seq data, annotated by organ (left) and cluster label (right). (B and C) Tissue distribution frequency analysis across phenotypic clusters (B) and representation of clusters by organ (C). (D) Heatmap displaying the top 30 DEGs (bottom) by antibody-based clusters of NKp46+NK1.1+ cells (top) (fold change [FC] > 0.35 and p < 0.05). (E) UMAP of NKp46+NK1.1+ single cells from all organs based on RNA levels. (F) Module score analysis for tissue-resident and circulating lymphocytes; cell transcriptomic signature by cell surface phenotype-based cluster identified in (B) (mean ± SD). (G) Cell surface phenotype-based clusters projected onto an RNA-level-based UMAP.
Figure 2
Figure 2
Different transcriptional features between hepatic NK cell and ILC1 populations (A) Principal-component analysis (PCA) of 16,262 hepatic NKp46+NK1.1+ cells. (B) Heatmap showing the top 15 genes with the lowest or highest PC1 scores, ranked according to their score values. Cells and genes are sorted by principal-component scores. (C) UMAP projection of hepatic NKp46+NK1.1+ cells clustered according to RNA levels. The donut graph shows the percentage of each liver NKp46+NK1.1+ subset identified. (D) Heatmap of the top 10 upregulated DEGs of the identified NKp46+NK1.1+ clusters, ranked by adjusted p value (FC > 0.35 and p < 0.05). (E) UMAP plot overlaid with tissue-resident and circulating lymphocyte signatures. (F) Module score analysis for tissue-resident and circulating lymphocyte signatures for clusters identified in (C) (mean ± SD). (G) Module score analysis of “early” and "effector" ILC1 transcriptomic signatures for the hepatic ILC1 subsets identified in (C) (mean ± SD). (H) Violin plots showing mRNA expression profiles of selected genes across Seurat clusters. (I and J) Left panel: pseudotime analysis of cells included in NK (I) and ILC1 (J) clusters. UMAPs are colored according to pseudotime scores (left) and cell clusters (right). (K and L) Normalized expression of genes along the pseudotime axis calculated for the cells included in NK (K) and ILC1 (L) clusters. Color bars indicate cluster identity.
Figure 3
Figure 3
scRNA-seq identifies liver-like splenic NK cells and one splenic ILC1 subset (A) PCA of 8,062 splenic NKp46+NK1.1+ cells. (B) Heatmap showing the top 15 genes with the lowest or highest PC1 score, ranked according to their score value. (C) UMAP projection of splenic NKp46+NK1.1+ cells clustered on the basis of RNA levels. The donut graph shows the percentage of each spleen NKp46+NK1.1+ subset identified. (D) UMAP plot overlaid with tissue-resident and circulating lymphocyte signatures. (E) Module score analysis of tissue-resident and circulating lymphocyte signature for clusters identified in (C) (mean ± SD). (F) Heatmap of the top 10 upregulated DEGs of identified NKp46+NK1.1+ clusters, ranked by adjusted p value (FC > 0.35 and p < 0.05). (G) Pseudotime analysis of cells included in NK clusters. UMAPs are colored according to pseudotime scores (left) and cell cluster (right). (H) Normalized expression of genes along the pseudotime axis calculated for the cells included in NK cell clusters. Color bars indicate cluster identity. (I) Module score analysis of splenic NK1, NK2, and NK3 transcriptomic signatures for the splenic and hepatic ILC1 subsets identified in (C) (mean ± SD).
Figure 4
Figure 4
Transcriptional heterogeneity among NKp46+NK1.1+ subsets in the salivary glands (A) PCA of 4,455 NKp46+NK1.1+ cells from the SG. (B) Heatmap showing the top 15 genes with the lowest or highest PC1 score, ranked according to their score value. (C) UMAP projection of SG NKp46+NK1.1+ cells clustered on the basis of RNA levels. The donut graph shows the percentage of each of the NKp46+NK1.1+ subsets identified. (D) Heatmap of the top 10 upregulated DEGs of the identified NKp46+NK1.1+ clusters, ranked by adjusted p value (FC > 0.35 and p < 0.05). (E) Violin plots showing mRNA expression profiles of selected genes across Seurat clusters. (F) Pseudotime analysis of cells included in NK clusters. UMAPs are colored according to pseudotime scores (left) and cell cluster (right). (G) Normalized expression of genes along the pseudotime calculated for the cells included in NK and ILC1 clusters. Color bars indicate cluster identity. (H) UMAP plot overlaid with tissue-resident and circulating lymphocyte signatures. (I) Module score analysis for tissue-resident and circulating lymphocyte signature for clusters identified in (C) (mean ± SD).
Figure 5
Figure 5
Transcriptomic analysis reveals that NKp46+NK1.1+ subsets from the LP have unique features (A) PCA of 15,658 NKp46+NK1.1+ cells from the LP. (B) Heatmap showing the top 15 genes with the lowest or highest PC1 score, ranked according to their score value. (C) UMAP projection of NKp46+NK1.1+ cells from the LP clustered on the basis of RNA levels. The donut graph shows the percentage of each LP NKp46+NK1.1+ subset identified. (D) Heatmap of the top 10 upregulated DEGs of the identified NKp46+NK1.1+ clusters, ranked by adjusted p value (FC > 0.35 and p < 0.05). (E) Violin plots showing mRNA expression profiles of selected genes across Seurat clusters. (F and G) Pseudotime analysis of cells included in NK (F) and ILC1 (G) clusters. UMAPs are colored according to pseudotime scores (left) and cell cluster (right). (H and I) Normalized expression of genes along the pseudotime axis calculated for the cells included in NK (H) and ILC1 (I) clusters. Color bars indicate cluster identity. (J) UMAP plot overlaid with tissue-resident and circulating lymphocyte signatures. (K) Module score analysis for tissue-resident and circulating lymphocyte signatures for clusters identified in (C) (mean ± SD).
Figure 6
Figure 6
Inter-tissue-specific signatures of NK and ILC1 subpopulations (A) Transcriptome-based clusters computed for each organ separately, projected onto the multi-organ integrated UMAP obtained with Harmony. (B) Heatmap representing overlap coefficient dissimilarity between transcriptome-based clusters calculated separately for each organ. (C) Dot plot of NK cell-specific versus ILC1-specific markers. Intermediate clusters were not taken into account. (D) Dot plot of specific markers for each cluster. (E) Flow cytometry profiles of CD49a, DNAM-1, PD-1H, and SDC4 expression, analyzed in LinNKp46+NK1.1+ cells. Histograms represent the frequency of CD49aCD49b+ NK cells and CD49a+CD49b ILC1s for each indicated marker across organs. Data are shown as mean ± SEM and are pooled from two independent experiments. Each point represents a pool of two mice.
Figure 7
Figure 7
Transfer murine transcriptomic signatures for human dataset (A) Clustering and UMAP calculated with organ-specific murine orthologous signature. Cells are colored by cluster (upper panel) or by organ (lower panel). (B) Venn diagram displaying cross-species and cross-organ NK or ILC1 signature intersections: HS.LUNG (human signature from lung9), HS.TONSIL (human signature from tonsil9), MM.LIVER (murine signature from liver), MM.SPLEEN (murine signature from spleen), MM.GUT (murine signature from gut), and MM.SG (murine signature from salivary glands). (C) Dot plot of cross-species and cross-organ NK cell-specific and ILC1-specific markers. Dot size encodes the percentage of positive cells and dot intensity the average expression.

References

    1. Vivier E., Artis D., Colonna M., Diefenbach A., Di Santo J.P., Eberl G., Koyasu S., Locksley R.M., McKenzie A.N.J., Mebius R.E., et al. Innate lymphoid cells: 10 Years on. Cell. 2018;174:1054–1066. doi: 10.1016/j.cell.2018.07.017. - DOI - PubMed
    1. Gasteiger G., Fan X., Dikiy S., Lee S.Y., Rudensky A.Y. Tissue residency of innate lymphoid cells in lymphoid and nonlymphoid organs. Science. 2015;350:981–985. doi: 10.1126/science.aac9593. - DOI - PMC - PubMed
    1. Seillet C., Brossay L., Vivier E. Natural killers or ILC1s? That is the question. Curr. Opin. Immunol. 2021;68:48–53. doi: 10.1016/j.coi.2020.08.009. - DOI - PMC - PubMed
    1. Cortez V.S., Cervantes-Barragan L., Robinette M.L., Bando J.K., Wang Y., Geiger T.L., Gilfillan S., Fuchs A., Vivier E., Sun J.C., et al. Transforming growth factor-beta signaling guides the differentiation of innate lymphoid cells in salivary glands. Immunity. 2016;44:1127–1139. doi: 10.1016/j.immuni.2016.03.007. - DOI - PMC - PubMed
    1. Gao Y., Souza-Fonseca-Guimaraes F., Bald T., Ng S.S., Young A., Ngiow S.F., Rautela J., Straube J., Waddell N., Blake S.J., et al. Tumor immunoevasion by the conversion of effector NK cells into type 1 innate lymphoid cells. Nat. Immunol. 2017;18:1004–1015. doi: 10.1038/ni.3800. - DOI - PubMed

Publication types