. 2022 Dec 6;34(12):2036-2046.e8.
doi: 10.1016/j.cmet.2022.10.011. Epub 2022 Nov 15.

Ribosome stalling is a signal for metabolic regulation by the ribotoxic stress response

Affiliations

Ribosome stalling is a signal for metabolic regulation by the ribotoxic stress response

Goda Snieckute et al. Cell Metab. .

Abstract

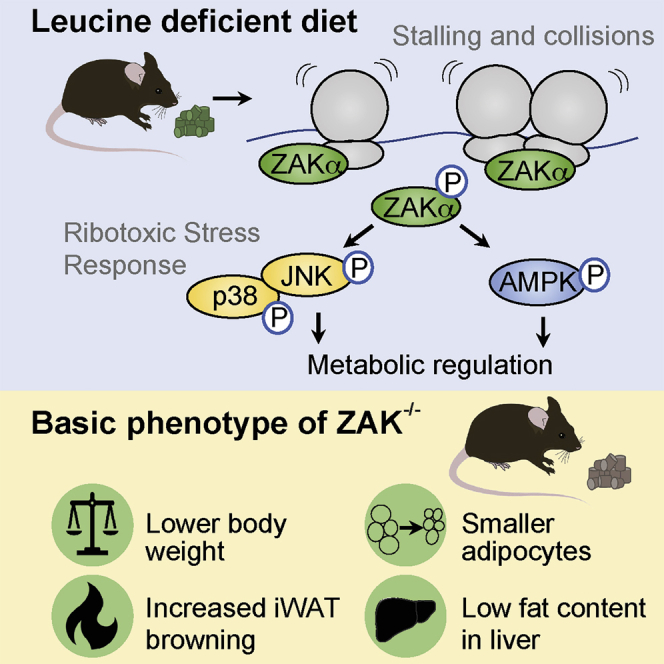
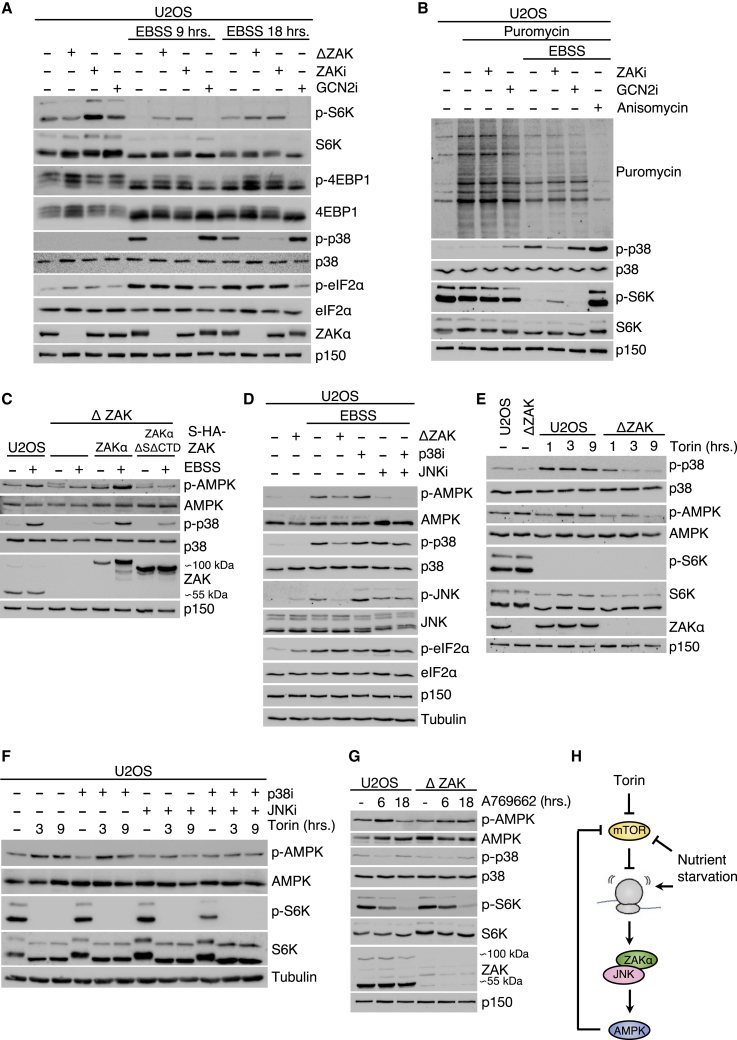
Impairment of translation can lead to collisions of ribosomes, which constitute an activation platform for several ribosomal stress-surveillance pathways. Among these is the ribotoxic stress response (RSR), where ribosomal sensing by the MAP3K ZAKα leads to activation of p38 and JNK kinases. Despite these insights, the physiological ramifications of ribosomal impairment and downstream RSR signaling remain elusive. Here, we show that stalling of ribosomes is sufficient to activate ZAKα. In response to amino acid deprivation and full nutrient starvation, RSR impacts on the ensuing metabolic responses in cells, nematodes, and mice. The RSR-regulated responses in these model systems include regulation of AMPK and mTOR signaling, survival under starvation conditions, stress hormone production, and regulation of blood sugar control. In addition, ZAK-/- male mice present a lean phenotype. Our work highlights impaired ribosomes as metabolic signals and demonstrates a role for RSR signaling in metabolic regulation.

Keywords: AMPK; FGF21; ZAK-alpha; amino acid starvation; mTOR; metabolic regulation; mouse models; ribosome collision; ribotoxic stress response.


Conflict of interest statement

Declaration of interests The authors declare no competing interests.

Figures

None
Graphical abstract
Figure 1
Figure 1
Starvation and amino acid deprivation induce ZAKα-activating ribosome stalls (A) ZAK-dependent phosphorylation of p38 and JNK upon EBSS treatment of U2OS cells. (B) Comparison of different amino acid starvation media (18 h) with respect to phosphorylation of p38, JNK, and eIF2α in U2OS cells. (C) ZAK-dependent phosphorylation of p38, JNK, and eIF2α upon histidinol treatment of U2OS cells. (D) Contribution of ZAK isoforms toward starvation-induced p38 phosphorylation in U2OS cells. (E) Stable rescue of ΔZAK cells with WT and mutated forms of ZAKα and WT ZAKβ. (F) MNase assay to measure ribosome collisions in amino acid starved HeLa cells treated with GCN2 inhibitor (GCN2i) and ASCC3 siRNA as indicated. (G) As in (F), except that cells were incubated in an EBSS medium. (H) Exacerbated ZAK-dependent p38 phosphorylation and appearance of a ribosome collision marker (Ub-RPS10) upon combination of EBSS and GCN2i. (I) Signaling pathways activated at stalled and collided ribosomes induced by starvation and amino acid deprivation. RSR, ribotoxic stress response; RQC, ribosome-associated quality control; ISR, integrated stress response. See also Figures S1 and S2.
Figure 2
Figure 2
Crosstalk between RSR, AMPK, and mTOR signaling (A) ZAK-dependent regulation of the mTOR targets S6K and 4EBP1 upon EBSS treatment of U2OS cells. (B) Puromycin incorporation assay in EBSS-treated U2OS cells. (C) ZAKα-dependent activation of AMPK in EBSS-treated U2OS cells. (D) JNK-dependent activation of AMPK in EBSS-treated U2OS cells. (E) ZAK-dependent activation of AMPK and p38 in U2OS cells treated with the mTOR inhibitor torin. (F) JNK-dependent activation of AMPK in U2OS cells treated with torin. (G) Lack of ZAKα activation by the AMPK-activating compound A769662. (H) Model of cross-regulation between mTOR, AMPK, and the ribotoxic stress response upon nutrient starvation and catalytic mTOR inhibition (torin), respectively. See also Figure S2.
Figure 3
Figure 3
Metabolic regulation by the RSR pathway in model organisms under starvation (A) Schematic of starvation and lifespan experiments with C. elegans nematodes. (B) Survival curves for worms with the indicated genotypes in M9 starvation medium (n = 3 biological replicates for all strains). (C) Schematic of mouse leucine starvation experiment. Mice were acclimatized to a full synthetic diet for 3 weeks and randomly assigned to continued full (n = 5 biological replicates) or leucine-deficient (n = 9 biological replicates) synthetic diet. (D) Phosphorylation of p38, eIF2α, AMPK, and mTOR target 4EBP1 in representative livers from (C). (E) qPCR analysis of FGF21 mRNA levels in livers from (C). (F) ELISA detection of circulating serum levels of FGF21 in mice from (C). (G) Blood glucose concentrations of mice from (C) subjected to ipGTT assay. (H) Area under the curve (AUC) calculated for data in (G). All data are plotted as mean and all error bars represent the SEM (G). x, interaction; ns, non-significant; ∗∗∗p > 0.001 in three-way ANOVA. (E, F, and H) ns, non-significant; p < 0.05; ∗∗p < 0.01; ∗∗∗p > 0.001 in two-way ANOVA. (I) Metagene analysis of ribosome footprint data, showing the predicted A-site distribution around start and stop codons. (J) Analysis of A-site codon occupancy, comparing datasets from Leu-deficient and SD livers. (K) Analysis of global amino acid occupancy changes, comparing datasets from Leu-deficient and SD livers. (L) Predicted footprint A-site density distributions around leucine (Leu), color-coded as in (I). ÷Leu, leucine-deficient diet; SD, full synthetic diet. See also Figures S3 and S4.
Figure 4
Figure 4
ZAK−/− mice present with altered adipose metabolism and a lean phenotype (A) Percentage weight of eWAT, iWAT, and BAT from mice in Figure 3C. (B) Images of representative hematoxylin and eosin (H&E)-stained WAT. (C) Quantification of adipocyte size in WAT from all mice in (B). (D) Representative images of iWAT browning in mice from Figure 3C (H&E staining). (E) H&E (top) and periodic acid shift (PAS) (bottom) staining of liver sections from mice in Figure 3C. Arrows indicate areas of stochastic mild steatosis. (F) Hepatic triglyceride (TG) levels from mice in Figure 3C. (G) qPCR analysis of mRNA levels of beta-oxidation genes ACO, MCAD, and LCAD in livers from mice in Figure 3C. (H) Model of basic and leucine starvation-induced metabolic phenotypes in ZAK−/− mice. ÷Leu, leucine-deficient diet; SD, full synthetic diet. All scale bars, 50 μm. Data are plotted as mean and all error bars represent the SEM. ns, non-significant; p < 0.05; ∗∗p < 0.01; ∗∗∗p > 0.001, ∗∗∗∗p < 0.0001 in two-way ANOVA. See also Figure S4.

References

    1. Goodpaster B.H., Sparks L.M. Metabolic flexibility in health and disease. Cell Metab. 2017;25:1027–1036. doi: 10.1016/j.cmet.2017.04.015. - DOI - PMC - PubMed
    1. Smith R.L., Soeters M.R., Wüst R.C.I., Houtkooper R.H. Metabolic flexibility as an adaptation to energy resources and requirements in health and disease. Endocr. Rev. 2018;39:489–517. doi: 10.1210/er.2017-00211. - DOI - PMC - PubMed
    1. Saxton R.A., Sabatini D.M. MTOR signaling in growth, metabolism, and disease. Cell. 2017;168:960–976. doi: 10.1016/j.cell.2017.02.004. - DOI - PMC - PubMed
    1. Herzig S., Shaw R.J. AMPK: guardian of metabolism and mitochondrial homeostasis. Nat. Rev. Mol. Cell Biol. 2018;19:121–135. doi: 10.1038/nrm.2017.95. - DOI - PMC - PubMed
    1. González A., Hall M.N., Lin S.C., Hardie D.G. AMPK and TOR: the yin and yang of cellular nutrient sensing and growth control. Cell Metab. 2020;31:472–492. doi: 10.1016/j.cmet.2020.01.015. - DOI - PubMed

Publication types

Substances