. 2023 Jan;613(7943):340-344.
doi: 10.1038/s41586-022-05506-2. Epub 2022 Nov 16.

Pathogen spillover driven by rapid changes in bat ecology

Affiliations

Pathogen spillover driven by rapid changes in bat ecology

Peggy Eby et al. Nature. 2023 Jan.

Abstract

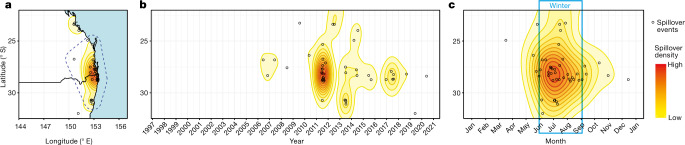
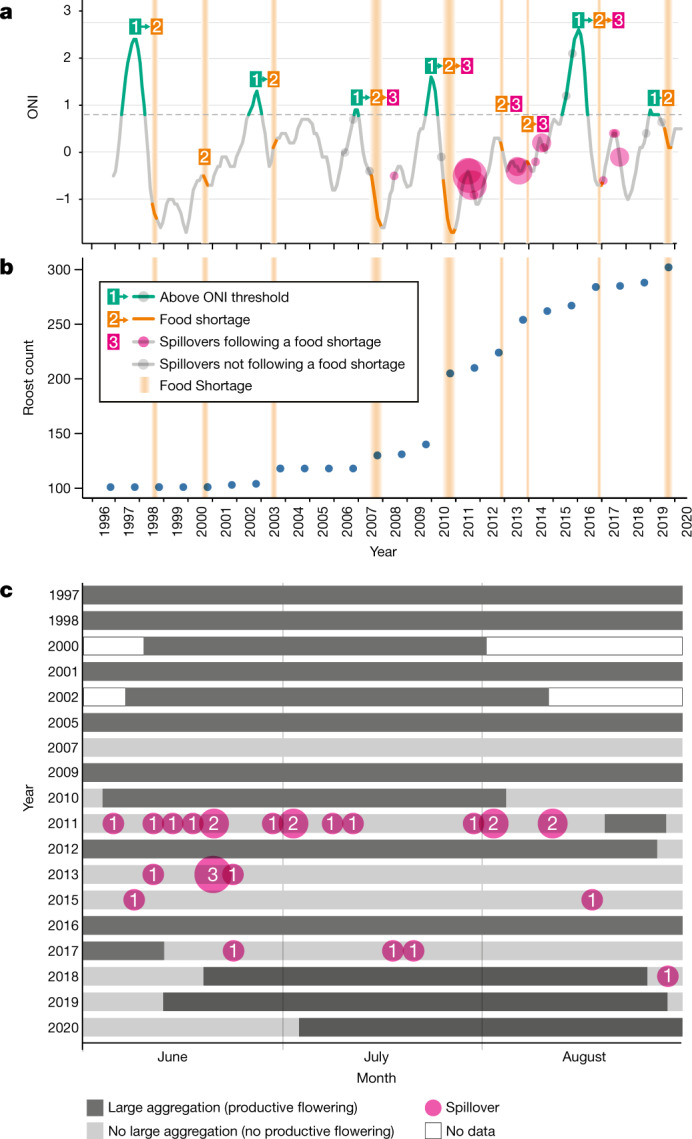
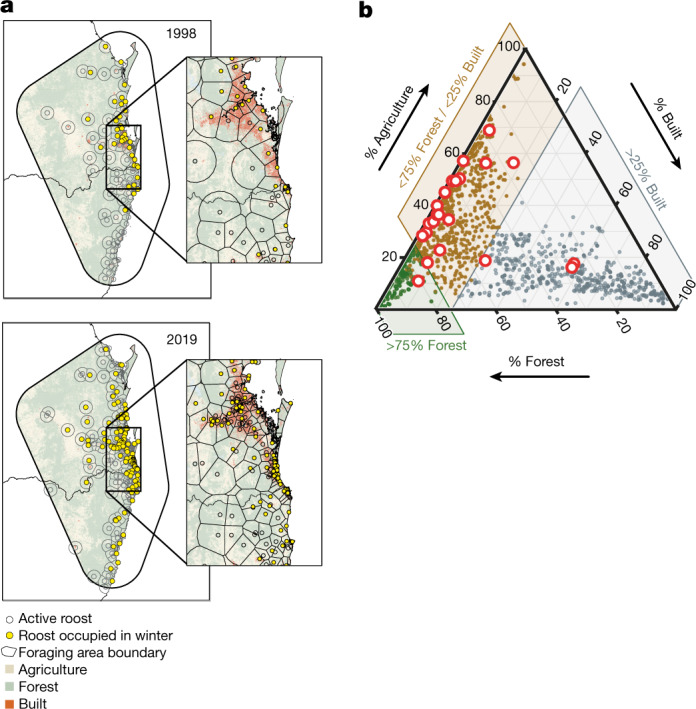
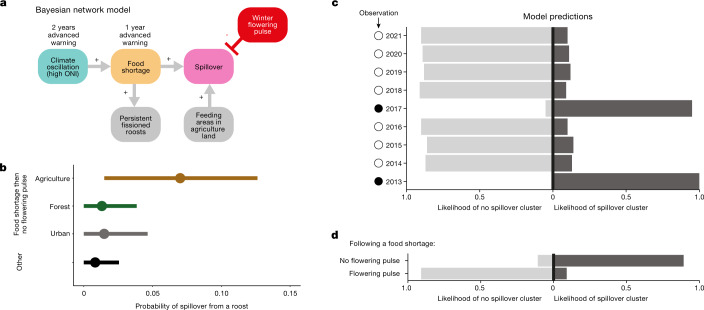
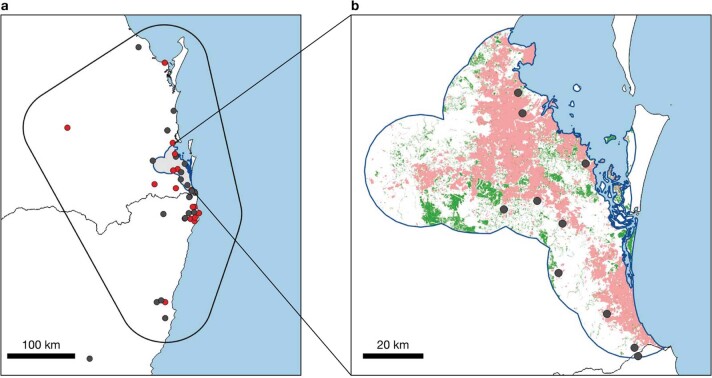
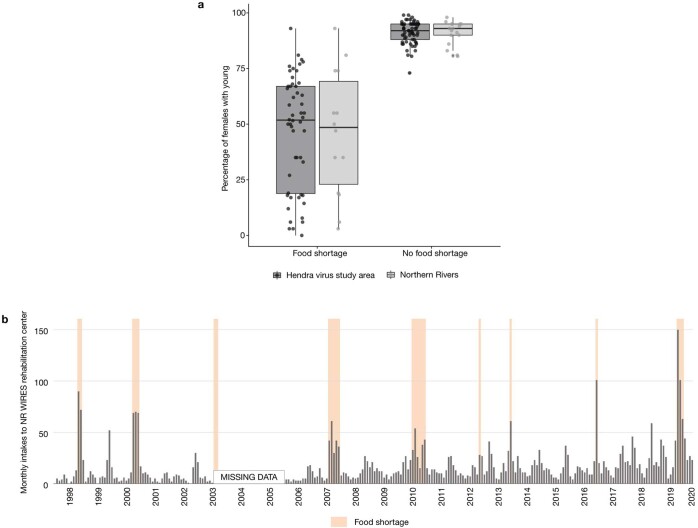
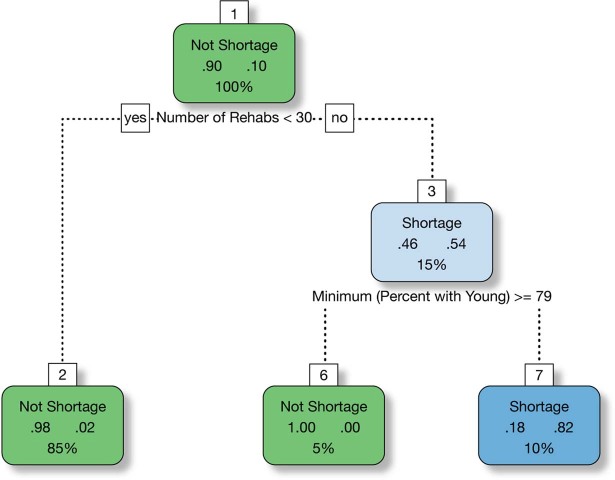
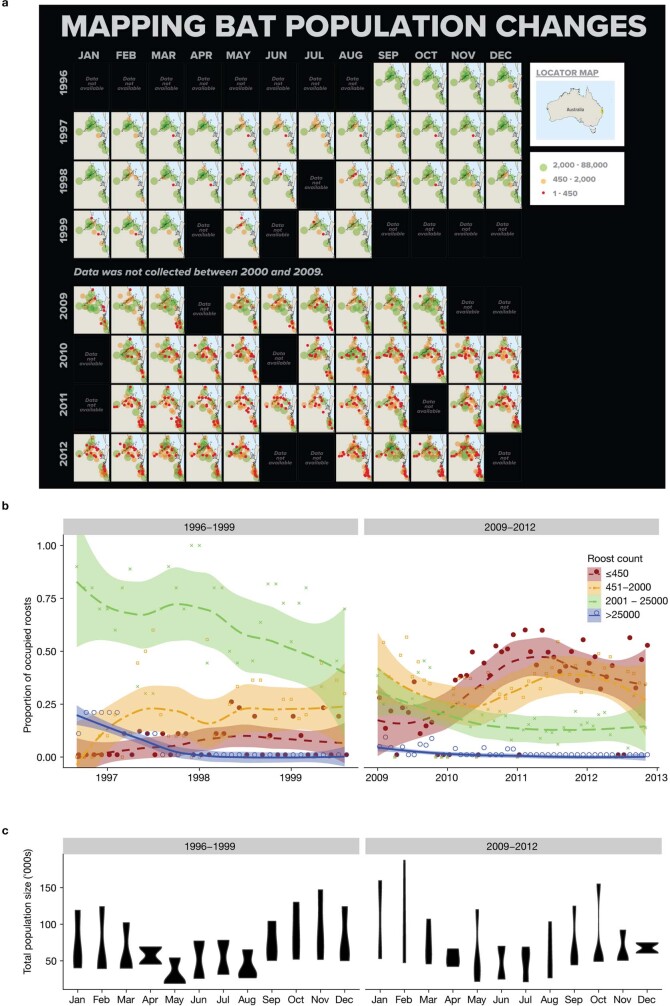
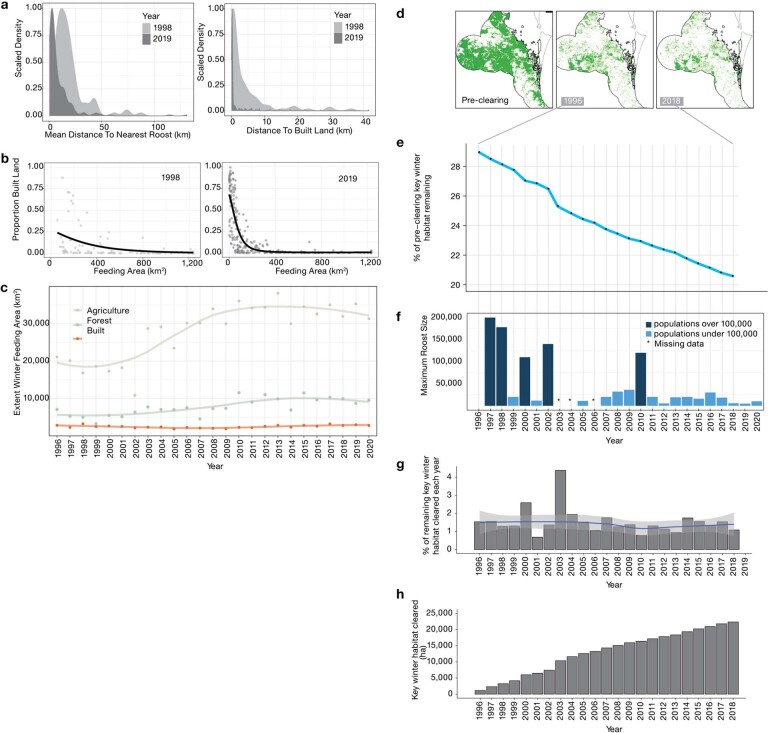
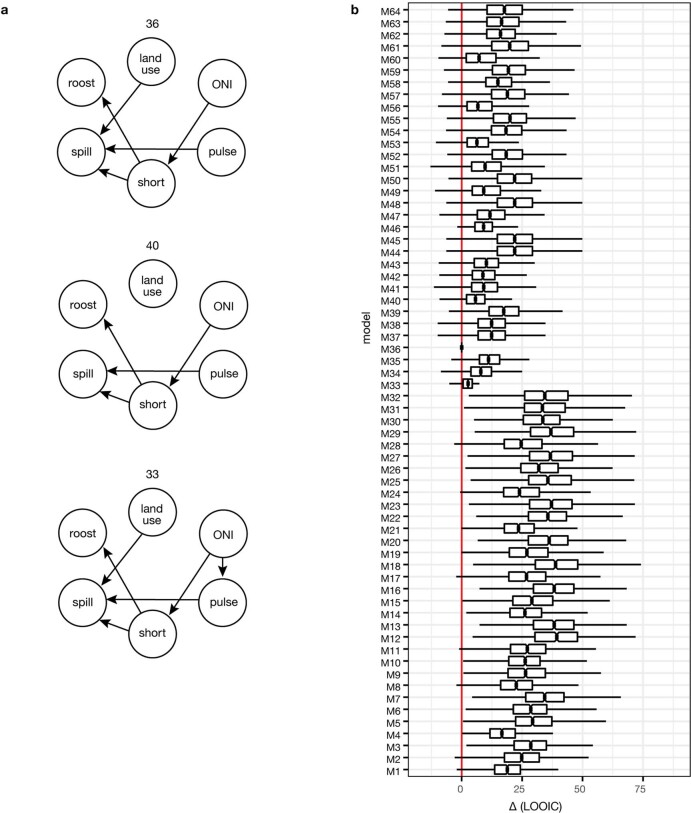
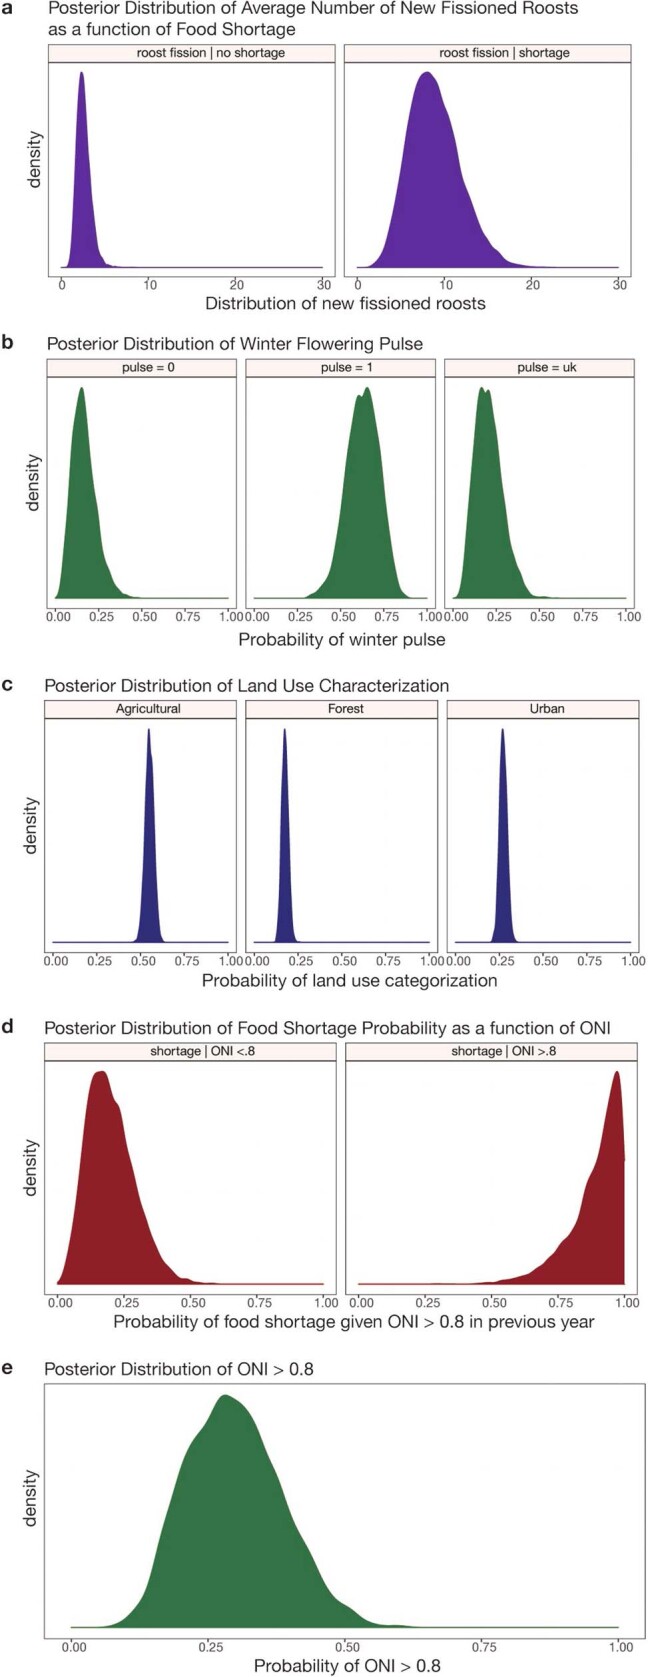
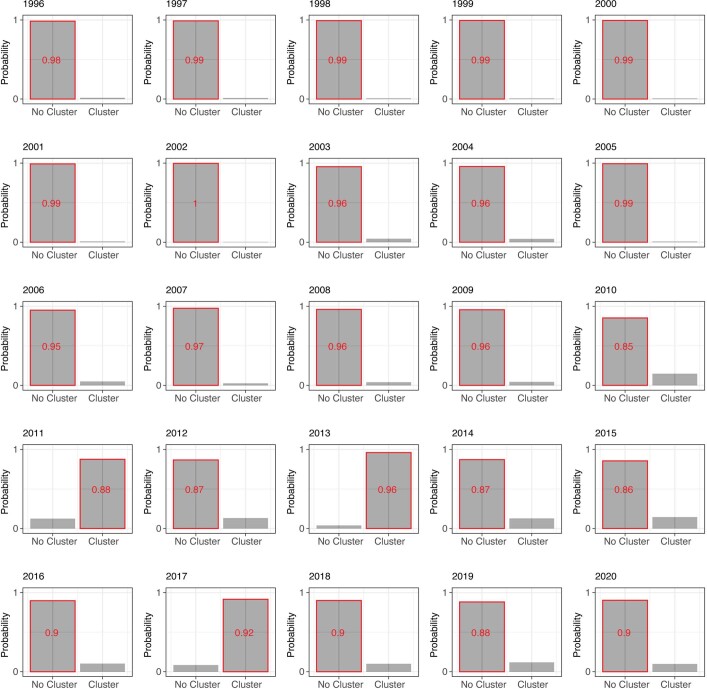
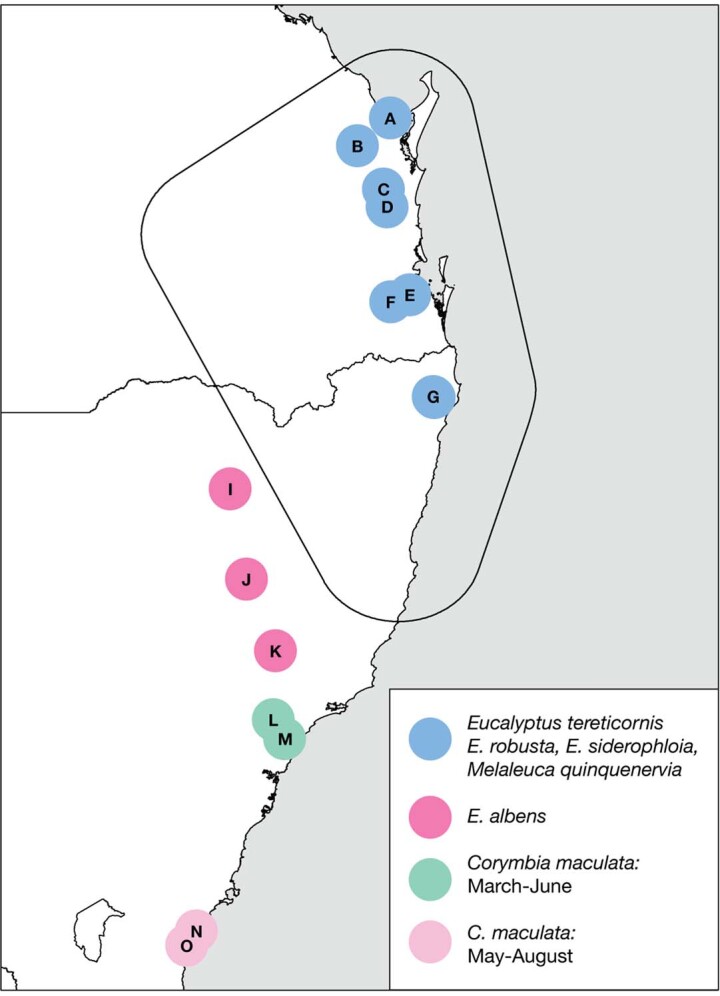
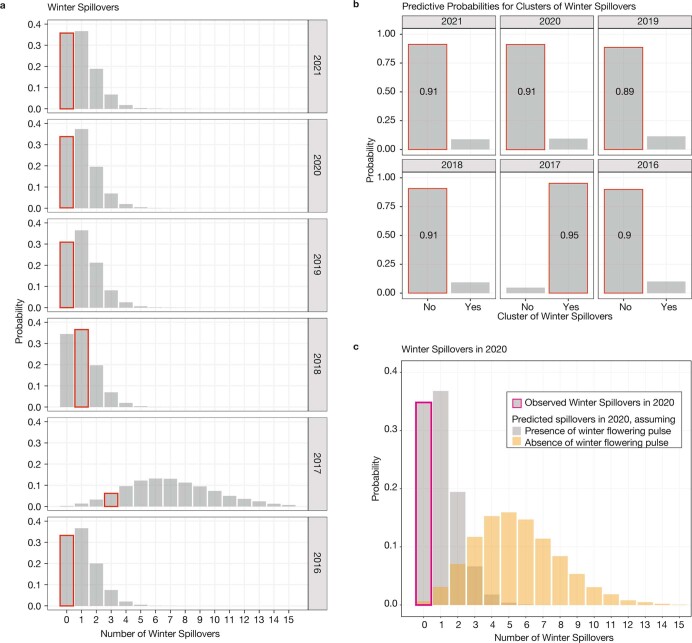
During recent decades, pathogens that originated in bats have become an increasing public health concern. A major challenge is to identify how those pathogens spill over into human populations to generate a pandemic threat1. Many correlational studies associate spillover with changes in land use or other anthropogenic stressors2,3, although the mechanisms underlying the observed correlations have not been identified4. One limitation is the lack of spatially and temporally explicit data on multiple spillovers, and on the connections among spillovers, reservoir host ecology and behaviour and viral dynamics. We present 25 years of data on land-use change, bat behaviour and spillover of Hendra virus from Pteropodid bats to horses in subtropical Australia. These data show that bats are responding to environmental change by persistently adopting behaviours that were previously transient responses to nutritional stress. Interactions between land-use change and climate now lead to persistent bat residency in agricultural areas, where periodic food shortages drive clusters of spillovers. Pulses of winter flowering of trees in remnant forests appeared to prevent spillover. We developed integrative Bayesian network models based on these phenomena that accurately predicted the presence or absence of clusters of spillovers in each of the 25 years. Our long-term study identifies the mechanistic connections between habitat loss, climate and increased spillover risk. It provides a framework for examining causes of bat virus spillover and for developing ecological countermeasures to prevent pandemics.


Conflict of interest statement

The authors declare no competing interests.

Figures

Fig. 1
Fig. 1. Temporal and spatial distribution of documented Hendra virus spillovers to horses in the Australian subtropics from 1996 to 2020.
a, Distribution of spillovers across subtropical eastern Australia from 1996 to present. The dotted blue line denotes our study area. b, Hendra virus spillover by date of horse fatality from 1996 to present. Spillover events cluster in space in some years. c, Hendra virus spillover by month. In the subtropics, spillovers occur primarily during the Austral winter. The base-map was obtained from the Australian Bureau of Statistics digital boundary files (www.abs.gov.au).
Fig. 2
Fig. 2. Relationships between climate, periods of nutritional and energetic stress for bats and Hendra virus spillovers.
a, Temporal associations among the ONI, acute food shortages (identified by apiarists) and winter spillovers. A strong El Niño event (ONI > 0.8) consistently led to food shortages the following winter or spring, although food shortages can occur independently of ONI. During the early study period (1996 to 2002), food shortages did not lead to Hendra virus spillovers; during the period of rapid change, when bat populations were fissioning into urban and agricultural areas, food shortages led to Hendra virus spillovers during the following winter. b, Number of roosts in the study area. c, Timing of winter spillover events in relation to the presence of large aggregations (at least 100,000 bats) and productive flowering of diet species in southeast Australia during winter (June to August). Each row indicates a winter for which data were available. Data are missing for winter aggregations for 1999, 2003, 2004, 2006, 2008 and 2014 (Supplementary Table 5a).
Fig. 3
Fig. 3. The distribution of Pteropus alecto roosts during winter.
a, Expansion of the number and distribution of roosts occupied by Pteropus alecto during winter from 1998 to 2019. The base-map was obtained from the Australian Bureau of Statistics digital boundary files (www.abs.gov.au). b, Proportion of the foraging area surrounding roosts that was classified as built, forested or agricultural (Supplementary Information 13). The red circles indicate roosts that were the sources of winter spillovers.
Fig. 4
Fig. 4. Prediction of spillover on the basis of bat ecology and ecological conditions.
a, Structure of the Bayesian network model: strong El Niño events preceded food shortages that were associated with population fissioning and formation of persistent roosts in agricultural and urban areas. Spillover risk was greatest when Pteropus alecto fed in agricultural areas during a winter that followed an acute food shortage. The presence of a pulse of winter flowering that attracted large aggregations of bats mitigated spillover risk. Time delays between high ONI, food shortages and spillover allow advanced prediction, although winter-flowering pulses that mitigate spillover could not be predicted in advance. b, Probability of a spillover at the roost level given scenarios of land use under the condition of a food shortage followed by no winter-flowering pulse. Other, collates all other scenarios of the presence and absence of food shortages and flowering pulses. The circles are maximum a posteriori point estimates, and the bars are 95% highest posterior density credible intervals. c, Predicted probability of a cluster of spillovers in each year from 2013 to 2021. Predictions for a given year were made with all observations to that date; information from future years was not incorporated into predictions. In 2017 and 2013, food shortages in the year before and no winter-flowering pulse led to elevated risk of spillover, whereas in the other years, no clusters of spillovers were predicted. All predictions were consistent with the realized data on the absence (open circles) or presence (closed circles) of clusters of spillover. d, Predictive probability of a cluster of spillovers in winter 2020, following a food shortage in 2019. A winter-flowering pulse occurred in early July 2020 and no winter spillovers were observed. We predicted that a cluster of spillover events would have occurred if there had not been a flowering pulse.
Extended Data Fig. 1
Extended Data Fig. 1. Boundaries of the Hendra virus study area and Southeast Queensland study area with locations of Hendra virus spillovers to horses indicated.
(a) The full study area with locations of subtropical Hendra virus spillovers (circles, Database A); (b) The far Southeast Queensland (SEQ) study area showing the Hendra virus spillovers documented within the boundary (circles, Database A); and the 2018 distributions of built land use (light red, Supplementary Information 9) and extant winter foraging habitat for flying foxes (green, Supplementary Information 12). Base-maps were obtained from the Australian Bureau of Statistics Digital boundary files (www.abs.gov.au).
Extended Data Fig. 2
Extended Data Fig. 2. Measures of flying fox fitness identified as important proxies of food shortage in regression tree model.
(a) index of reproductive output: annual estimates of the percentage of adult females occupying roosts in the Northern Rivers (NR) region (light grey) and throughout the Hendra virus study area (black) carrying live young pre-weaning; data are grouped according to whether a period of nectar shortage was recorded by apiarists during the winter or spring associated with that birth cohort (n = 9 years) versus cohorts when a nectar shortage was not recorded (n = 14 years). Data acquired in years of food shortage were widely dispersed relative to highly clustered data acquired in years without food shortage. Patterns of data distribution were consistent between the NR region and the full study area. Box plots show median values, upper and lower quartiles and all data points. (b) monthly counts of admissions to Northern Rivers WIRES wildlife rehabilitation center with months classified as nectar shortage by apiary data (indicated by orange bars). No intake records were available from June 2003 through December 2005. The bounds of the box correspond to the 25th and 75th percentiles, the middle dash is the median, and the whiskers extend to the largest value no further than 1.5 times the interquartile range from the 25th or 75th percentile.
Extended Data Fig. 3
Extended Data Fig. 3. Regression tree fit for identifying flying fox food shortages (as assessed by absence or very low nectar production).
Food shortages were predicted when monthly flying fox intakes into wildlife rehabilitation centers were ≥30 individuals and minimum proportion of female flying foxes with young pre-weaning was <79%.
Extended Data Fig. 4
Extended Data Fig. 4. Changes through time in the number and estimated population size of roosts occupied by black flying foxes Pteropus alecto in the SEQ study area.
Censuses of roosts were conducted monthly in two time periods: T1 = 1996–1999 and T2 = 2009–2012. (a) Monthly maps of roost locations and population size grouped in three quantiles. The base-map was obtained from the Australian Bureau of Statistics Digital boundary files (www.abs.gov.au). (b) An additional population size category (>25,000) was added to illustrate change in large roosts. The line is a LOESS best fit and gray shading indicates 95% confidence intervals. (c). Total population estimates of black flying foxes (all roosts combined) grouped by month and year and summarized in violin plots. The number and locations of roosts was stable in T1 (n = 12) and increased from 34 to 80 in T2, although total estimates of black flying foxes in the study area remained stable.
Extended Data Fig. 5
Extended Data Fig. 5. Spatial and temporal changes in the roosting and foraging behaviors of Pteropus bats during the study period (1996–2019 comparisons); and coincident decline in the extent of winter habitat in the SEQ study area.
(a) Mean distance between nearest neighboring roosts and the distance between roosts and developed areas decreased. (b) Roost occupancy in built land in metropolitan centers increased; smaller foraging areas contained a higher proportion of urban land; (c) Annual change in the area of different land-cover types within the total winter foraging range of P. alecto. Data are the summed total of the area assigned to each land use type in the foraging areas of roosts occupied in winter. The total area of land in the winter foraging range increased over time, primarily as a result of expansion into agricultural areas. Although the number of winter roosts in urban areas increased substantially, the total area of built land in combined foraging areas did not. (d) Distribution of key winter habitat in the southeast Queensland study area (SEQ): pre-clearing, at the start of the study in 1996 and at the end of the study in 2018. (e) Percentage of pre-clearing winter habitat remaining (note that the y-axis is compressed). (f) Abundance of bats in the largest winter roosts within SEQ. Aggregations ≥100,000 were common pre-2005, rare after 2005, and none occurred from 2011 to 2020. (g) Annual rate of clearing of key winter habitat in the SEQ study area 1996–2018, the line is a LOESS best fit. Gray shading indicates 95% confidence intervals and (h) Cumulative area cleared (ha).
Extended Data Fig. 6
Extended Data Fig. 6. A total of 64 different plausible network models were assessed using expected log pointwise predictive density (ELPD) and leave-one-out (LOO) cross-validation for predictive validation.
(a) The figure contains the best network, Model 36 (top), plus all of the other networks within 10 leave-one-out information criteria (LOOIC) units of Model 36. The node labels are abbreviated; spill is spillover, roost is roost fissioning, land use is the land use type at the roost level, short is a food shortage in the previous year, pulse is a winter flowering pulse, and ONI is elevated ONI over 0.8 two years prior. (b) Distribution of LOOIC values relative to Model 36. For each model, the boxplots (n = 1000 simulations) show the distribution of the difference in LOOIC. M36 is the favored model as the median, and at least the first quartile, are positive for all other models. The bounds of the box correspond to the 25th and 75th percentiles, the middle dash is the median, and the whiskers extend to the largest value no further than 1.5 times the interquartile range from the 25th or 75th percentile.
Extended Data Fig. 7
Extended Data Fig. 7. Posterior distributions for model parameters in Bayesian Network Model.
(A) posterior distribution of new fissioned roosts, conditional on food shortage events. (B) posterior distribution for the probability of a winter flower pulse. (C) posterior distribution for the probability of a roost having the three different land use characteristics. (D) posterior distribution for the probability of a food shortage given elevated ONI values. (E) the posterior distribution for the probability of elevated ONI values.
Extended Data Fig. 8
Extended Data Fig. 8. Output from 5-fold cross validation study to assess the ability of our model to predict spillover clusters.
The red bars correspond to whether a cluster of spillovers was observed in that year and the grey bars and number correspond to predicted probabilities. For a given year, roost-level predictions are made using models fit on roosts-year combinations from other folds. This approach provides strong evidence of the predictive ability of the model framework as it predicts, with high certainty, the presence or absence of clusters of spillovers in all 25 years.
Extended Data Fig. 9
Extended Data Fig. 9. The locations of pulses of winter flowering in southeast Australia 1997–2020 as identified by aggregations ≥100,000 of nomadic grey-headed flying foxes and black flying foxes; and the winter flowering diet plants that occur in local vegetation communities.
Winter habitat in the Hendra virus study area primarily comprises a mix of four species, two single species occur in other regions. Latitudinal variations in the flowering phenology of Corymbia maculata are indicated. Dates are provided in Dataset J, a key to roost names is provided in Supplementary Table 5B. The base-map was obtained from the Australian Bureau of Statistics Digital boundary files (www.abs.gov.au).
Extended Data Fig. 10
Extended Data Fig. 10. Predicted probabilities for total number and clusters of winter spillovers.
(a) Predicted probability for total number of winter spillovers (grey bars) and observed number of winter spillovers (red outlines). (b) Predicted probability for a cluster of spillovers (grey bars, defined as three or more spillovers) and the observed presence or absence of a cluster of winter spillovers (red outlines). In both figures, predictions are made using all observed data up to that time, but information from future years is not incorporated into predictions. The period of 2016 through 2021 was chosen for probabilistic predictions because enough preceding data allowed predictions. Food shortages were seen preceding years 2017 and 2020, but only the year 2017 included both a food shortage and a lack of a winter flowering pulse. All the predictions are supported by the realized data, which fall in higher mass parts of the distributions in (a) and align with predictions with high predicted probabilities in (b). (c) Predictive distribution of the total number of spillovers in winter 2020, following a food shortage in 2019. The grey bars indicate the spectrum of probabilistic predictions for spillover, given a winter flowering pulse. A winter flowering pulse did occur in early July 2020 and no winter spillovers were observed (pink outlined bar). Had no flowering pulse occurred, we predicted many more spillover events (yellow bars).

Comment in

References

    1. Plowright RK, et al. Pathways to zoonotic spillover. Nat. Rev. Microbiol. 2017;15:502–510. doi: 10.1038/nrmicro.2017.45. - DOI - PMC - PubMed
    1. Jones KE, et al. Global trends in emerging infectious diseases. Nature. 2008;451:990–993. doi: 10.1038/nature06536. - DOI - PMC - PubMed
    1. Gottdenker NL, Streicker DG, Faust CL, Carroll C. Anthropogenic land use change and infectious diseases: a review of the evidence. Ecohealth. 2014;11:619–632. doi: 10.1007/s10393-014-0941-z. - DOI - PubMed
    1. Plowright RK, et al. Land use-induced spillover: a call to action to safeguard environmental, animal, and human health. Lancet Planet. Health. 2021;5:e237–e245. doi: 10.1016/S2542-5196(21)00031-0. - DOI - PMC - PubMed
    1. Letko M, Seifert SN, Olival KJ, Plowright RK, Munster VJ. Bat-borne virus diversity, spillover and emergence. Nat. Rev. Microbiol. 2020;18:461–471. doi: 10.1038/s41579-020-0394-z. - DOI - PMC - PubMed

Publication types