. 2022 Nov 16;23(1):490.
doi: 10.1186/s12859-022-05008-y.

Annotation of structural variants with reported allele frequencies and related metrics from multiple datasets using SVAFotate

Affiliations

Annotation of structural variants with reported allele frequencies and related metrics from multiple datasets using SVAFotate

Thomas J Nicholas et al. BMC Bioinformatics. .

Abstract

Background: Identification of deleterious genetic variants using DNA sequencing data relies on increasingly detailed filtering strategies to isolate the small subset of variants that are more likely to underlie a disease phenotype. Datasets reflecting population allele frequencies of different types of variants serve as powerful filtering tools, especially in the context of rare disease analysis. While such population-scale allele frequency datasets now exist for structural variants (SVs), it remains a challenge to match SV calls between multiple datasets, thereby complicating estimates of a putative SV's population allele frequency.

Results: We introduce SVAFotate, a software tool that enables the annotation of SVs with variant allele frequency and related information from existing SV datasets. As a result, VCF files annotated by SVAFotate offer a variety of metrics to aid in the stratification of SVs as common or rare in the broader human population.

Conclusions: Here we demonstrate the use of SVAFotate in the classification of SVs with regards to their population frequency and illustrate how SVAFotate's annotations can be used to filter and prioritize SVs. Lastly, we detail how best to utilize these SV annotations in the analysis of genetic variation in studies of rare disease.

Keywords: Genome annotation; Population allele frequency; Structural variation.


Conflict of interest statement

The authors declare that they have no competing interests.

Figures

Fig. 1
Fig. 1
Matching SVs from different datasets based on shared SVTYPE and genomic overlaps. The average fraction of overlaps between deletions (DEL, in red), duplications (DUP, in blue), and inversions (INV, in purple) from CCDG, gnomAD, and 1000G are identified using varying amounts of required reciprocal overlap. Higher required reciprocal overlap fractions correspond to more exact genomic coordinate matches. Each dataset is compared to one another (CCDG + gnomAD, CCDG + 1000G, and gnomAD + 1000G) and overlaps with a different required reciprocal fraction are calculated. The fraction of total SVs found to have overlaps given the required reciprocal overlap fraction is found for each respective dataset and the average of these fractions is plotted. Finally, the average fraction of SVs found to have overlaps in all datasets (CCDG + gnomAD + 1000G) is found for each SVTYPE and at each required reciprocal overlap fraction
Fig. 2
Fig. 2
Matching SVs for Annotation Creation. a SVAFotate expects two distinct input files: an unannotated SV VCF file and a BED file which may contain SV calls from multiple population datasets and their accompanying AF metrics. To represent the SV calls in these files, unannotated SVs are illustrated as gray rectangles while SVs from three different datasets, such as CCDG, gnomAD, and 1000G, are represented by green rectangles with their reported population AF included as labels. For this example we will assume that all rectangles represent SVs of the same SVTYPE. SVAFotate attempts to identify matches between unannotated SVs and the SVs present in the BED file by identifying genomic coordinate overlaps that meet user-defined criteria between SVs of the same SVTYPE. Multiple matches are possible, and all AF related data is saved for each match. b SVAFotate is capable of generating multiple annotations that are added to the original VCF file and are each derived using information saved from matching the SVs. The types and variety of annotations added to the VCF are determined by input parameters provided at the command line, but here the example annotation added is the Max_AF (default) annotation
Fig. 3
Fig. 3
Frequency of CEPH SVs. a Barplots representing the fraction of CEPH derived SVs per SVTYPE (deletions, duplications, and inversions) that are classified as Common (Max_AF >  = 0.05), LowFreq (0.05 > Max_AF >  = 0.01), Rare (Max_AF < 0.01), or Unique (Max_AF = 0.0). b The total number of Unique SVs identified per SVTYPE (deletions, duplications, and inversions) that are CEPH family-specific with the mean indicated as a solid, colored line
Fig. 4
Fig. 4
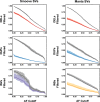
Filtering of NeoSeq SVs using AF cutoffs. The fraction of NeoSeq proband SV calls, per SVTYPE, that are filtered by using the Max_AF annotation added by SVAFotate and a range of AF cutoff values. SVTYPEs are abbreviated as follows: deletions (DELs), duplications (DUPs), inversions (INVs), and insertions (INSs). Plots on the left are SV calls derived from Smoove while the plots on the right are from Manta. Lines that are colored represent the resulting filtered SVs using the Max_AF annotation generated using the provisional BED file, while the gray lines represent the filtered SVs using the Max_AF annotation created by the custom NeoSeq BED file. Each line has the maximum and minimum amount of filtered SVs observed across all 22 NeoSeq cases analyzed plotted as a shadow surrounding the line
Fig. 5
Fig. 5
Recommended SVAFotate Parameters. Each plot illustrates SVs from the input VCF as gray rectangles with colored rectangles representing SVs from various datasets, such as CCDG, gnomAD, or 1000G. In all examples, the SVs depicted by gray and green rectangles are of the same SVTYPE. a Requiring a reciprocal overlap with the -f parameter specifies that SVs being compared to one another must each have an overlap that meets a minimum fraction of the total size of the SV in order to be counted as a match and saved for future annotations by SVAFotate. On the top, the -f parameter is not being used and any overlap, regardless of size, is being counted as a match, while on the bottom, -f is being used with a value of 0.8 which reduces the number of matches to those with greater overlap similarity. b The OFPs for potential matches are calculated and listed as labels on each of the colored rectangles, representing SVs from three different datasets. The “best” match is determined by the match with the highest OFP value and metrics specific to that best match are saved and used for subsequent SVAFotate best annotations. If no match exists as illustrated for the SV on the left for Dataset 3, no best annotations are added for that dataset. c Gray rectangles represent deletions from the input VCF and colored rectangles represent different SVTYPEs, specifically deletions (red), duplications (blue), and inversions (purple). Matches are defined as SVs of the same SVTYPE that overlap one another while mismatches are SVs of differing SVTYPEs that share an overlap. d For each SV from the input VCF, all overlaps are saved and used to determine how much of the total SV region has also been observed in the datasets which is then reported as the SV_Cov annotation.

References

    1. Sudmant PH, Rausch T, Gardner EJ, Handsaker RE, Abyzov A, Huddleston J, et al. An integrated map of structural variation in 2,504 human genomes. Nature. 2015;526(7571):75–81. doi: 10.1038/nature15394. - DOI - PMC - PubMed
    1. Scott AJ, Chiang C, Hall IM. Structural variants are a major source of gene expression differences in humans and often affect multiple nearby genes. Genome Res. 2021;33:1083. - PMC - PubMed
    1. Weischenfeldt J, Symmons O, Spitz F, Korbel JO. Phenotypic impact of genomic structural variation: insights from and for human disease. Nat Rev Genet. 2013;14(2):125–138. doi: 10.1038/nrg3373. - DOI - PubMed
    1. Malhotra D, Sebat J. CNVs: harbingers of a rare variant revolution in psychiatric genetics. Cell. 2012;148(6):1223–1241. doi: 10.1016/j.cell.2012.02.039. - DOI - PMC - PubMed
    1. Ho SS, Urban AE, Mills RE. Structural variation in the sequencing era. Nat Rev Genet. 2020;21(3):171–189. doi: 10.1038/s41576-019-0180-9. - DOI - PMC - PubMed