. 2022 Nov 16;23(1):489.
doi: 10.1186/s12859-022-05019-9.

lmerSeq: an R package for analyzing transformed RNA-Seq data with linear mixed effects models

Affiliations

lmerSeq: an R package for analyzing transformed RNA-Seq data with linear mixed effects models

Brian E Vestal et al. BMC Bioinformatics. .

Abstract

Background: Studies that utilize RNA Sequencing (RNA-Seq) in conjunction with designs that introduce dependence between observations (e.g. longitudinal sampling) require specialized analysis tools to accommodate this additional complexity. This R package contains a set of utilities to fit linear mixed effects models to transformed RNA-Seq counts that properly account for this dependence when performing statistical analyses.

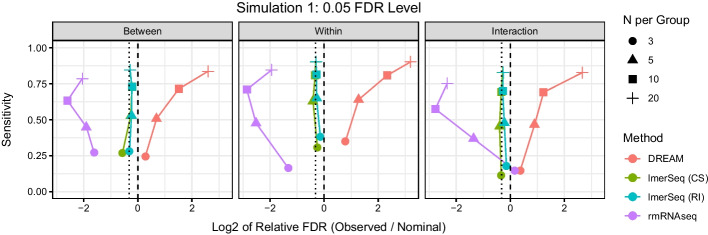
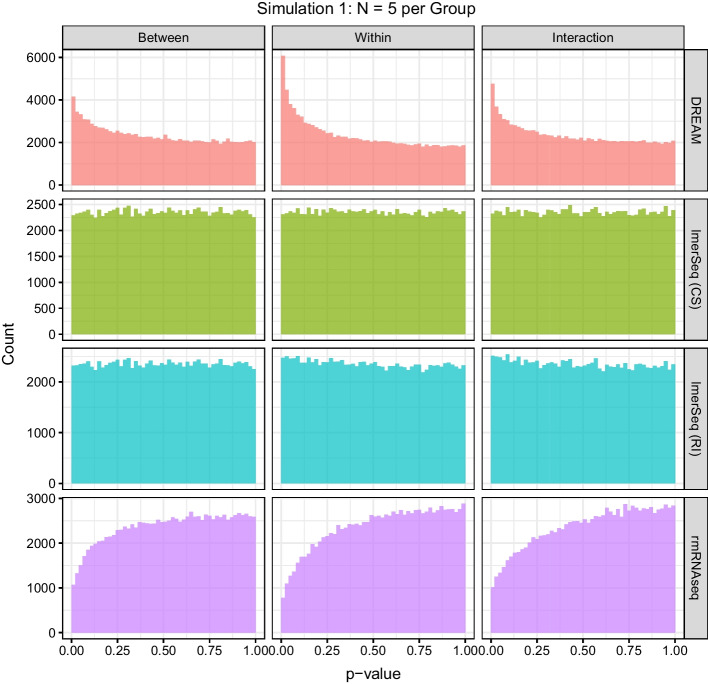
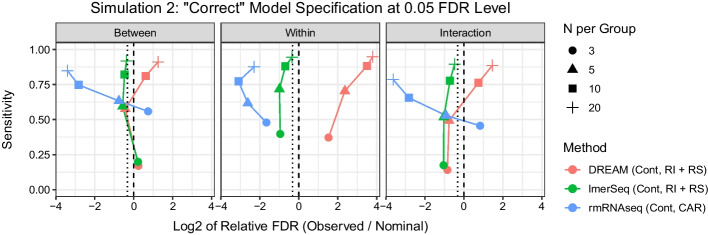
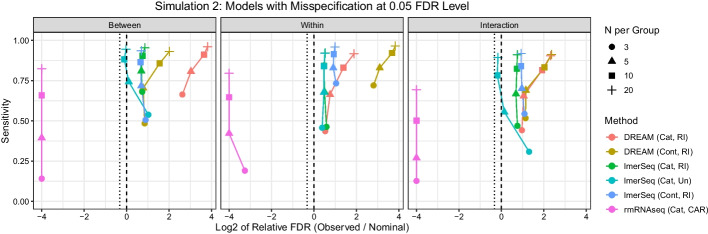
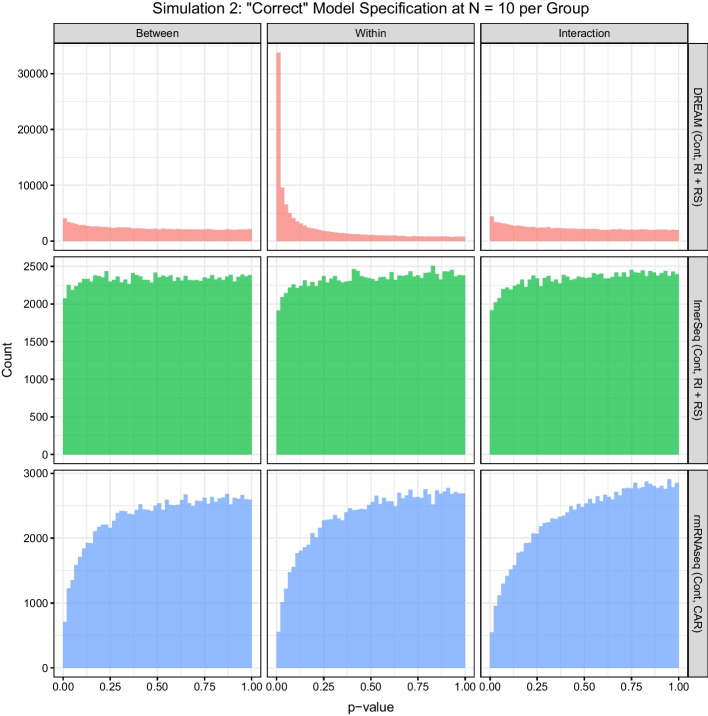
Results: In a simulation study comparing lmerSeq and two existing methodologies that also work with transformed RNA-Seq counts, we found that lmerSeq was comprehensively better in terms of nominal error rate control and statistical power.

Conclusions: Existing R packages for analyzing transformed RNA-Seq data with linear mixed models are limited in the variance structures they allow and/or the transformation methods they support. The lmerSeq package offers more flexibility in both of these areas and gave substantially better results in our simulations.

Keywords: Correlated data; Linear mixed models; RNA-Seq.


Conflict of interest statement

The authors declare that they have no competing interests.

Figures

Fig. 1
Fig. 1
Scatter plot of sensitivity by log2 of the relative false discovery rate (FDR) for each type of test at each sample size at the 0.05 level in Simulation 1. The dashed vertical line represents the nominal rate, while the dotted vertical line represents the expected FDR. RI random intercept, CS compound symmetric covariance matrix
Fig. 2
Fig. 2
Histograms of the p values for the null features across all datasets in Simulation 1 with N=5 subjects per group. RI random intercept, CS compound symmetric covariance matrix
Fig. 3
Fig. 3
Scatter plot of sensitivity by log2 of the relative false discovery rate (FDR) for each type of test at each sample size at the 0.05 level for the models with correct (or as close as possible given method constraints) specification of both the fixed and random effects in Simulation 2. The dashed vertical line represents the nominal rate, while the dotted vertical line represents the expected FDR. Cont continuous time, RI random intercept, RS random slope, CAR continuous auto regressive
Fig. 4
Fig. 4
Scatter plot of sensitivity by log2 of the relative false discovery rate (FDR) for each type of test at each sample size at the 0.05 level for the models with some misspecification of fixed and/or random effects in Simulation 2. The dashed vertical line represents the nominal rate, while the dotted vertical line represents the expected FDR. Cont continuous time, Cat categorical time, RI random intercept, RS random slope, UN unstructured covariance matrix, CAR continuous auto regressive covariance matrix
Fig. 5
Fig. 5
Histograms of the p values for the null features across all datasets in Simulation 2 for the models with the most correct specification of fixed and random effects at N=10 subjects per group. For both DREAM and lmerSeq the fixed and random effects structures were able to exactly match the simulated data, while rmRNAseq could only match the correct fixed effects since it only offers CAR for modeling correlation between observations. Cont continuous time, RI random intercept, RS random slope, CAR continuous auto regressive

References

    1. Khan Y, Hammarström D, Rønnestad BR, Ellefsen S, Ahmad R. Increased biological relevance of transcriptome analyses in human skeletal muscle using a model-specific pipeline. BMC Bioinform. 2020;21(1):1–32. - PMC - PubMed
    1. Leach SM, Gibbings SL, Tewari AD, Atif SM, Vestal B, Danhorn T, Janssen WJ, Wager TD, Jakubzick CV. Human and mouse transcriptome profiling identifies cross-species homology in pulmonary and lymph node mononuclear phagocytes. Cell Rep. 2020;33(5):108337. - PMC - PubMed
    1. Singhania A, Verma R, Graham CM, Lee J, Tran T, Richardson M, Lecine P, Leissner P, Berry MP, Wilkinson RJ, et al. A modular transcriptional signature identifies phenotypic heterogeneity of human tuberculosis infection. Nat Commun. 2018;9(1):1–17. - PMC - PubMed
    1. Braga D, Barcella M, Herpain A, Aletti F, Kistler EB, Bollen Pinto B, Bendjelid K, Barlassina C. A longitudinal study highlights shared aspects of the transcriptomic response to cardiogenic and septic shock. Crit Care. 2019;23(1):1–14. - PMC - PubMed
    1. Robinson MD, McCarthy DJ, Smyth GK. edgeR: a bioconductor package for differential expression analysis of digital gene expression data. Bioinformatics. 2010;26(1):139–140. - PMC - PubMed

LinkOut - more resources