

Adaptation of a microbial community to demand-oriented biological methanation
- PMID: 36384582
- PMCID: PMC9670408
- DOI: 10.1186/s13068-022-02207-w
Adaptation of a microbial community to demand-oriented biological methanation
Abstract
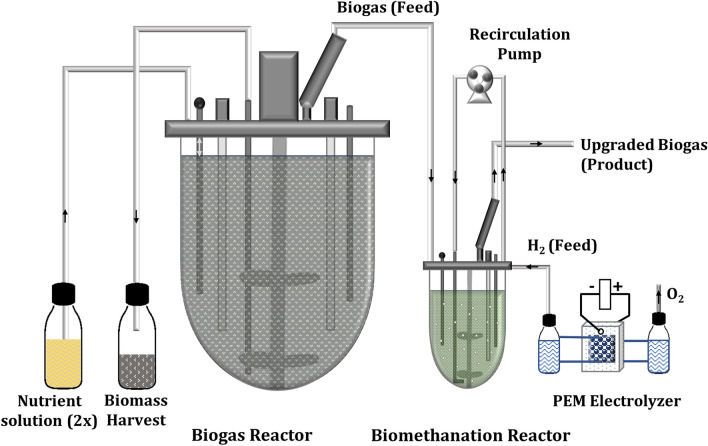
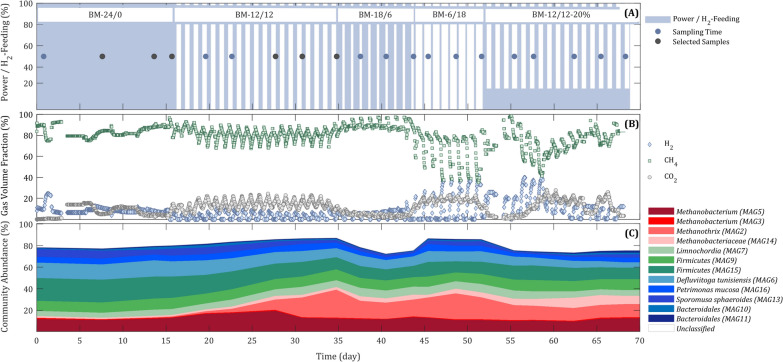
Background: Biological conversion of the surplus of renewable electricity and carbon dioxide (CO2) from biogas plants to biomethane (CH4) could support energy storage and strengthen the power grid. Biological methanation (BM) is linked closely to the activity of biogas-producing Bacteria and methanogenic Archaea. During reactor operations, the microbiome is often subject to various changes, e.g., substrate limitation or pH-shifts, whereby the microorganisms are challenged to adapt to the new conditions. In this study, various process parameters including pH value, CH4 production rate, conversion yields and final gas composition were monitored for a hydrogenotrophic-adapted microbial community cultivated in a laboratory-scale BM reactor. To investigate the robustness of the BM process regarding power oscillations, the biogas microbiome was exposed to five hydrogen (H2)-feeding regimes lasting several days.
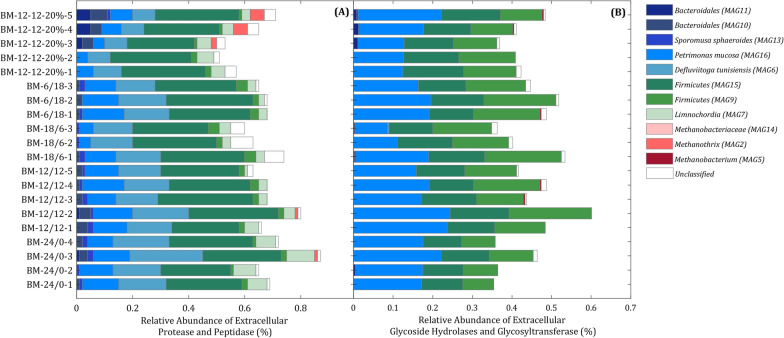
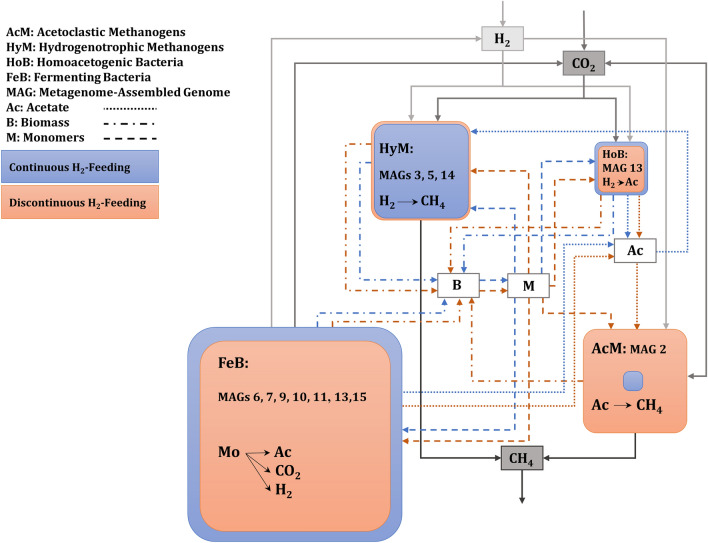
Results: Applying various "on-off" H2-feeding regimes, the CH4 production rate recovered quickly, demonstrating a significant resilience of the microbial community. Analyses of the taxonomic composition of the microbiome revealed a high abundance of the bacterial phyla Firmicutes, Bacteroidota and Thermotogota followed by hydrogenotrophic Archaea of the phylum Methanobacteriota. Homo-acetogenic and heterotrophic fermenting Bacteria formed a complex food web with methanogens. The abundance of the methanogenic Archaea roughly doubled during discontinuous H2-feeding, which was related mainly to an increase in acetoclastic Methanothrix species. Results also suggested that Bacteria feeding on methanogens could reduce overall CH4 production. On the other hand, using inactive biomass as a substrate could support the growth of methanogenic Archaea. During the BM process, the additional production of H2 by fermenting Bacteria seemed to support the maintenance of hydrogenotrophic methanogens at non-H2-feeding phases. Besides the elusive role of Methanothrix during the H2-feeding phases, acetate consumption and pH maintenance at the non-feeding phase can be assigned to this species.
Conclusions: Taken together, the high adaptive potential of microbial communities contributes to the robustness of BM processes during discontinuous H2-feeding and supports the commercial use of BM processes for energy storage. Discontinuous feeding strategies could be used to enrich methanogenic Archaea during the establishment of a microbial community for BM. Both findings could contribute to design and improve BM processes from lab to pilot scale.
Keywords: Acetoclastic methanogens; Biogas upgrade; Biological methanation; Hydrogen starvation; Hydrogenotrophic methanogens; Metaproteomics; Microbial food web; Power to methane; Renewable energy.
© 2022. The Author(s).
Conflict of interest statement
The authors declare that they have no competing interests.
Figures
References
-
- Götz M, Lefebvre J, Mörs F, McDaniel Koch A, Graf F, Bajohr S, et al. Renewable power-to-gas: a technological and economic review. Renew Energy. 2016;85:1371–1390.
-
- Terlouw W, Peters D, van Tilburg J, Schimmel M, Berg T, Cihlar J, Mir GUR, Spöttle M, Staats M, Lejaretta AV, Buseman M, Schenkel M, van Hoorn I, Wassmer C, Kamensek E, Fichter T. Gas for Climate. The optimal role for gas in a net-zero emissions energy system. Gas for Climate: a path to 2050 Group. 2019. https://gasforclimate2050.eu/publications.
-
- Villadsen SNB, Fosbøl PL, Angelidaki I, Woodley JM, Nielsen LP, Møller P. The potential of biogas; the solution to energy storage. Chemsuschem. 2019;12:2147–2153. - PubMed
-
- Peters D, van der Leun K, Terlouw W, van Tilburg J, Berg T, Schimmel M, van der Hoorn I, Buseman M, Staats M, Schenkel M, Mir GUR. Gas Decarbonisation Pathways 2020–2050. Gas for Climate: a path to 2050 Group. 2020. https://gasforclimate2050.eu/publications
Grants and funding
- 031A532B, 031A533A, 031A533B, 031A534A, 031A535A, 031A537A, 031A537B, 031A537C, 031A537D, 031A538A, 031L0103/Bundesministerium für Bildung und Forschung
- 031A532B, 031A533A, 031A533B, 031A534A, 031A535A, 031A537A, 031A537B, 031A537C, 031A537D, 031A538A, 031L0103/Bundesministerium für Bildung und Forschung
- 031A532B, 031A533A, 031A533B, 031A534A, 031A535A, 031A537A, 031A537B, 031A537C, 031A537D, 031A538A, 031L0103/Bundesministerium für Bildung und Forschung
- 031A532B, 031A533A, 031A533B, 031A534A, 031A535A, 031A537A, 031A537B, 031A537C, 031A537D, 031A538A, 031L0103/Bundesministerium für Bildung und Forschung
- 031A532B, 031A533A, 031A533B, 031A534A, 031A535A, 031A537A, 031A537B, 031A537C, 031A537D, 031A538A, 031L0103/Bundesministerium für Bildung und Forschung
LinkOut - more resources
Full Text Sources
Molecular Biology Databases
Miscellaneous