. 2022 Nov 16;6(1):e202201499.
doi: 10.26508/lsa.202201499. Print 2023 Jan.

GPER1 links estrogens to centrosome amplification and chromosomal instability in human colon cells

Affiliations

GPER1 links estrogens to centrosome amplification and chromosomal instability in human colon cells

Miriam Bühler et al. Life Sci Alliance. .

Abstract

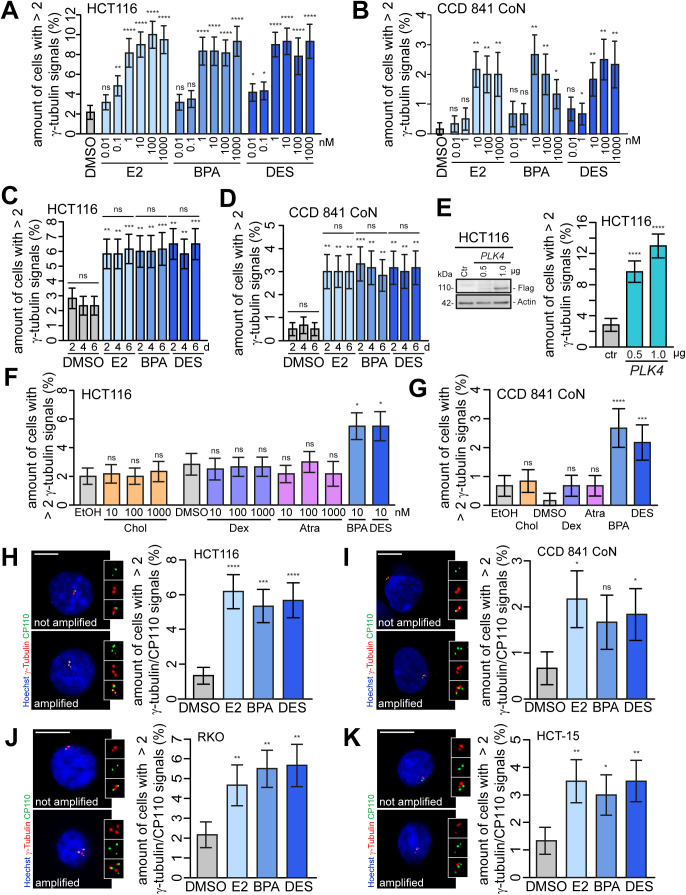
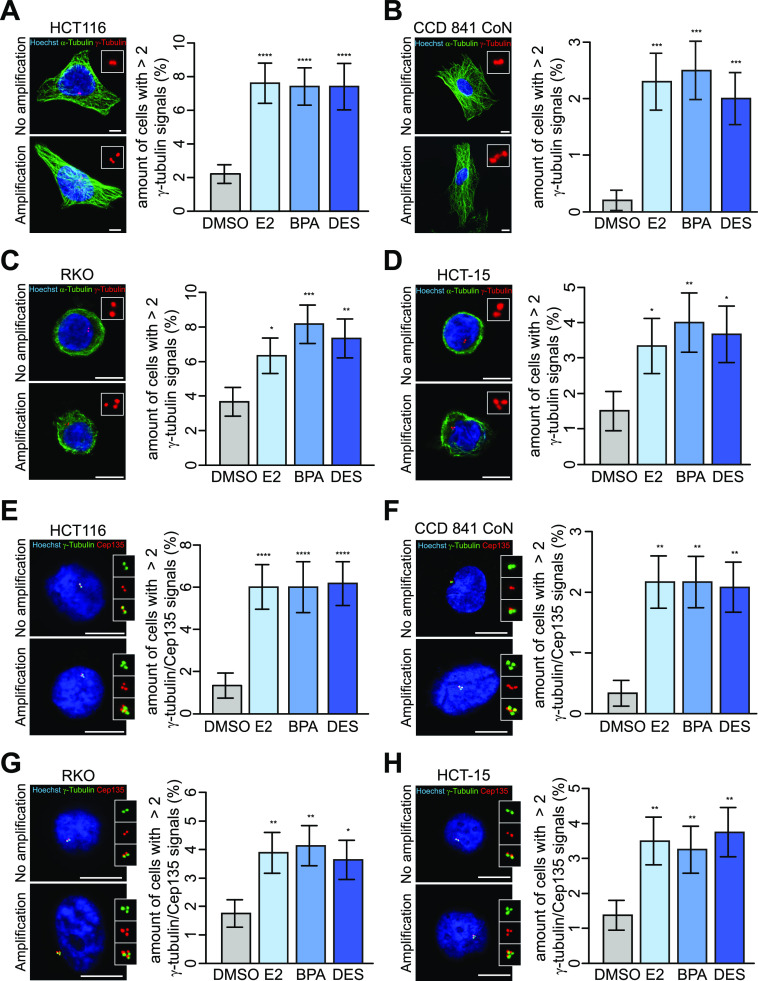
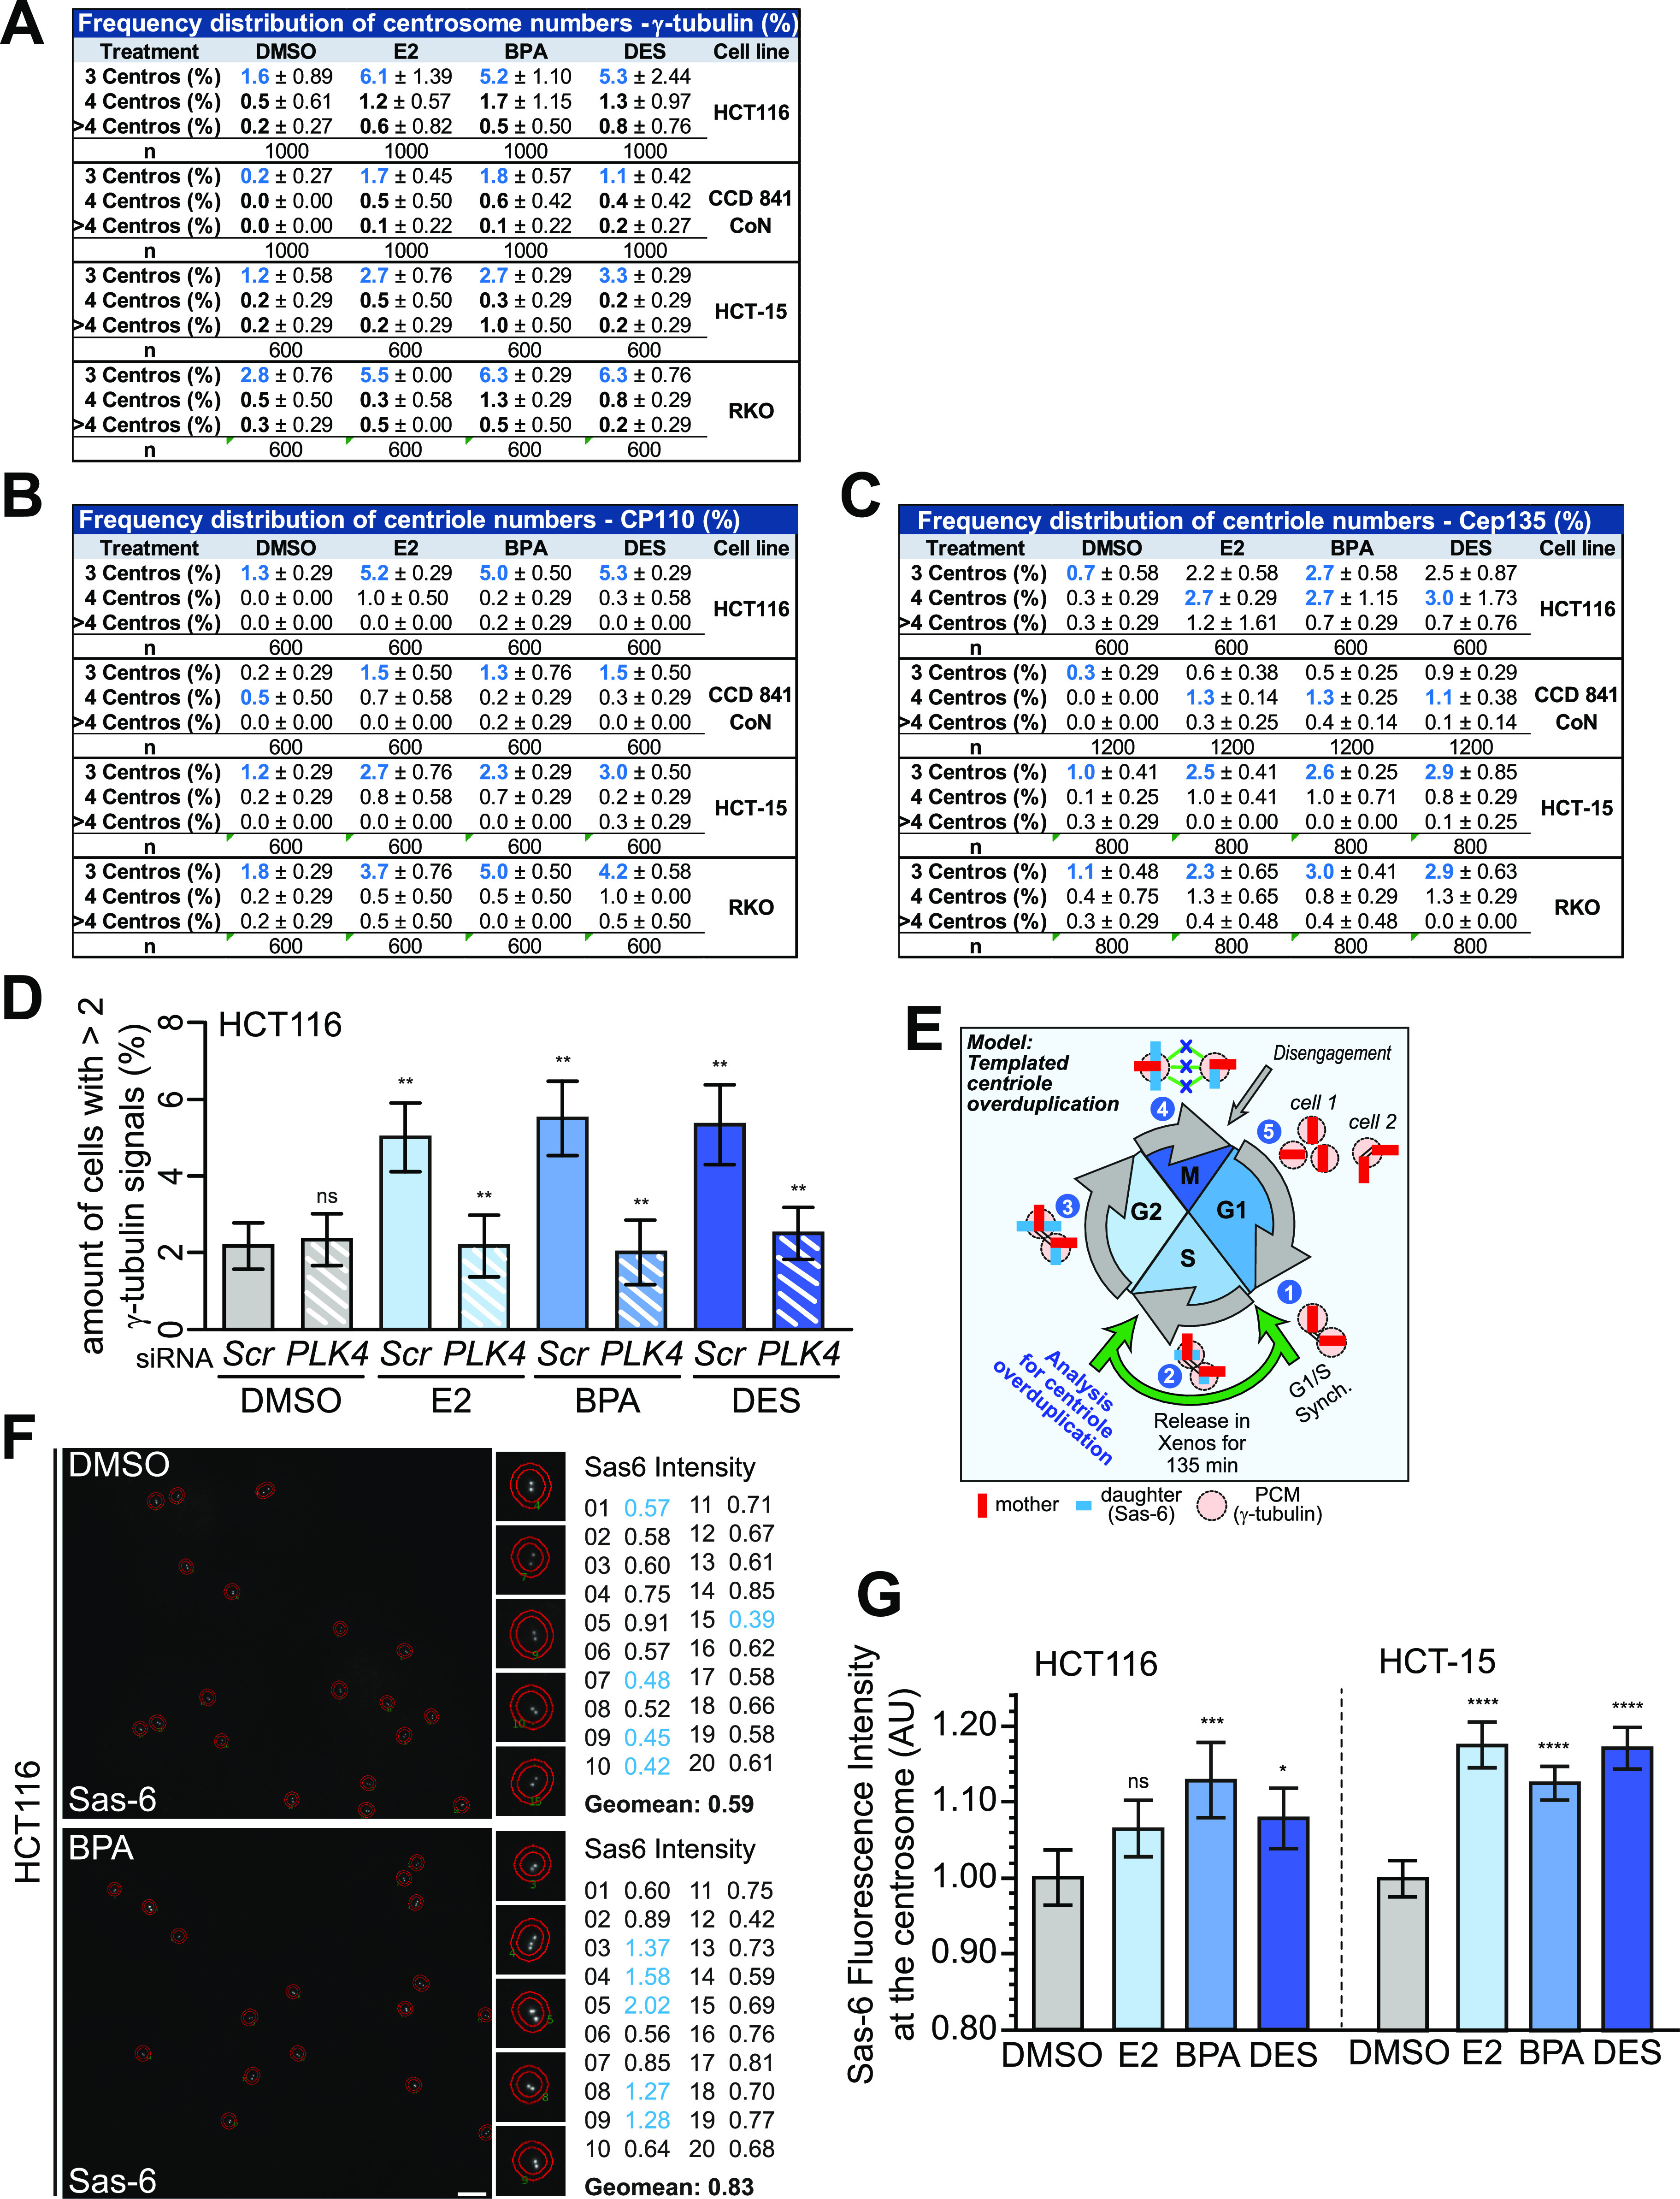
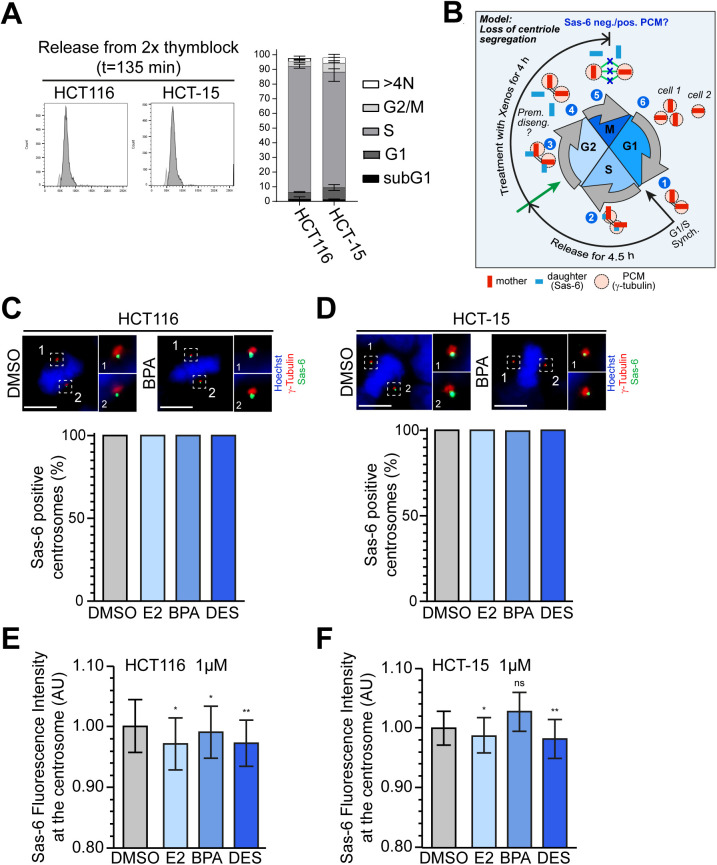
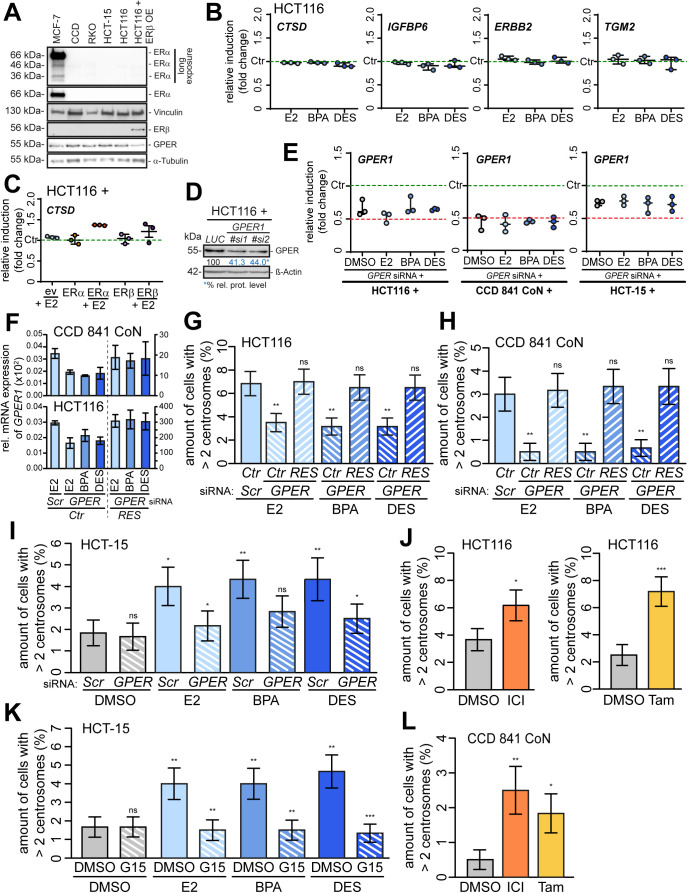
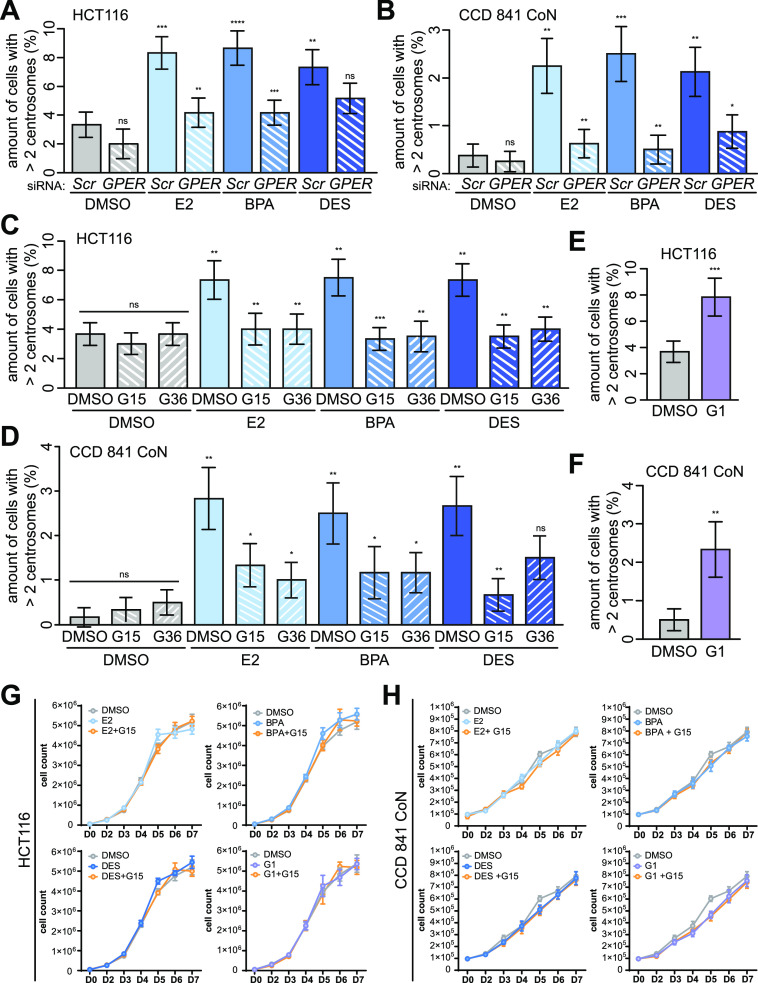
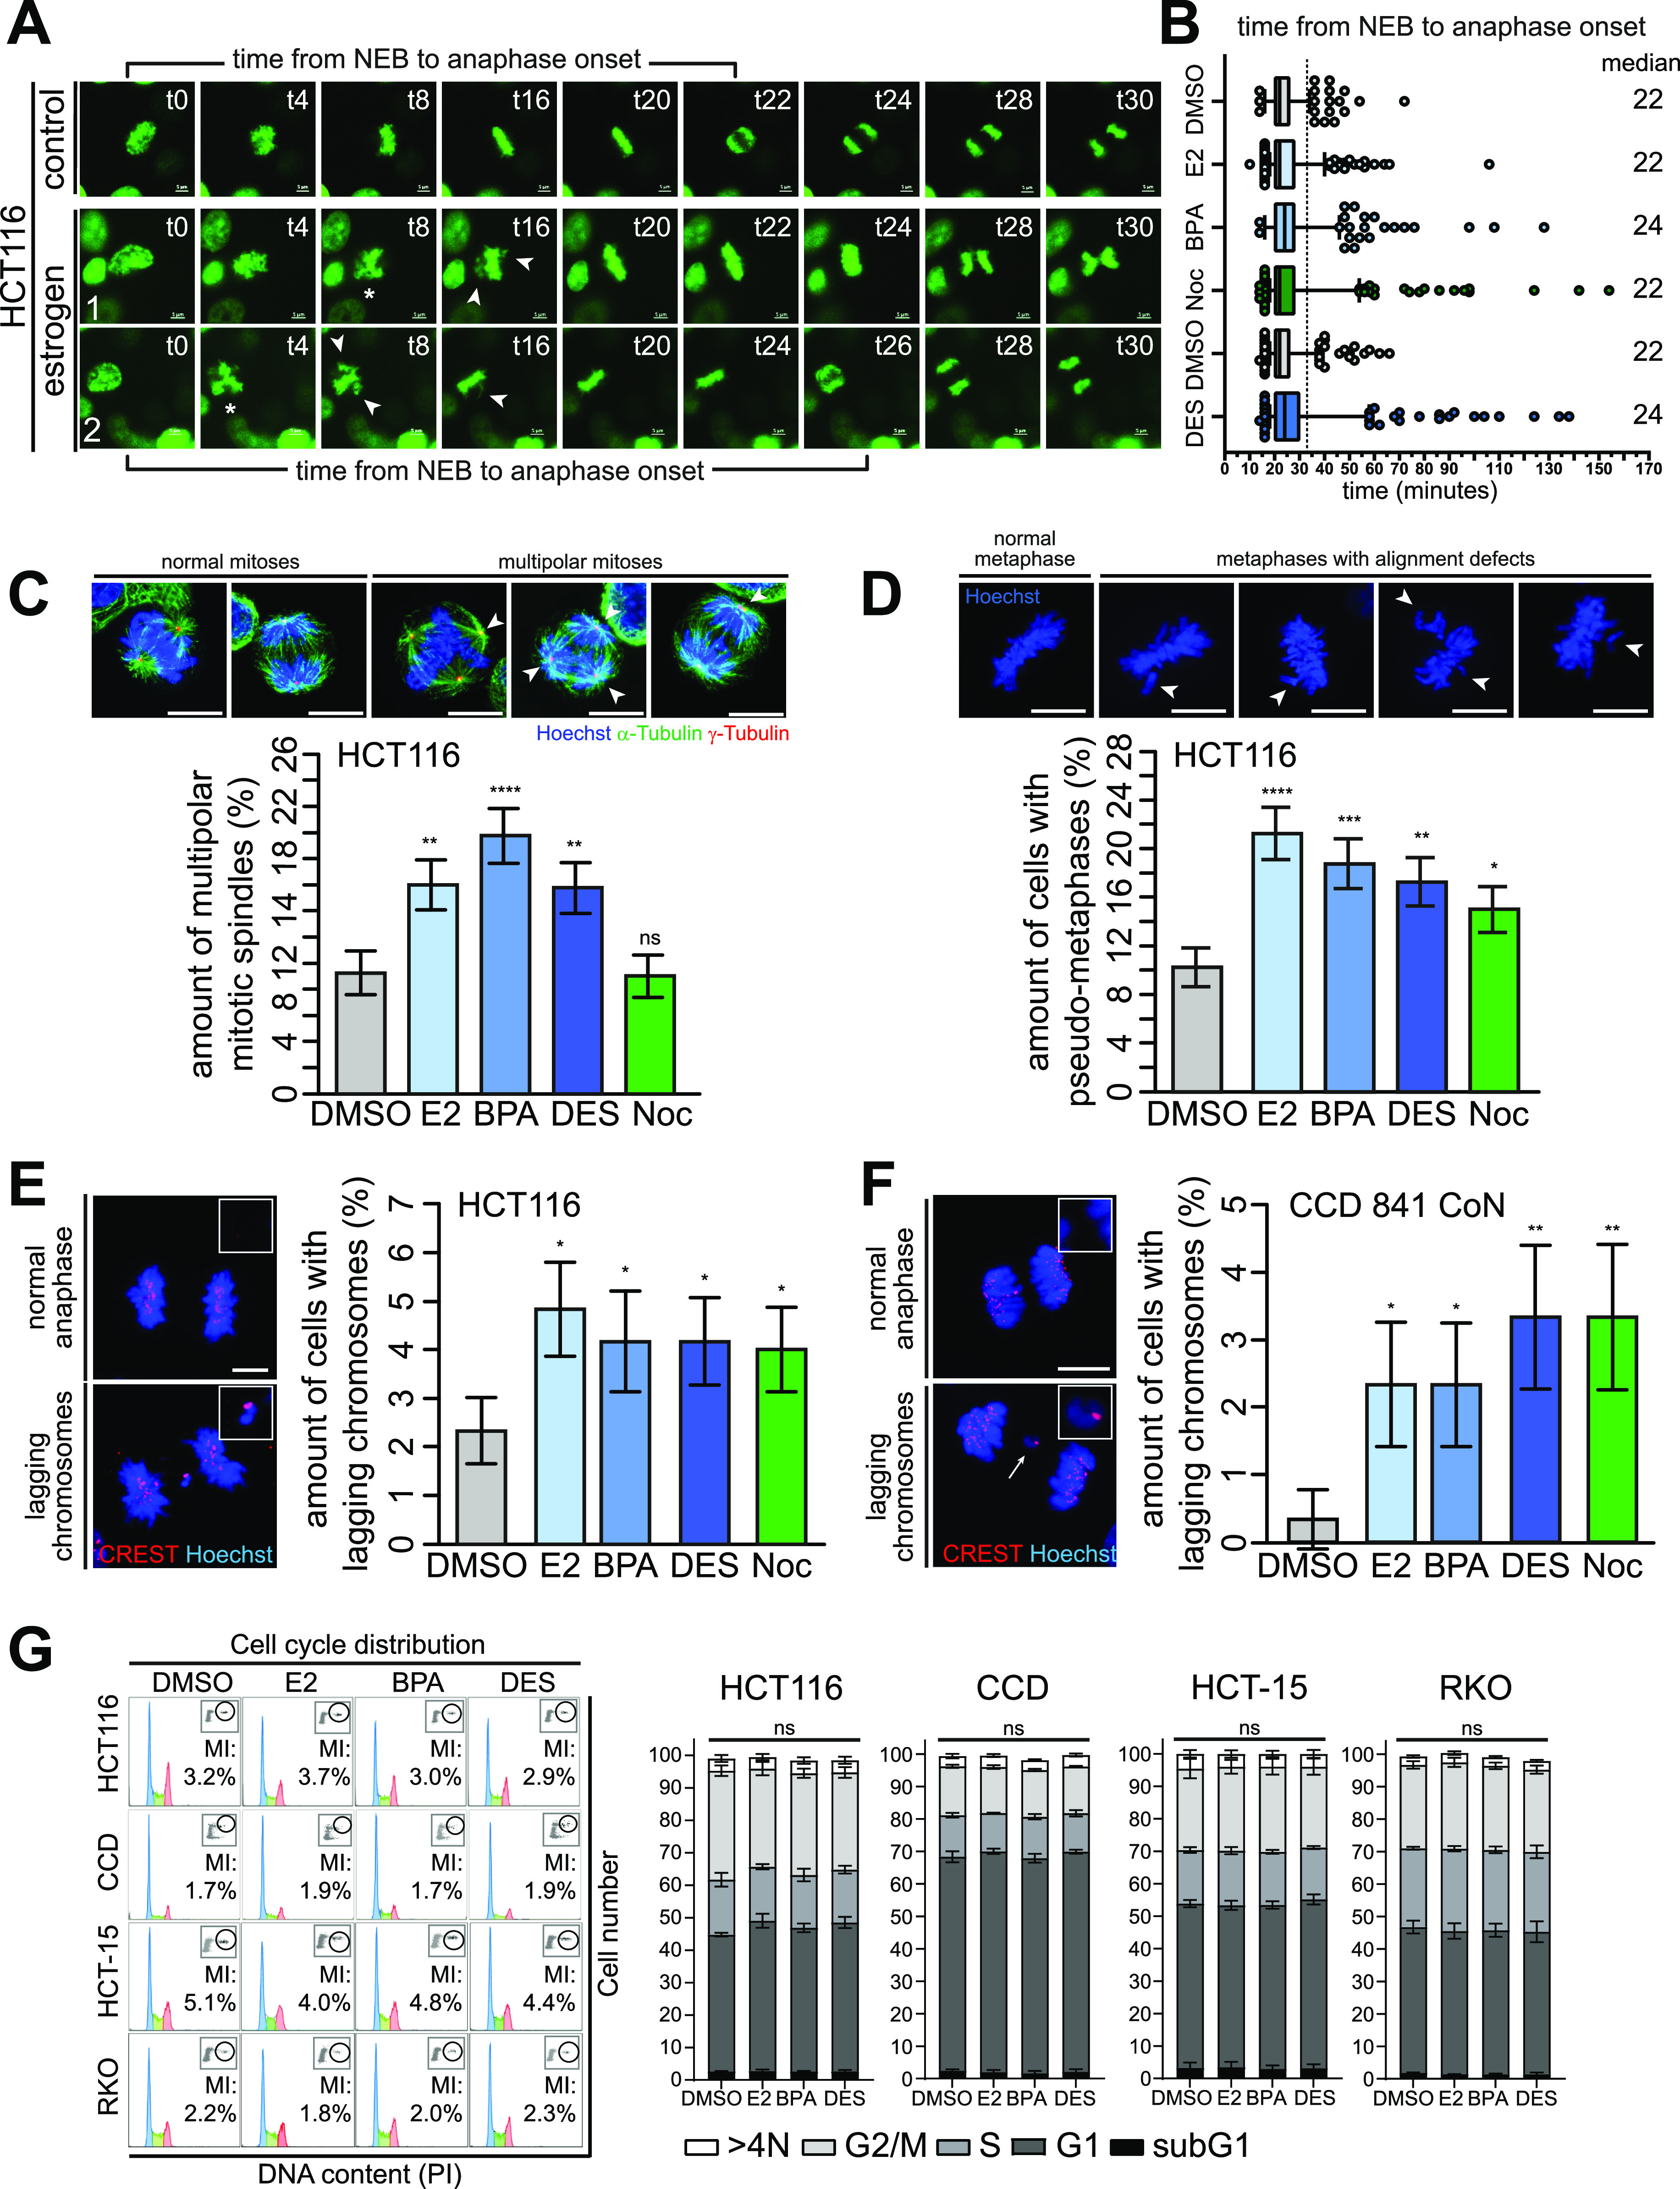
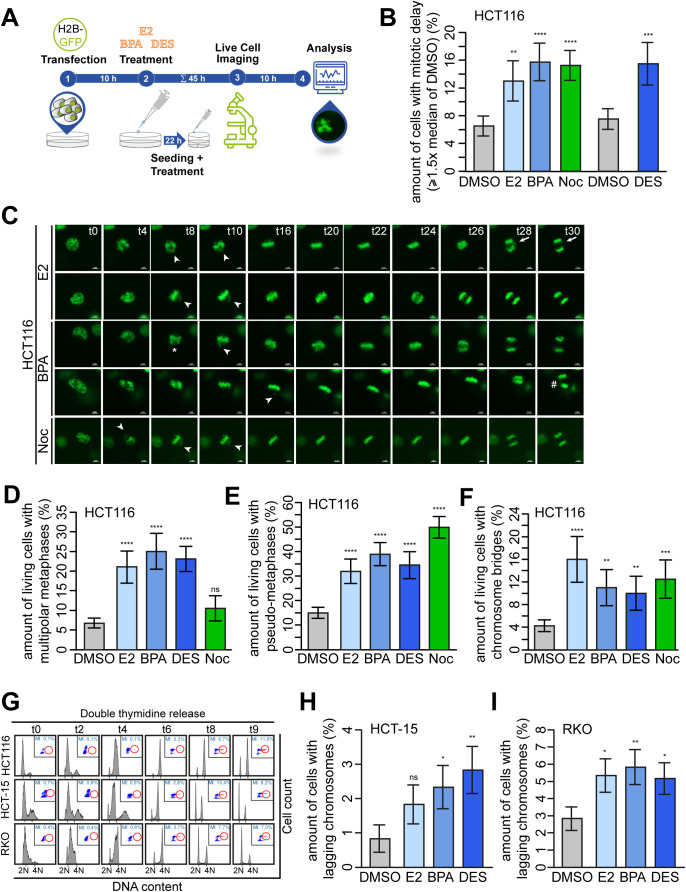
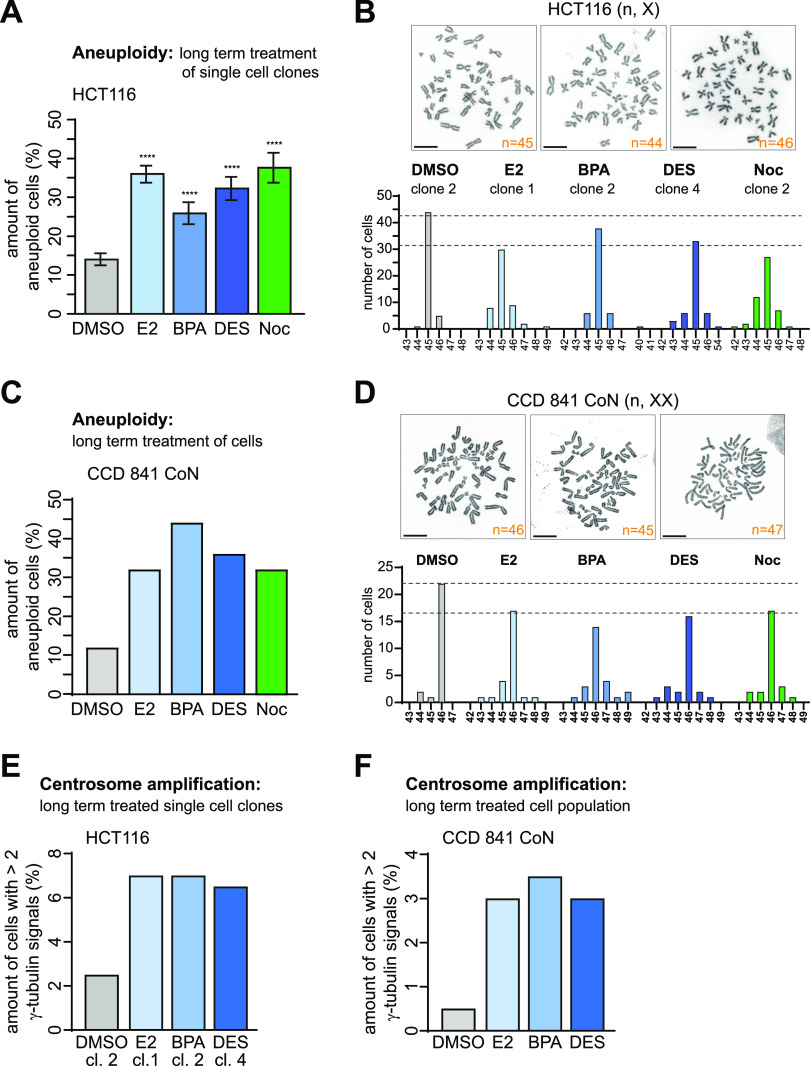
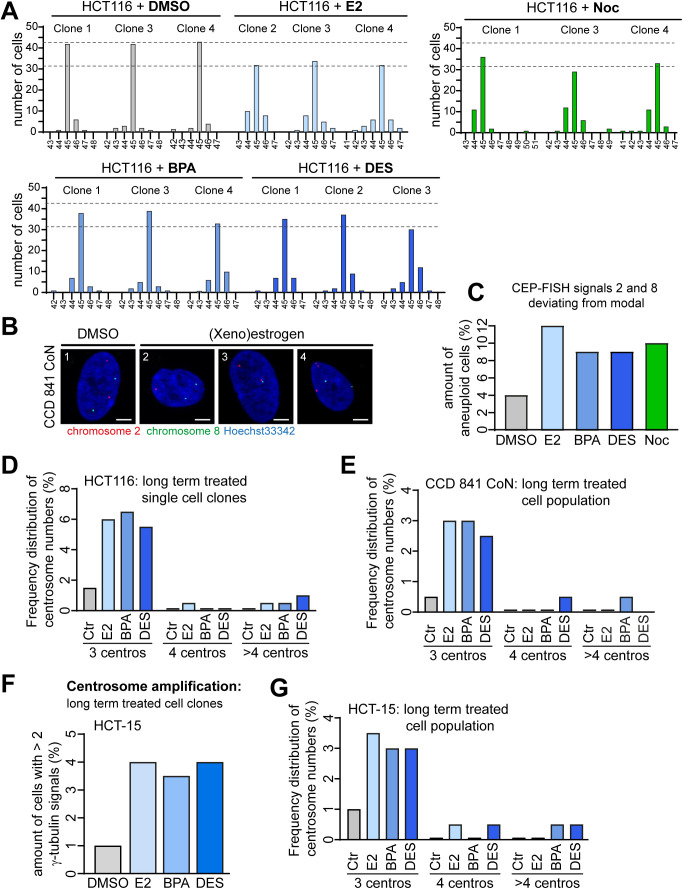
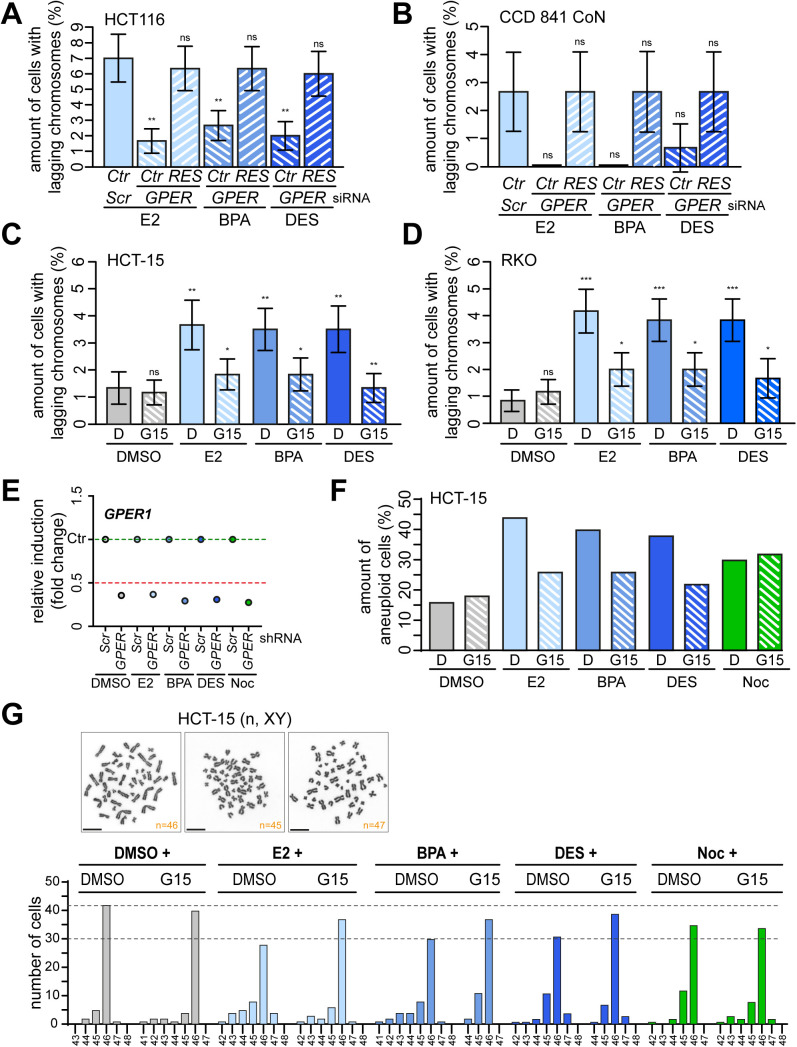
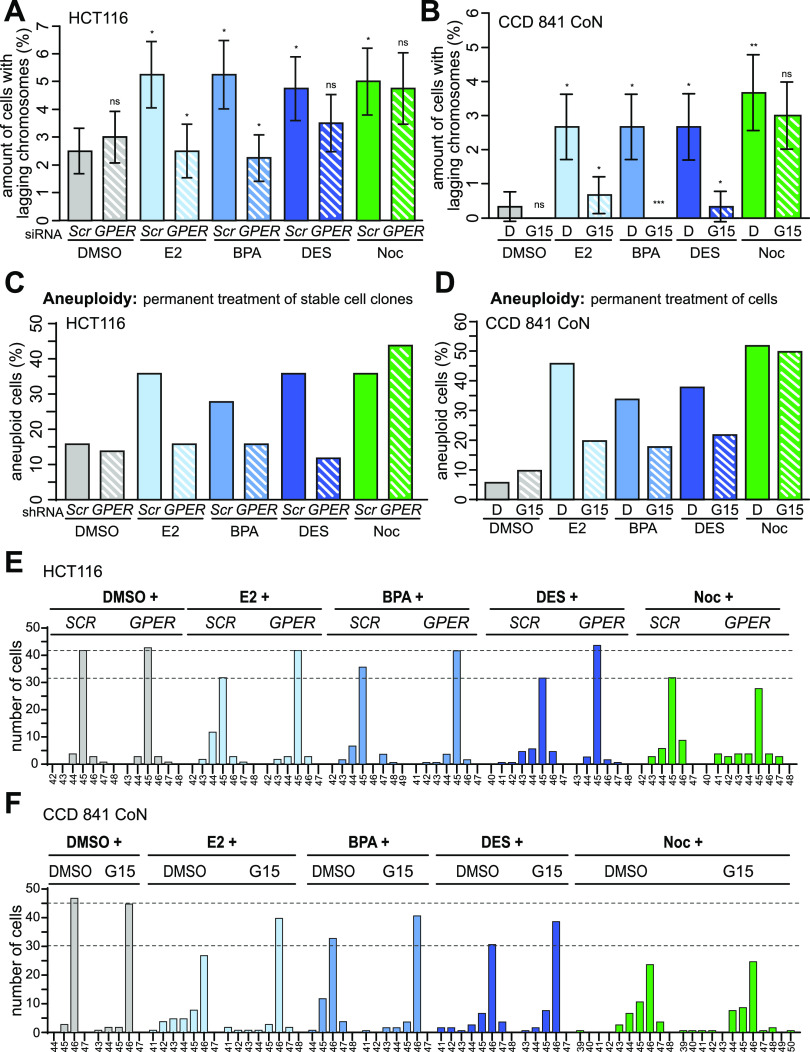
The role of the alternate G protein-coupled estrogen receptor 1 (GPER1) in colorectal cancer (CRC) development and progression is unclear, not least because of conflicting clinical and experimental evidence for pro- and anti-tumorigenic activities. Here, we show that low concentrations of the estrogenic GPER1 ligands, 17β-estradiol, bisphenol A, and diethylstilbestrol cause the generation of lagging chromosomes in normal colon and CRC cell lines, which manifest in whole chromosomal instability and aneuploidy. Mechanistically, (xeno)estrogens triggered centrosome amplification by inducing centriole overduplication that leads to transient multipolar mitotic spindles, chromosome alignment defects, and mitotic laggards. Remarkably, we could demonstrate a significant role of estrogen-activated GPER1 in centrosome amplification and increased karyotype variability. Indeed, both gene-specific knockdown and inhibition of GPER1 effectively restored normal centrosome numbers and karyotype stability in cells exposed to 17β-estradiol, bisphenol A, or diethylstilbestrol. Thus, our results reveal a novel link between estrogen-activated GPER1 and the induction of key CRC-prone lesions, supporting a pivotal role of the alternate estrogen receptor in colon neoplastic transformation and tumor progression.


Conflict of interest statement

The authors declare that they have no conflict of interest.

Figures

Figure S1.
Figure S1.. Low concentrations of 17β-estradiol (E2), bisphenol A (BPA), and diethylstilbestrol (DES) induce centrosome amplification.
(A, B) Concentration–response relationship of (xeno)estrogen-treated cells. HCT116 (A) and CCD 841 CoN cells (B) were cultured in a stripped FCS medium and treated with DMSO, or 10 pM–1 μM E2, BPA, or DES for 48 h. Centrosome amplification was detected by immunofluorescence microscopy. The graphs show the quantification of the amount of cells with more than two γ-tubulin signals at centrosomes (mean ± s.d., n = 3 with a total of 600 cells). Wald’s z-statistics computed by the R function glmmTMB was used to calculate the P-value. ns, not significant; *P < 0.05; **P < 0.01; and ****P < 0.0001. (C, D) Quantification of the amount of cells with more than two γ-tubulin signals at interphase centrosomes upon the treatment of HCT116 (C) or CCD 841 CoN cells (D) with DMSO, or 10 nM E2, BPA, or DES for 2, 4, or 6 d (mean ± s.d., n = 3 with a total of 600 cells). ANOVA was used to calculate the P-value for each treatment within 2–6 d. Wald’s z-statistics computed by the R function glmmTMB was used to calculate the P-value of each treatment compared with the respective DMSO control. ns, not significant; **P < 0.01 and ***P < 0.001. (E) Quantification of the amount of interphase cells with more than two γ-tubulin signals at centrosomes upon the overexpression of PLK4 in HCT116 cells (mean ± s.d., n = 3 with a total of 600 cells). Wald’s z-statistics computed by the R function glmmTMB was used to calculate the P-value. The representative Western blot shows the Plk4 protein level in HCT116 cells expressing PLK4 (pCMV-flag-PLK4). ****P < 0.0001. (F) HCT116 cells were treated with the estrogenic substance atrazine (Atra) or substances being structurally related to steroid hormones (cholesterol and dexamethasone) for 48 h, and the amount of interphase cells with more than two γ-tubulin signals at centrosomes was quantified. BPA or DES served as a control (mean ± s.d., n = 3 with a total of 600 cells). Wald’s z-statistics computed by the R function glmmTMB (for HCT116) was used for BPA and DES treatment. ANOVA was used for the remaining treatments. (G) CCD 841 CoN cells were treated with 10 nM cholesterol, 10 μM dexamethasone, and 10 μM atrazine (Atra) for 48 h, and the amount of interphase cells with more than two γ-tubulin signals at centrosomes was quantified. BPA or DES served as a control (mean ± s.d., n = 3 with a total of 600 cells). The bootstrap procedure was used for BPA and DES treatment. ANOVA was used for the remaining treatments. (H, I, J, K) Detection and quantification of interphase cells with centriole-positive centrosome amplification. HCT116 (H), CCD 841 CoN (I), RKO (J), and HCT-15 cells (K) were cultured and treated as in (A, B), and centriole-positive centrosome amplification was detected by immunofluorescence microscopy. Representative images of cells with or without amplified centrosomes are shown (centrioles, CP110, green; centrosomes, γ-tubulin, red; nuclei, Hoechst 33342, blue; scale bar, 10 μm). Insets show enlarged γ-tubulin, CP110, and merged signals. The graphs show the quantification of the amount of cells with more than two centrosomes with co-localized γ-tubulin and CP110 signals (mean ± s.d., n = 3 with a total of 600 cells). Wald’s z-statistics computed by the R function glmmTMB was used to calculate the P-value. ns, not significant; *P < 0.05; **P < 0.01; ***P < 0.001; and ****P < 0.0001. A detailed description of statistics is provided in the Materials and Methods section. P-values are available for this figure.
Figure 1.
Figure 1.. 17β-Estradiol, bisphenol A, and diethylstilbestrol induce centrosome amplification in human colon cells.
(A, B, C, D) Detection and quantification of interphase cells with (xeno)estrogen-triggered centrosome amplification. HCT116 (A), CCD 841 CoN (B), RKO (C), and HCT-15 cells (D) were cultured in a stripped FCS medium and treated with DMSO, or 10 nM 17β-estradiol, bisphenol A, or diethylstilbestrol for 48 h. Centrosome amplification was detected by immunofluorescence microscopy. Representative images of cells with or without amplified centrosomes are shown (centrosomes, γ-tubulin, red; microtubules, α-tubulin, green; nuclei, Hoechst 33342, blue; scale bar, 10 μm). Insets show enlarged γ-tubulin signals. The graphs show the quantification of the amount of cells with more than two γ-tubulin signals at centrosomes (mean ± s.d., n = 5 with a total of 1,000 cells (A, B) and n = 3 with a total of 600 cells (C, D)). Wald’s z-statistics computed by the R function glmmTMB was used to calculate the P-value. *P < 0.05; **P < 0.01; ***P < 0.001; and ****P < 0.0001. (E, F, G, H) Detection and quantification of interphase cells with centriole-positive centrosome amplification. (HCT116 (E), CCD 841 CoN (F), RKO (G), and HCT-15 cells (H) were cultured and treated as in (A, B, C, D), and centriole-positive centrosome amplification was detected by immunofluorescence microscopy. Representative images of cells with or without amplified centrosomes are shown (centrioles, Cep135, red; centrosomes, γ-tubulin, green; nuclei, Hoechst 33342, blue; scale bar, 10 μm). Insets show enlarged γ-tubulin, Cep135, or merged signals. The graphs show the quantification of the amount of cells with more than two centrosomes with co-localized γ-tubulin and Cep135 signals (mean ± s.d., n = 3 with a total of 600 cells (E), n = 3 with a total of 1,200 cells (F), and n = 4 with a total of 800 cells (G, H)). Wald’s z-statistics computed by the R function glmmTMB was used to calculate the P-value. *P < 0.05; **P < 0.01; ***P < 0.001; and ****P < 0.0001. A detailed description of statistics is provided in the Materials and Methods section. P-values are available for this figure.
Figure 2.
Figure 2.. (Xeno)estrogens trigger centriole overduplication.
(A, B, C) Frequency distribution of centrosome or centriole numbers of (xeno)estrogen-treated HCT116, CCD 841 CoN, HCT-15, and RKO cells. Cells were cultured in a stripped FCS medium and treated with DMSO, or 10 nM 17β-estradiol (E2), bisphenol A (BPA), or diethylstilbestrol (DES) for 48 h. The tables show the quantification of the amount of cells with 3, 4, or more than 4 γ-tubulin (A), CP110 (B), or Cep135 signals (C) at interphase centrosomes derived from Figs 1 and S1H–K. (mean ± s.d., n = 5 with a total of 1,000 cells [(A), HCT116 and CCD 841 CoN] and n = 3 with a total of 600 cells [(A), HCT-15 and RKO]; n = 3 with a total of 600 cells (B); and n = 3 with a total of 600 cells [(C), HCT116] or 1,200 cells [(C), CCD 841 CoN] and n = 4 with a total of 800 cells [(C), HCT-15 and RKO]. (D) Quantification of the amount of cells with more than two γ-tubulin signals at interphase centrosomes upon the repression of PLK4 in HCT116 cells and concomitant treatment with E2, BPA, or DES (mean ± s.d., n = 3 with a total of 600 cells). ANOVA was used to calculate the P-value of DMSO + PLK4 siRNA. Wald’s z-statistics computed by the R function glmmTMB was used to calculate the P-value of the remaining treatments. ns, not significant; **P < 0.01. (E) Graphical scheme for “templated centriole overduplication” (experimental design and hypothesized outcome). Cells were synchronized at G1/S after release in DMSO, or 10 nM E2, BPA, or DES for 135 min. S-phase cells were fixed and stained with markers for γ-tubulin and Sas-6 to visualize centrosomes and daughter centrioles, respectively. Fluorescence intensities of Sas-6 at S-phase centrosomes were measured using the CellProfiler software (F). Centriole overduplication originates from parental centrioles (1) templating the assembly of more than 1 daughter centriole during S phase (upper centrioles panel, [2]), which elongates in G2 (3) and segregates to the mitotic spindle pole (left centrioles panel at metaphase, [4]). After disengagement of centrioles during late mitosis, centrioles split apart, thereby generating daughter cells with more than two centrioles (cell 1). See a detailed description in the Materials and Methods section. (F) Shown are maximum projections from z-stacks of representative HCT116 cells treated with DMSO or 10 nM BPA as described in (E). Sas-6 fluorescence intensities (inner circles) were normalized to γ-tubulin and background-corrected (outer circle) using the CellProfiler software. Insets show Sas-6 signals at higher magnification with the corresponding values (highlighted in blue) on the right side. Scale bar, 10 µm. (G) Fluorescence intensity of SAS-6 was quantified and plotted from (F). Geometric mean ± 95% CI, n = 3 with a total of 681 cells (HCT116) or 676 cells (HCT-15) from three independent experiments. Mann–Whitney’s test was used to calculate the P-value. ns, not significant; *P < 0.05; ***P < 0.001; and ****P < 0.0001. A detailed description of statistics is provided in the Materials and Methods section. P-values are available for this figure.
Figure S2.
Figure S2.. (Xeno)estrogens cause odd numbers of centrosomes with equally segregated daughter centrioles.
(A) Representative FACS histograms (left) of HCT116 and HCT-15 cells released from a double thymidine block in fresh culture medium for 135 min to achieve a synchronous S-phase population. The histograms show the cell cycle distribution of propidium iodide–stained cells. The graphs (right) show the quantification of the amount of cells in the subG1 area, or G1, S, or G2 phase based on their DNA content (N). >4N = polyploid cells (mean ± SEM, n = 2 with a total of 30,000 cells). (B) Graphical scheme for the loss of centriole segregation at the M-phase onset, which could indicate premature centriole disengagement (experimental design and hypothesized outcome). Cells were synchronized at G1/S and released in a fresh culture medium with stripped FCS for 4.5 h (to allow entry into the G2 phase). The synchronous G2 cell population was treated with DMSO, or 10 nM E2, BPA, or DES for 4 h. Cells were fixed and co-stained with Hoechst 33342 to detect metaphase cells, and with markers for γ-tubulin and Sas-6 to visualize centrosomes and daughter centrioles, respectively. The loss of centriole segregation during early mitosis would originate from parental centrioles (1) properly templating the assembly of one daughter centriole each during S phase (2), which elongates in G2 (3) but then splits apart (i.e., disengage prematurely) before anaphase onset (4). Freestanding centrioles most likely scattered around the spindle (78) (5), resulting in uneven segregation during cell division and promoting the formation of additional spindle poles in the next cell cycle (6). Note that Sas-6 would not coincide with PCM markers, suggesting premature disengagement. See a detailed description in the Materials and Methods section. (C, D) Shown are maximum projections from the z-stacks of representative HCT116 (C) and HCT-15 cells (D) treated with DMSO or 10 nM bisphenol A (BPA) and stained for γ-tubulin (red), SAS-6 (green), and chromosomes (blue). Insets show Sas-6 and γ-tubulin signals of both spindle poles (designated with 1 and 2) at higher magnification. Scale bar, 10 μm. The bar charts show the quantification of the amount of cells with Sas-6–positive metaphase centrosomes to detect unevenly segregated daughter centrioles. HCT116 (C) and HCT-15 (D) cells were processed as described in (B), and treated with DMSO, or 10 nM 17β-estradiol (E2), BPA, or diethylstilbestrol (DES) from G2 to M phase (mean ± s.d., n = 3 with a total of 600 cells). (E, F) Graphs show the quantification of background-corrected Sas-6 fluorescence intensities normalized to γ-tubulin after treatment of cells with DMSO, or 1 μM E2, BPA, or DES (geometric mean ± 95% CI, n = 1 from five different coverslips, with a total of 364 (DMSO), 311 (E2), 339 (BPA), and 285 (DES) cells for HCT116, and 445 (DMSO), 399 (E2), 384 (BPA), and 411 (DES) cells for HCT-15). Mann–Whitney’s test was used to calculate the P-value. ns, not significant; *P < 0.05 and **P < 0.01. See Fig 2F and G for a detailed description of the experimental design. A detailed description of statistics is provided in the Materials and Methods section. P-values are available for this figure.
Figure S3.
Figure S3.. Confirmation of GPER1 but not ERα/β-specific centrosome amplification upon estrogen treatment.
(A) Western blot of ERα, ERα variants (long isoform, 66 kD; ER46, 48 kD; and ER36, 36 kD (22)), ERβ, and GPER1 protein in MCF-7, CCD 841 CoN, RKO, HCT-15, HCT116, and ERβ-expressing HCT116 cells. α-Tubulin and α-vinculin served as a control. (B) Expression of CTSD, IGFBP6, ERBB2, and TGM2 mRNA in HCT116 cells upon treatment with 17β-estradiol (E2), bisphenol A (BPA), or diethylstilbestrol (DES) for 48 h. mRNA expression was normalized to the housekeeper GAPDH and the control (DMSO). Each data point represents the median with 95% CI of three independent experiments. Values of the DMSO controls are the same for each gene. (C) Expression of CTSD mRNA in HCT116 control and ERα- or ERβ-expressing cells upon treatment with E2, BPA, or DES for 48 h. mRNA expression was normalized to the housekeeper GAPDH and the control (empty vector treated with DMSO). Each data point represents the median with 95% CI of three independent experiments. (D) Western blot of GPER1 protein in HCT116 cells in the presence or absence of GPER1 repression via gene-specific siRNA. Relative protein levels of GPER1 normalized to β-actin and the control (LUC) are shown. (E) Expression of GPER1 mRNA in HCT116 (left), CCD 841 CoN (middle), or HCT-15 cells (right) upon GPER1 repression via gene-specific siRNA and concomitant treatment with E2, BPA, or DES for 48 h. mRNA expression was normalized to the housekeeper GAPDH and the control (SCRAMBLED siRNA). Each data point represents the median with 95% CI of three independent experiments. (F) Relative mRNA expression of GPER1 was determined by quantitative real-time PCR using GPER1 primer #2, and normalized to the endogenous control GAPDH. Each bar represents the mean ± SD of three (HCT116) or two (CCD 841 CoN) experiments. Left axis: bars 1–4; right axis: bars 5–7. (G, H) Verification of the dependency on GPER1 and the specificity of the GPER1 knockdown in HCT116 (G) and CCD 841 CoN cells (H). Cells were co-transfected with control (SCR) or GPER1-specific siRNAs (GPER) and an empty vector (Ctr) or siRNA-resistant version of GPER1 (RES), and the amount of cells with more than two γ-tubulin signals at interphase centrosomes was quantified in the absence (DMSO) or presence of 10 nM E2, BPA, or DES treated for 48 h (mean ± s.d., n = 3 with a total of 600 cells). Wald’s z-statistics computed by the R function glmmTMB was used to calculate the P-value. ns, not significant; **P < 0.01. (I) Quantification of the amount of HCT-15 cells with more than two γ-tubulin signals at interphase centrosomes, upon GPER1 repression in the absence (DMSO) or presence of E2, BPA, or DES treated for 48 h (mean ± s.d., n = 3 with a total of 600 cells). ANOVA was used to calculate the P-value of DMSO + G15. Wald’s z-statistics computed by the R function glmmTMB was used to calculate the P-value of the remaining treatments. ns, not significant; *P < 0.05 and **P < 0.01. (K) HCT-15 cells were pretreated with 100 nM G15 for 30 min before additional exposure to DMSO, 10 nM E2, BPA, or DES for 48 h, and the amount of cells with more than two γ-tubulin signals at interphase centrosomes was quantified (mean ± s.d., n = 3 with a total of 600 cells). ANOVA was used to calculate the P-value of DMSO + G15. Wald’s z-statistics computed by the R function glmmTMB was used to calculate the P-value of the remaining treatments. ns, not significant; **P < 0.01 and ***P < 0.001. (J) HCT116 cells were treated with ICI182780 (ICI) or tamoxifen (Tam) for 48 h, and the amount of cells with more than two γ-tubulin signals at interphase centrosomes was quantified (mean ± s.d., n = 3 with a total of 600 cells). Wald’s z-statistics computed by the R function glmmTMB was used to calculate the P-value. *P < 0.05 and ***P < 0.001. (L) CCD 841 CoN cells were treated with ICI182780 (ICI) or tamoxifen (Tam) for 48 h, and the amount of cells with more than two γ-tubulin signals at interphase centrosomes was quantified (right panel) (mean ± s.d., n = 3 with a total of 600 cells). Values for DMSO are the same as for DMSO in Fig 2F. Wald’s z-statistics computed by the R function glmmTMB was used to calculate the P-value. *P < 0.05 and **P < 0.01. A detailed description of statistics is provided in the Materials and Methods section. P-values are available for this figure.
Figure 3.
Figure 3.. Centrosome amplification depends on activated GPER1 without effects on cell proliferation.
(A, B) Quantification of centrosome amplification upon GPER1 knockdown. (A, B) HCT116 (A) and CCD 841 CoN cells (B) were transiently transfected with SCRAMBLED (Scr) or GPER1-specific siRNA (GPER) following treatment with DMSO, or 10 nM 17β-estradiol (E2), bisphenol A (BPA), or diethylstilbestrol (DES) for 48 h. The amount of interphase cells with more than two γ-tubulin signals at centrosomes was quantified (mean ± s.d., n = 3 with a total of 600 cells (A) and n = 4 with a total of 800 cells (B)). ANOVA was used to calculate the P-value of DMSO + GPER1 siRNA. Wald’s z-statistics computed by the R function glmmTMB was used to calculate the P-value of the remaining treatments. (C, D) Quantification of centrosome amplification upon GPER inhibition. HCT116 (C) and CCD 841 CoN cells (D) were pretreated with 100 nM G15 or G36 for 30 min before additional exposure to DMSO, or 10 nM E2, BPA, or DES for 48 h. The amount of interphase cells with more than two γ-tubulin signals at centrosomes was quantified (mean ± s.d., n = 3 with a total of 600 cells). ANOVA was used to calculate the P-value of E2 + G15 and G36. Wald’s z-statistics computed by the R function glmmTMB was used to calculate the P-value of the remaining treatments. (E, F) Quantification of centrosome amplification upon GPER activation. HCT116 (E) and CCD 841 CoN cells (F) were treated with 100 nM G-1 for 48 h, and the amount of interphase cells with more than two γ-tubulin signals at centrosomes was quantified (mean ± s.d., n = 3 with a total of 600 cells. Values for the DMSO control in (F) are the same as for DMSO treatment in Fig S2I). Wald’s z-statistics computed by the R function glmmTMB was used to calculate the P-value. (A, B, C, D, E, F) ns, not significant; *P < 0.05; **P < 0.01; ***P < 0.001; and ****P < 0.0001. (G, H) Proliferation assay in the presence of DMSO, or 10 nM E2, BPA, or DES for 7 d, with or without 30-min pretreatment with 100 nM G15. 5 × 10⁴ HCT116 (G) and 1 × 10⁵ CCD 841 CoN cells (H) were seeded per six-well plates and manually quantified every day using a hemacytometer and by trypan blue exclusion of dead cells (mean and error ± SEM, n = 4 for E2, BPA, and DES panels, n = 3 for G1 panel (G), and n = 5 for all treatments (H)). A detailed description of statistics is provided in the Materials and Methods section. P-values are available for this figure.
Figure 4.
Figure 4.. GPER1-activating estrogens induce multipolar mitoses and lagging chromosomes without altering cell cycle distribution.
(A, B) Disturbance of mitotic progression by treatment with (xeno)estrogens. (A) HCT116 cells expressing GFP-tagged histone H2B were treated with DMSO, or 10 nM 17β-estradiol, bisphenol A, or diethylstilbestrol, or 5 nM nocodazole (Noc) for 40 h after live-cell imaging for 8 h under continuous treatment. Still frames were shown from time-lapse movies of representative cells treated with DMSO, bisphenol A (#1), or diethylstilbestrol (#2). Images were captured every 2 min to monitor mitotic progression. Stars point to cells with multipolar chromosome arrangement, and arrowheads, to unaligned chromosomes (t = time in minutes). Scale bars, 5 μm. (B) Time from nuclear envelope breakdown to anaphase onset was determined from (xeno)estrogen-treated (10 nM each) and Noc-treated (5 nM) cells (median, box and whiskers, 5–95 percentile, n = 4 with a total of 400 cells). (C, D) Detection and quantification of HCT116 cells with multipolar spindles (C) and pseudo-metaphases (D). Cells treated as in (A) were synchronized in mitosis with a double thymidine block as described in (9). Representative immunofluorescence images show cells with or without multipolar mitotic spindles (C) or chromosome alignment defects (D) (chromosomes, Hoechst 33342, blue; centrosomes, γ-tubulin, red; spindles, α-tubulin, green; scale bar, 10 μm). Arrowheads mark extra centrosomes (C) and unaligned chromosomes of pseudo-metaphases (D). The graphs show the quantification of the proportion of cells exhibiting the respective mitotic defect as indicated (mean ± s.d., n = 4 with a total of 400 cells). Wald’s z-statistics computed by the R function glmmTMB was used to calculate the P-value. ns, not significant; (*P < 0.05; **P < 0.01; ***P < 0.001; and ****P < 0.0001). (E, F) Detection and quantification of anaphase cells with lagging chromosomes. Colon (cancer) cells were treated as in (A) and synchronized in the anaphase of mitosis with a double thymidine block as described in (9) (HCT116, (E)) or left grown asynchronously for 48 h (CCD 841 CoN, (F)). Representative immunofluorescence images with or without lagging chromosomes are shown (chromosomes, Hoechst 33342, blue; kinetochores, CREST, red; scale bar, 10 μm). Insets show lagging chromosomes at higher magnification. Only kinetochore-positive chromosomes were counted as lagging chromosomes (arrows). Graphs show the quantification of the proportion of cells exhibiting lagging chromosomes (mean ± s.d., (D) n = 6 with a total of 600 cells, Wald’s z-statistics computed by the R function glmmTMB was used to calculate the P-value, and (E) n = 3 with a total of 300 cells). The bootstrap procedure was used to calculate the P-value. (*P < 0.05 and **P < 0.01). (G) Representative FACS histograms (left) of HCT116, CCD 841 CoN (CCD), HCT-15, and RKO cells treated as in (A) for 48 h showing cell cycle distribution and mitotic indices (MI) of propidium iodide and MPM2–co-immunostained cells. Blue, G1 phase; green, S phase; and red, G2 phase. The graphs (right) show the quantification of the amount of cells in the subG1 area, and G1, S, or G2 phase based on their DNA content (N). >4N = polyploid cells (mean ± SEM, n = 3 with a total of 30,000 cells, ordinary one-way ANOVA). A detailed description of statistics is provided in the Materials and Methods section. P-values are available for this figure.
Figure S4.
Figure S4.. 17β-estradiol (E2), bisphenol A (BPA), and diethylstilbestrol (DES) perturb mitotic progression that causes lagging chromosomes.
(A) Graphical scheme of the experimental design for the time-lapse microscopy experiments. HCT116 cells were transfected with GFP-tagged histone H2B. At 5 h after transfection, cells were seeded in 12-well plates and treated with DMSO, 10 nM E2, BPA, DES, or 5 nM nocodazole after an additional 4 h. 22 h after treatment, cells were seeded in 35-mm dishes with four compartments in a medium supplemented with ligands and cultured overnight. To remove floating cells that interfere with live-cell imaging, cells were carefully washed once with prewarmed culture medium 17 h after seeding, after treatment with ligands as before. A total of 54 h after transfection and 45 h after treatment with ligands (including 1 h before the start of imaging to ensure equilibration), cells were placed in the prewarmed microscope and live-cell imaging was performed overnight (10 h total). (B) Quantification of the amount of cells from Fig 4B with a time from NEB to anaphase greater than or equal to 1.5-fold of the median time observed in the DMSO control (median, ± s.d., n = 4 with a total of 400 cells). Wald’s z-statistics computed by the R function glmmTMB was used to calculate the P-value. **P < 0.01; ***P < 0.001; and ****P < 0.0001. (C) HCT116 cells expressing GFP-tagged histone H2B were treated with DMSO, or 10 nM E2, BPA, or DES, or 5 nM nocodazole (Noc) for 45 h and subsequently live-cell imaged for 8 h under continuous treatment. Still frames were shown from time-lapse movies of representative cells treated with E2, BPA, or Noc. Images were captured every 2 min to monitor mitotic progression. Stars point to cells with multipolar chromosome arrangement; arrowheads, to unaligned chromosomes; arrows, to chromosome laggards; and the hash, to chromosome bridge (t = time in minutes). Scale bars, 5 μm. (D, E, F) Quantification of the amount of HCT116 cells treated with DMSO, 10 nM E2, BPA, DES, or 5 nM Noc and processed as described in (A), showing multipolar metaphases (D), pseudo-metaphases (E), and chromosome bridges (F). Cells were analyzed from live-imaged video frames from Figs 4A and S4C (mean ± s.d., n = 4 with a total of 200 cells for DMSO and 100 cells for the remaining treatments). Wald’s z-statistics computed by the R function glmmTMB was used to calculate the P-value. ns, not significant; **P < 0.01; ***P < 0.001; and ****P < 0.0001. (G) HCT116 (upper panel), HCT-15 (middle panel), and RKO (lower panel) cells were cultured in a stripped FCS medium and treated with DMSO, 10 nM E2, BPA, or DES. Examples of FACS histograms of a time-course experiment showing treated cells released from a double thymidine block and progressing through S, G2, and M phases as described in (6). The highest mitotic index suitable for the detection of anaphase laggards was revealed at 8–9 h after release. N = DNA content. (H, I) HCT-15 (H) and RKO cells (I) were treated as in (D, E, F). Quantification of the amount of anaphase lagging chromosomes in anaphase cells (mean ± s.d., n = 3 with a total of 600 cells). Wald’s z-statistics computed by the R function glmmTMB was used to calculate the P-value. ns, not significant; *P < 0.05 and **P < 0.01. A detailed description of statistics is provided in the Materials and Methods section. P-values are available for this figure.
Figure 5.
Figure 5.. (Xeno)estrogens induce whole chromosomal instability in human colon and CRC cells with supernumerary centrosomes.
(A) Chromosome number variability/aneuploidy of single-cell clones derived from HCT116 cells treated with DMSO, 10 nM 17β-estradiol, bisphenol A, diethylstilbestrol, or 5 nM nocodazole (Noc) and grown in a stripped FCS medium for 30 generations. The graph shows the amount of cells harboring a karyotype with chromosome numbers deviating from the modal (mean ± s.d., n = 4 independent single-cell clones with 50 cells per treated clone). Wald’s z-statistics computed by the R function glmmTMB was used to calculate the P-value. The modal chromosome number of HCT116 is 45. (B) Representative examples of the karyotype derived from HCT116 metaphase chromosome spreads showing a normal (45,X) and an aneuploid (44,X; 46,X) karyotype are shown. Scale bar, 10 µm. The graph shows chromosome number variability (whole chromosomal instability) of representative cell clones derived from HCT116 parental cells depicted from (A). For each cell clone, the distribution of individual chromosome numbers was determined from 50 metaphase spreads. (C) Chromosome number variability/aneuploidy of CCD 841 CoN cells treated as in (A) for 30 d. The graph shows the amount of cells harboring a karyotype with chromosome numbers deviating from the modal (n = 1 biological replicate with 25 cells per condition). The modal chromosome number of CCD 841 CoN is 46. (D) Representative examples of the karyotype derived from CCD 841 CoN metaphase chromosome spreads showing a normal (46,XX) and aneuploid karyotype (45,XX; 47,XX). Scale bar, 10 µm. The graph shows chromosome number variability (whole chromosomal instability) of CCD 841 CoN depicted from (C). For each condition, the distribution of individual chromosome numbers was determined from 25 metaphase spreads. (E, F) Centrosome number evolution in colon (cancer) cells after long-term (xeno)estrogen treatment. The graphs show the quantification of cells with more than two γ-tubulin signals at centrosomes. (E) Cells shown represent representative clones used for karyotype analysis depicted in (A). DMSO, clone 2; 17β-estradiol, clone 1; bisphenol A, clone 2; and diethylstilbestrol, clone 4 (mean, n = 1 biological replicate with 200 cells per condition). (F) Cells analyzed were derived from the cell population used for karyotype analysis depicted in (C) (mean, n = 1 biological replicate with 200 cells per condition). A detailed description of statistics is provided in the Materials and Methods section. P-values are available for this figure.
Figure S5.
Figure S5.. (Xeno)estrogen-triggered centrosome amplification affects karyotype stability.
(A) Karyotype analyses of independent cell clones derived from HCT116 parental cells cultured in a stripped FCS medium and grown in the presence of DMSO (clones 1, 3, and 4), 10 nM 17β-estradiol (E2, clones 2, 3, and 4), bisphenol A (BPA, clones 1, 3, and 4), diethylstilbestrol (DES, clones 1, 2, and 3), or 5 nM nocodazole (Noc, clones 1, 3, and 4) for 30 generations. For each cell clone, the distribution of individual chromosome numbers was determined from 50 metaphase spreads. The modal chromosome number of HCT116 is 45. (B) Representative images of nuclei (blue) with a normal number of Cep-FISH signals for chromosomes 2 (red) and 8 (green) (no. 1) or aneuploid karyotypes showing less (no. 2 and no.3) or more signals as the modal (no. 4). (C) The graph shows the determination of chromosome 2 and 8 number variability/aneuploidy within the karyotype of CCD 841 CoN cells grown for 30 generations in the absence (DMSO) or presence of E2, BPA, or DES. The amount of cells showing deviations from the modal signal number of two (= aneuploidy) for each chromosome was calculated (n = 1 biological replicate with 100 cells per condition). Samples generated for metaphase chromosome spreads were used for Cep-FISH analysis (see Fig 5C and D). (D, E) Frequency distribution of centrosome numbers of DMSO-, 10 nM E2-, BPA-, or DES-treated HCT116 cell clones (D) or CCD 841 CoN cell populations (E) used for karyotype analysis (see Fig 5A and C), based on counts with γ-tubulin. The graph shows the amount of cells with 3, 4, or >4 centrosomes (mean, n = 1 biological replicate with 200 cells per condition). (F) Centrosome number evolution in HCT-15 cells after long-term (xeno)estrogen treatment. The graphs show the quantification of the amount of cells with more than two γ-tubulin signals at centrosomes. Cells shown were derived from the cell population used for karyotype analysis depicted in Fig S6F (DMSO) (mean, n = 1 biological replicate with 200 cells per condition). (G) Frequency distribution of centrosome numbers of DMSO-, 10 nM E2-, BPA-, or DES-treated HCT-15 cells used for karyotype analysis (see Fig S6F, DMSO), based on counts with γ-tubulin. The graph shows the amount of cells with 3, 4, or >4 centrosomes (mean, n = 1 biological replicate with 200 cells per condition). A detailed description of statistics is provided in the Materials and Methods section.
Figure S6.
Figure S6.. Increased karyotype variability and aneuploidy upon 17β-estradiol (E2), bisphenol A (BPA), and diethylstilbestrol (DES) depends on GPER1 activity.
(A, B) Verification of the dependency on GPER1 and the specificity of the GPER1 knockdown in HCT116 (A) and CCD 841 CoN cells (B). Cells were co-transfected with control (SCR) or GPER1-specific siRNAs (GPER) and an empty vector (Ctr) or siRNA-resistant version of GPER1 (“RES”), followed by treatment of cells with 10 nM E2, BPA, or DES and synchronization in mitosis with a double thymidine block. The amount of cells with anaphase lagging chromosomes was quantified (mean ± s.d., n = 3 with a total of 300 cells). Wald’s z-statistics computed by the R function glmmTMB was used to calculate the P-value. ns, not significant; **P < 0.01. (C, D) (xeno)estrogen-induced anaphase lagging chromosomes depend on GPER1. The graphs show the quantification of the amount of anaphase lagging chromosomes in mitotically synchronized HCT-15 (C) and RKO (D) cells pretreated with 100 nM G15 for 30 min before additional treatment with DMSO [D] or 10 nM E2, BPA, or DES for 48 h (mean ± s.d., n = 3 with a total of 600 cells). ANOVA was used to calculate the P-value of DMSO + G15. Wald’s z-statistics computed by the R function glmmTMB was used to calculate the P-value of the remaining treatments. ns, not significant; *P < 0.05; **P < 0.01; and ***P < 0.001. (E) Expression of GPER1 mRNA in HCT116 single-cell clones stably expressing shRNAs targeting GPER1 (GPER shRNA) and grown for 30 generations in DMSO, 10 nM E2, BPA, or DES. mRNA expression was normalized to the housekeeper GAPDH and the control (SCRAMBLED shRNA). (F) Amount of HCT-15 cells pretreated with 100 nM G15 for 30 min before additional treatment with DMSO [D] or 10 nM E2, BPA, DES, or 5 nM nocodazole for 30 generations. The graph shows the amount of cells harboring a karyotype with chromosome numbers deviating from the modal (modal number = 46). Data were collected from 50 cells per clone (n = 1 biological replicate). (G) Representative examples of the karyotype derived from HCT-15 metaphase chromosome spreads showing a normal (46,XY, left panel) and aneuploid (45,XY, middle panel; and 47,XY, right panel) karyotype. Scale bar, 10 μm. The graph shows the chromosome number variability/whole chromosomal instability of HCT-15 cells depicted from (F). For each condition, the distribution of individual chromosome numbers was determined from 50 metaphase spreads. The modal chromosome number of HCT-15 is 46. A detailed description of statistics is provided in the Materials and Methods section. P-values are available for this figure.
Figure 6.
Figure 6.. Mitotic laggards and whole chromosomal instability depend on estrogen-activated GPER1 function.
(A) HCT116 cells were transiently transfected with SCRAMBLED (Scr) or GPER1-specific siRNA (GPER) after treatment with DMSO, 10 nM 17β-estradiol (E2), bisphenol A (BPA), diethylstilbestrol (DES), or 5 nM nocodazole (Noc) and synchronization in the anaphase of mitosis as described in (9). The quantification of the amount of anaphase lagging chromosomes is shown (mean ± s.d., n = 4 with a total of 400 cells). ANOVA was used to calculate the P-value of DMSO + GPER1 siRNA. Wald’s z-statistics computed by the R function glmmTMB was used to calculate the P-value of the remaining treatments. ns, not significant; *P < 0.05 and **P < 0.01. (B) CCD 841 CoN cells pretreated with G15 for 30 min after additional treatment as in (A) for 48 h (median ± s.d., n = 3 with a total of 300 cells). ANOVA was used to calculate the P-value of DMSO + GPER1 siRNA and all G15 treatments. The bootstrap procedure was used to calculate the P-value of the remaining treatments. ns, not significant; *P < 0.05; **P < 0.01; and ***P < 0.001. (C) HCT116 single-cell clones stably expressing SCRAMBLED (Scr) or shRNAs targeting GPER1 (GPER) were grown for 30 generations in DMSO, 10 nM E2, BPA, DES, or 5 nM Noc. The graph shows the amount of cells harboring an aneuploid karyotype with chromosome numbers deviating from the modal (modal number = 45). Data were collected from 50 cells per clone (n = 1 biological replicate). (D) CCD 841 CoN cells pretreated with G15 for 30 min before additional exposure to DMSO, 10 nM E2, BPA, DES, or 5 nM Noc for 30 generations. The graph shows the amount of cells (N = 50) harboring an aneuploid karyotype with chromosome numbers deviating from the modal (modal number = 46); (n = 1 biological replicate). (E) Chromosome number variability/whole chromosomal instability of HCT116 cell clones depicted from (C). For each cell clone, the distribution of individual chromosome numbers was determined from 50 metaphase spreads. (F) Chromosome number variability/whole chromosomal instability of CCD 841 CoN cells depicted from (D). For each condition, the distribution of individual chromosome numbers was determined from 50 metaphase spreads. A detailed description of statistics is provided in the Materials and Methods section. P-values are available for this figure.

References

    1. Kayser G, Gerlach U, Walch A, Nitschke R, Haxelmans S, Kayser K, Hopt U, Werner M, Lassmann S (2005) Numerical and structural centrosome aberrations are an early and stable event in the adenoma-carcinoma sequence of colorectal carcinomas. Virchows Arch 447: 61–65. 10.1007/s00428-004-1191-1 - DOI - PubMed
    1. Mahathre MM, Rida PC, Aneja R (2016) The more the messier: Centrosome amplification as a novel biomarker for personalized treatment of colorectal cancers. J Biomed Res 30: 441–451. 10.7555/JBR.30.20150109 - DOI - PMC - PubMed
    1. Ganem NJ, Godinho SA, Pellman D (2009) A mechanism linking extra centrosomes to chromosomal instability. Nature 460: 278–282. 10.1038/nature08136 - DOI - PMC - PubMed
    1. Bakhoum SF, Thompson SL, Manning AL, Compton DA (2009) Genome stability is ensured by temporal control of kinetochore-microtubule dynamics. Nat Cell Biol 11: 27–35. 10.1038/ncb1809 - DOI - PMC - PubMed
    1. Cimini D (2008) Merotelic kinetochore orientation, aneuploidy, and cancer. Biochim Biophys Acta 1786: 32–40. 10.1016/j.bbcan.2008.05.003 - DOI - PubMed

Publication types

MeSH terms

LinkOut - more resources