. 2022 Nov 16;13(1):7008.
doi: 10.1038/s41467-022-34715-6.

F-actin architecture determines constraints on myosin thick filament motion

Affiliations

F-actin architecture determines constraints on myosin thick filament motion

Camelia G Muresan et al. Nat Commun. .

Abstract

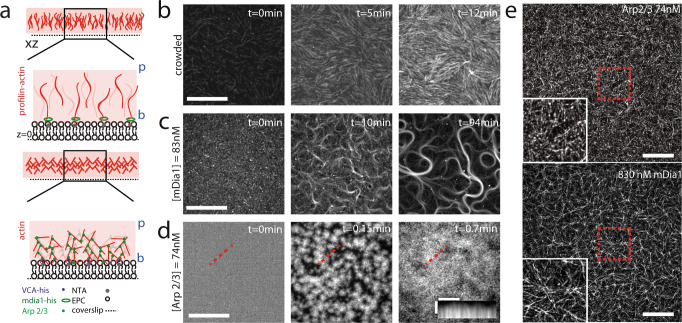
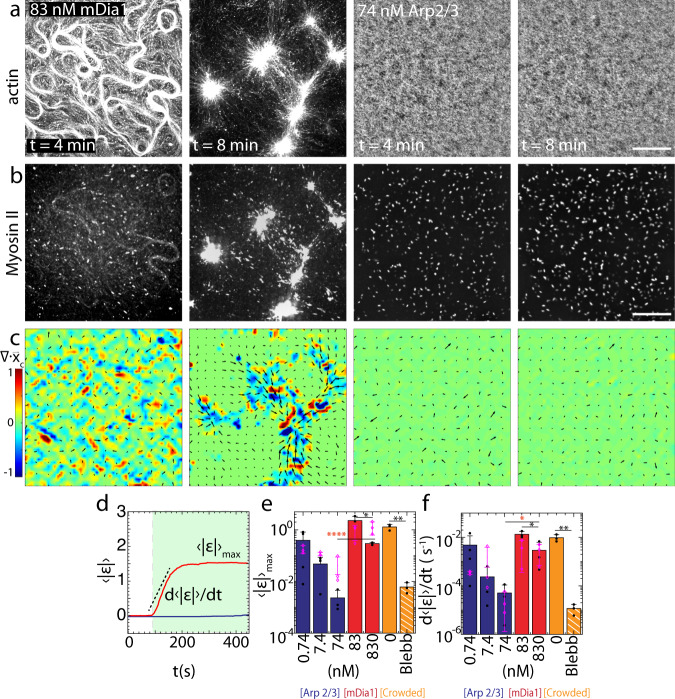
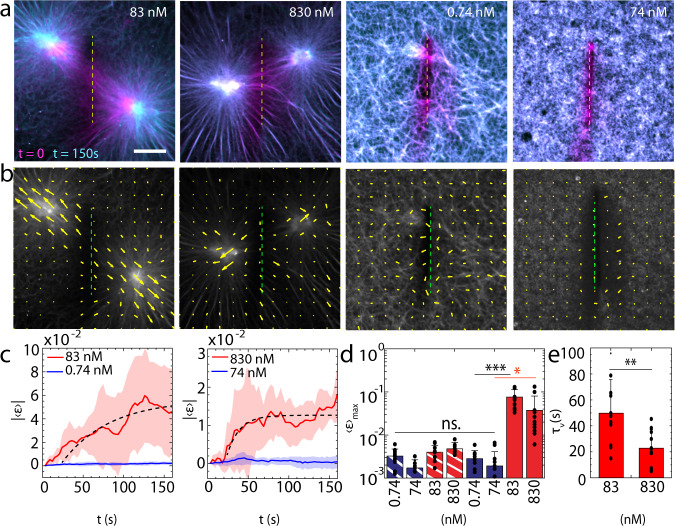
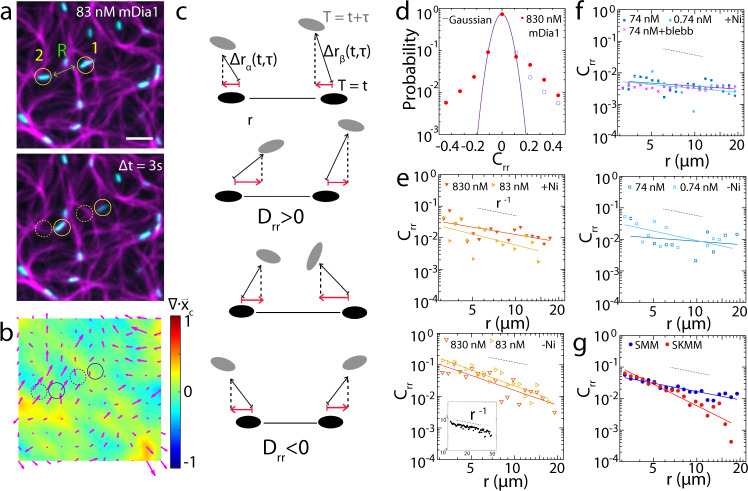
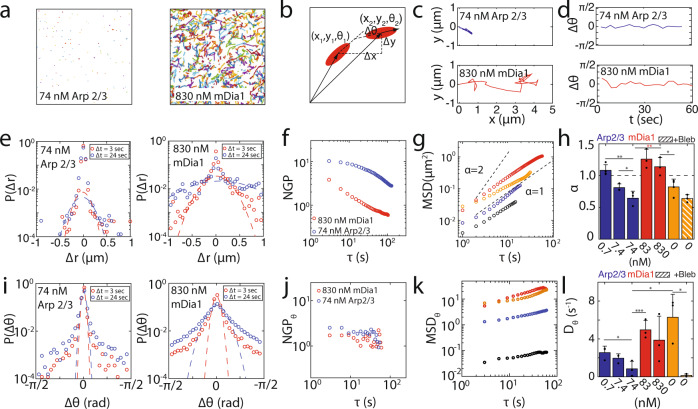
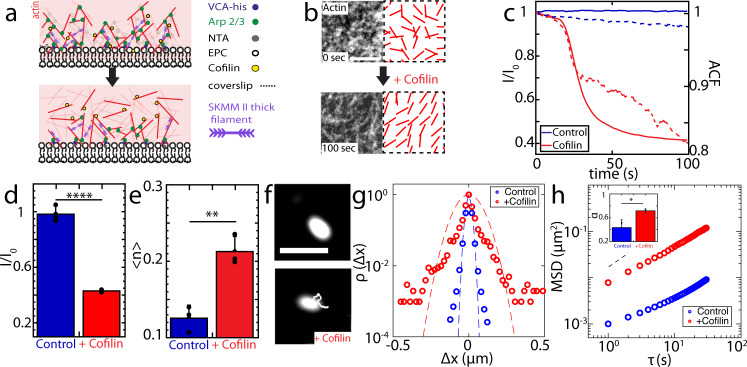
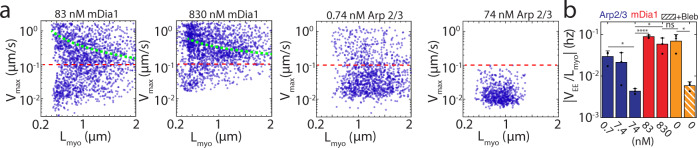
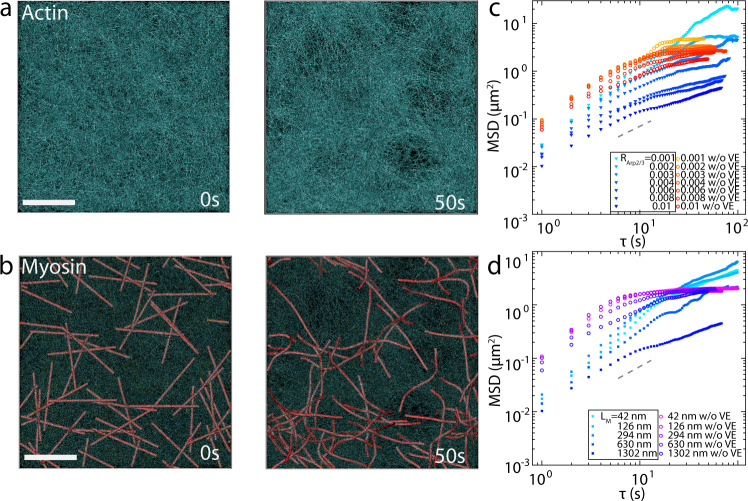
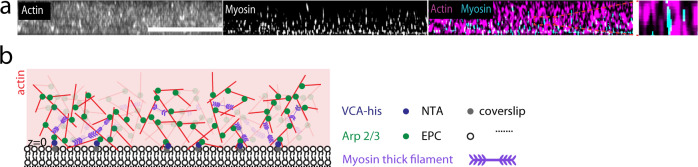
Active stresses are generated and transmitted throughout diverse F-actin architectures within the cell cytoskeleton, and drive essential behaviors of the cell, from cell division to migration. However, while the impact of F-actin architecture on the transmission of stress is well studied, the role of architecture on the ab initio generation of stresses remains less understood. Here, we assemble F-actin networks in vitro, whose architectures are varied from branched to bundled through F-actin nucleation via Arp2/3 and the formin mDia1. Within these architectures, we track the motions of embedded myosin thick filaments and connect them to the extent of F-actin network deformation. While mDia1-nucleated networks facilitate the accumulation of stress and drive contractility through enhanced actomyosin sliding, branched networks prevent stress accumulation through the inhibited processivity of thick filaments. The reduction in processivity is due to a decrease in translational and rotational motions constrained by the local density and geometry of F-actin.


Conflict of interest statement

The authors declare no competing interests.

Figures

Fig. 1
Fig. 1. Reconstitution of F-actin networks with variable architectures.
a Diagram of F-actin nucleated and grown from a phospholipid bilayer with either mDia1 (green ellipses) coupled to nickel lipid (NTA) (top) or Arp2/3 (green dots) activated by VCA (blue dots) coupled to nickel lipid (bottom). (‘b’ is barbed end, and ‘p’ is pointed end of F-actin. b Pre-polymerized F-actin crowded to the surface of the bilayer over time. Scalebar is 20 μm. c 83 nM mDia1-nucleated F-actin growth over time. Scalebar is 20 μm. d 74 nM Arp2/3-nucleated F-actin growth over time. Scalebar is 20 μm. Scalebar for inset kymograph is 5 μm (horizontal), and 30 s (vertical). e Super-resolution image of 74 nM Arp2/3-nucleated (top) and 830 nM mDia1-nucleated (bottom) F-actin networks. Experiments were repeated 3 times independently with similar results. Scale bar is 5 μm.
Fig. 2
Fig. 2. Contractility is attenuated in branched F-actin networks.
a Fluorescent F-actin over time. t is time after the addition of myosin dimers. b Fluorescent myosin II on the networks in a. c Divergence of actin displacements (strain) (colormap) and the local actin velocity field (black arrows). d Absolute valued mean strain (ε), over time. The strain rate (dε/dt) and maximum mean strain (εmax) are indicated. Green shaded region indicates the regime of analysis. e εmax for different nucleator concentrations. Blue: Arp 2/3, Red: formin, orange: no nucleator (crowded network), and orange with white stripes: no nucleator +Blebbistatin. (*p < 0.05, **p < 0.01, and ***p < 0.001. p(74 nM Arp & 830 nM mDia1)= 0.000081, p(83 nM mDia1 & 830 nM mDia1) = 0.029, p(no nucleator & no nucleator +blebb)= 0.0023. N = 3 independent experiments for each condition. Magenta: no Ni data, N = 3 independent experiments for each condition. Error bars represent s.d. of the mean. Two-tailed t test.) f dε/dt for different nucleator concentrations. Color code same as e. (*p < 0.05, **p < 0.01, and ***p < 0.001. p(74 nM Arp & 830 nM mDia1) = 0.044, p(83 nM mDia1 & 830 nM mDia1) = 0.0283, p(no nucleator & no nucleator +blebb)= 0.0066. N = 3 independent experiments for each condition. Magenta: no Ni, N = 3 independent experiments for each condition. Error bars represent s.d. of the mean. Two-tailed t test. Source data are provided as a Source Data file).
Fig. 3
Fig. 3. Branched F-actin networks prevent the accumulation of myosin-induced mechanical tension.
a Actin overlay pre- (magenta, t = 0) and post-ablation (cyan, t = 150 s). yellow dashed lines show the ablation regions. b Actin velocity field quiver plot for post ablation (t = 150 s). c Absolute valued mean strain (ε) vs. time for post-ablation (t > 15 s) 83 nM mDia1 vs. 0.74 nM Arp 2/3-nucleated F-actin (left), and 830 nM mDia1 vs. 74 nM Arp 2/3-nucleated F-actin (right) (N = 10 independent experiments for each condition). Shaded regions indicate s.d. of the mean. d Maximum mean strain (εmax) for actin post-ablation for 83 nM/830 nM mDia1-nucleated F-actin (red), and 0.74 nM/74 nM Arp 2/3-nucleated F-actin (blue). Bars with white stripes = ablation without Myosin II addition. (*p < 0.05, ***p < 0.001, and ns is not significant. p (74 nM Arp & 830 nM mDia1) = 0.0206, p(0.74 nM Arp & 83 nM mDia1) = 1.66e−5. N = 10 independent experiments for each condition. Error bars represent s.d. of the mean. Two tailed t test). e mDia1 viscoelastic response fit with Kelvin–Voigt model (Methods) (**p < 0.01. p = 0.0082. N = 10 independent experiments for each condition. Error bars represent s.d. of the mean. Two tailed t test. Source data are provided as a Source Data file).
Fig. 4
Fig. 4. Branched F-actin attenuates the transmission of mechanical strain.
a F-actin (magenta), Myosin II (cyan) and b strain heatmap and local actin velocity quiver plot (magenta) for 83 nM mDia1. Scale bar = 10 μm. c Diagrammatic illustration of TPC on Myosin II thick filaments. d Probability density distribution for Crr of myosin thick filaments in 830 nM mDia1-nucleated F-actin network at r = 3 μm between −0.5 and 0.5 (red) with Gaussian fit (purple). Blue dashed circles are points mirroring from left half of the plot showing asymmetry for Crr. e and f show Crr for myosin thick filaments in mDia1 and Arp 2/3-nucleated F-actin networks over r = 3–20 μm. Hollow triangles show data without Ni. Gray dashed lines show slope of −1. Inset: 2 μm beads in glycerol/water (1:3) (black). g Crr for SMM (blue) and SKMM (red) thick filaments in non-nucleated F-actin networks. Gray dashed lines show slope of −1 (N = 3 independent experiments for each condition, Npair > 1 × 106. Source data are provided as a Source Data file).
Fig. 5
Fig. 5. F-actin branching inhibits translational and rotational diffusion of myosin thick filaments.
Trajectories of myosin thick filaments over 1 min within a 74 nM Arp2/3 and 830 nM mDia1-nucleated F-actin networks. b A schematic for measuring translational and rotational motion of a myosin thick filament between two time points. c, d Individual translational and rotational trajectories of myosin thick filaments. Van Hove relationship e and Non-Gaussian Parameter f for translational displacement of 74 nM Arp2/3 and 830 nM mDia1-nucleated networks at both 3 and 24 s. g Translational Mean-Square Displacement (MSD) of thick filaments. Red: 830 nM mDia1. Orange: Non-nucleated network. Blue: 0.74 nM Arp 2/3. Black: Non-nucleated network with blebbistatin. h Slope α of the MSD for all conditions. (*p < 0.05, **p < 0.01. p(74 nM Arp & 830 mDia1) = 0.0089, p(74 nM Arp & 0.74 nM Arp) = 0.002, p(830 nM mDia1 & no nucleator) = 0.0248. Error bars represent s.d. of the mean. N = 3,3,4,3,3,5,3 independent experiments for the conditions from left to right. Two tailed t test). Van Hove i and NGP j for rotational displacement for 74 nM Arp2/3 and 830 nM mDia1. k Rotational MSD for all conditions. Red: 830 nM mDia1. Orange: 83 nM mDia1. Blue: 74 nM Arp 2/3. Black: Non-nucleated network with blebbistatin. l Rotational diffusion coefficient of myosin thick filaments for all conditions (*p < 0.05, ***p < 0.001. p(74 nM Arp & 0.74 nM Arp) = 0.0499, p(74 nM Arp & 83 mDia1) = 0.0051, p(74 nM Arp & no nucleator) = 0.0207, p(no nucleator & no nucleator +blebb) = 0.0117. Error bars represent s.d. of the mean. N = 3,3,4,3,3,5,3 independent experiments for the conditions from left to right. Two tailed t test. Source data are provided as a Source Data file).
Fig. 6
Fig. 6. F-actin debranching by cofilin partially restores myosin motility.
Step 1: polymerize actin. Step 2: add myosin. Step 3: add Cofilin. a Schematic diagram for cofilin debranching process (before: top, after: bottom). b 74 nM Arp 2/3-nucleated F-actin network pre- (top) and post- (bottom) addition of cofilin. Right panels show the nematic order alignment. Scale bar = 5 μm. c Normalized network fluorescence intensity (I/I0) (left axis) vs. time of the control case (blue solid line) vs. cofilin addition (red solid line), along with myosin autocorrelation (right axis, dashed lines, control: blue, and cofilin addition: red). d Steady state actin channel intensity bar plots. (****p < 0.0001. Error bars represent s.d. of the mean. N = 3 independent experiments for each condition. Two tailed t test). e Averaged nematic order parameter <n> for 74 nM Arp 2/3-nucleated F-actin network + (red), and -cofilin (blue, control). (**p < 0.01. p = 0.0045. Error bars represent s.d. of the mean. N = 3 independent experiments for each condition. Two tailed t test). f Myosin fluorescence & trajectory pre- (top) and post- (bottom) cofilin addition. Scale bar = 2 μm. g Van Hove relation of the displacement of myosin thick filaments in 74 nM Arp 2/3-nucleated F-actin network pre- (blue) and post- (red) addition of cofilin at lag time τ = 1 s. Blue and red dashed lines are the Gaussian fits. h Ensemble averaged MSD for myosin thick filaments with (red) and without (blue) cofilin addition. Black dashed line indicates slope of 1. Inset: slope of MSD α. (*p < 0.05, p = 0.0214. Error bars represent s.d. of the mean. N = 3 independent experiments for each condition. Two tailed t test. Source data are provided as a Source Data file).
Fig. 7
Fig. 7. mDia1- and Arp 2/3-nucleated F-actin networks differentially constrain myosin thick filaments.
a Filament maximum speed (vmax) as a function of myosin thick filament length (Lmyo) on networks of different architectures and density. Green dashed curves are ‘guide to eye’ for the inverse relationship. Myosin thick filaments are considered as immobile (pixel resolution = 0.1 μm) below the red dashed lines. b Absolute value of the slope of mean speed vEE vs Lmyo for all conditions. (*p < 0.05, ****p < 0.0001, and ns is not significant. p(74 nM Arp & 0.74 nM Arp) = 0.0148, p(74 nM Arp & 83 nM mDia1) = 4.34e-5, p(74 nM Arp & 830 nM mDia1) = 0.0172, p(no nucleator & no nucleator + blebb) = 0.0229. Nmyo = 3444, 3668, 2258, 2588, 668, 1851, and 775 for each condition from left to right. N = 3 independent experiments for each condition. Two tailed t test. Error bars represent s.d. of the mean. Source data are provided as a Source Data file).
Fig. 8
Fig. 8. Branched F-actin inhibits myosin motions through volume exclusion.
Initial and final state of a network with Arp 2/3-nucleated F-actin (cyan) a and actomyosin overlay where motors are shown in red b CA = 200 μM. RM = 0.01. RArp2/3 = 0.01. LM = 1302 nm. Scale bar = 1 μm. c Ensemble average MSD of myosin with various Arp 2/3: actin ratio (RArp2/3) with (solid triangles, boxed legends) and without (hollow circles) volume exclusion (VE). d Ensemble average MSD of myosin with various myosin length (LM) with (solid squares, boxed legends) and without (hollow circles) VE. In c, and d, gray dashed lines indicate slope of 1.
Fig. 9
Fig. 9. Arp 2/3-nucleated F-actin confines myosin thick filaments.
a Super-resolution z-stack image for Arp 2/3-nucleated F-actin (left), myosin thick filaments (middle), and merged image of F-actin (magenta) and myosin (cyan). Square image on the right is a zoomed in image of myosin thick filaments embedded in branched F-actin network. Scale bar is 5 μm. The actin (red) and myosin (black) normalized intensity plots as a function of depth z are on the left of actin z stack, respectively. Three independent experiments were done with similar results. b Diagram of myosin thick filaments within Arp 2/3-nucleated F-actin network.

References

    1. Blanchoin L, Boujemaa-Paterski R, Sykes C, Plastino J. Actin dynamics, architecture, and mechanics in cell motility. Physiol. Rev. 2014;94:235–263. - PubMed
    1. Bray D, White JG. Cortical flow in animal cells. Science. 1988;239:883–888. - PubMed
    1. Murrell M, Oakes PW, Lenz M, Gardel ML. Forcing cells into shape: the mechanics of actomyosin contractility. Nat. Rev. Mol. Cell Biol. 2015;16:486–498. - PMC - PubMed
    1. Das M, Schmidt CF, Murrell M. Introduction to active matter. Soft Matter. 2020;16:7185–7190. - PubMed
    1. Bovellan M, et al. Cellular control of cortical actin nucleation. Curr. Biol. 2014;24:1628–1635. - PMC - PubMed

Publication types