. 2022 Nov 16;13(1):7002.
doi: 10.1038/s41467-022-34476-2.

CBP-HSF2 structural and functional interplay in Rubinstein-Taybi neurodevelopmental disorder

Affiliations

CBP-HSF2 structural and functional interplay in Rubinstein-Taybi neurodevelopmental disorder

Aurélie de Thonel et al. Nat Commun. .

Erratum in

  • Author Correction: CBP-HSF2 structural and functional interplay in Rubinstein-Taybi neurodevelopmental disorder.
    de Thonel A, Ahlskog JK, Daupin K, Dubreuil V, Berthelet J, Chaput C, Pires G, Leonetti C, Abane R, Barris LC, Leray I, Aalto AL, Naceri S, Cordonnier M, Benasolo C, Sanial M, Duchateau A, Vihervaara A, Puustinen MC, Miozzo F, Fergelot P, Lebigot É, Verloes A, Gressens P, Lacombe D, Gobbo J, Garrido C, Westerheide SD, David L, Petitjean M, Taboureau O, Rodrigues-Lima F, Passemard S, Sabéran-Djoneidi D, Nguyen L, Lancaster M, Sistonen L, Mezger V. de Thonel A, et al. Nat Commun. 2023 Sep 28;14(1):6067. doi: 10.1038/s41467-023-41869-4. Nat Commun. 2023. PMID: 37770591 Free PMC article. No abstract available.

Abstract

Patients carrying autosomal dominant mutations in the histone/lysine acetyl transferases CBP or EP300 develop a neurodevelopmental disorder: Rubinstein-Taybi syndrome (RSTS). The biological pathways underlying these neurodevelopmental defects remain elusive. Here, we unravel the contribution of a stress-responsive pathway to RSTS. We characterize the structural and functional interaction between CBP/EP300 and heat-shock factor 2 (HSF2), a tuner of brain cortical development and major player in prenatal stress responses in the neocortex: CBP/EP300 acetylates HSF2, leading to the stabilization of the HSF2 protein. Consequently, RSTS patient-derived primary cells show decreased levels of HSF2 and HSF2-dependent alteration in their repertoire of molecular chaperones and stress response. Moreover, we unravel a CBP/EP300-HSF2-N-cadherin cascade that is also active in neurodevelopmental contexts, and show that its deregulation disturbs neuroepithelial integrity in 2D and 3D organoid models of cerebral development, generated from RSTS patient-derived iPSC cells, providing a molecular reading key for this complex pathology.


Conflict of interest statement

The authors declare no competing interests.

Figures
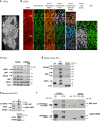
Fig. 1
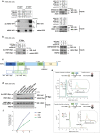
Fig. 1. HSF2 is expressed, acetylated, and interacts with EP300/CBP in neurodevelopmental contexts.
Representative images or immunoblots. a Confocal microscopy images of 56 days (D56) hCOs derived from H9 human embryonic stem cells (hESCs) and stained with DAPI. Image reconstruction of a complete section showing cortical-like structures (white arrowheads). The yellow arrowhead points to magnified areas shown in b (panels 1–4). Scale bar: 200 µm. b Immunofluorescence of D56 hCOs showing the co-expression of HSF2, CBP/P300 in PAX6 or SOX2 neuroprogenitor cells and in TBR1 or class III β-TUBULIN (βIII tub) neurons (n = 3). Top, basal side; Bottom, apical side. Dotted lines, PL proliferative layer, solid lines NL neuronal layer. Each panel is 70 µm wide. c Immunoblots from D20, D40, and D60 hCOs and H9 hESCs at passages 17 and 23, showing CBP/EP300, HSFs and HSC70 expression (n = 3). HSC70, a heat-shock cognate protein that is not induced by stress, serves as a loading control. Actin is used as a comparison. d Immunoblots of immunoprecipitated HSF2 (IP HSF2), showing co-immunoprecipitation of EP300 and CBP (n = 3) in the mouse cortex at embryonic day 13 (E13). hc IgG heavy chain. Inputs, total proteins in input samples. Short and long exposure times. e Immunoblots of immunoprecipitated HSF2 showing endogenous acetylated HSF2 (Ac-HSF2) in the mouse cortex at E15 (n = 2). Co-immunoprecipitation of EP300 is used as a positive control. AcK acetyl-lysine. f Immunoblots of immunoprecipitated HSF2 from HEK 293 cells overexpressing a myc-tagged HSF2 or D40 hCOs hESCs showing acetylation of HSF2 (n = 3). HEK 293 cells are positive controls that contain both endogenous and exogenous acetylated HSF2. *indicates non specific, **indicates high molecular weight form of HSF2. MW molecular weight, hc IgG heavy chain. Source data are provided as a Source Data file.
Fig. 2
Fig. 2. HSF2 is acetylated by CBP and EP300 in normal conditions.
a Representative immunoblots of immunoprecipitated HSF2-YFP (IP GFP) from HEK 293 cells transfected with combinations of tagged constructs, YFP-HSF2, HA-CBP, HA-EP300, mock-HA or mock-GFP, showing that ectopically expressed YFP-HSF2 is acetylated by exogenous HA-CBP or HA-EP300 (n = 5). CTA, Trap®-A beads used as a negative control. Inputs, total proteins in input samples. Short and long, different exposure times. b Representative immunoblots of immunoprecipitated HSF2-Myc (IP Myc) from HEK 293 cells transfected with combinations of tagged constructs, HSF2-Myc, HA-CBP, or DNCBP (dominant-negative form of CBP) showing HSF2-Myc protein is acetylated by CBP but not by a dominant-negative form of CBP (n = 2). CTA, Trap®-A beads used as a negative control. c Schematic representation of the eight main acetylated lysine residues of the HSF2 protein. DBD DNA-binding domain, HR-A/B hydrophobic heptad repeat, HR-C leucine-zipper-containing domain controlling oligomerization (TAD, activation domain). The numbers of the amino acids located at domain boundaries are indicated in gray (mouse HSF2) or black (human HSF2, if different). The four (blue box, K82, K128, K135, K197) or three (green box, K128, K135, K197) lysine residues in DBD, and/or HR-A/B were mutated into glutamines (4KQ, 3KQ) or arginines (4KR, 3KR). d Representative immunoblots of immunoprecipitated HSF2-Myc (IP Myc) from HEK 293 cells, co-transfected with EP300-HA and HSF2-Myc wild-type (WT) or HSF2-Myc carrying mutations on the indicated lysine residues showing that concommittant mutations of three or four lysine to arginine (3KR or 4KR) or glutamine (3KQ or 4KQ) residues decrease global HSF2 acetylation levels (n = 3). e Time course elution of HSF2K197 and HSF2K135 peptides detected by reverse phase-ultra-fast liquid chromatography (RP-UFLC) after 0 (black), 1 (red), or 2 (green) hours of acetylation by CBP-Full-HAT, monitored by fluorescence emission at 530 nm. uV arbitrary unit of fluorescence. See Methods for HSF2K197 and HSF2K135 peptide sequences and Supplementary Fig. 2. f Quantification of the in vitro acetylated HSF2 peptides containing K82, K135, and K197 residues detected by RP-UFLC. Source data are provided as a Source Data file.
Fig. 3
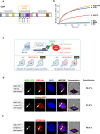
Fig. 3. HSF2 interacts with CBP and EP300 in normal conditions.
a Schematic representation of CBP protein domains. The ability of CBP to bind a very large number of proteins is mediated by several conserved protein binding domains, including the nuclear receptor interaction domain (RID), the cysteine/histidine-rich region 1 (CH1), the KIX domain, the bromodomain (BD), the CH2 containing a PHD and a RING domain, the HAT, the CH3, the steroid receptor co-activator-1 interaction domain (SID) and the glutamine- and proline-rich domain (QP). b Representative kinetics of recombinant HSF2 binding to His-tagged CBP domains or HSP70 (positive control) by biolayer interferometry (n = 3). c Schematic representation of the principle of the fluorescent-3-hybrid (F3H) assay. Genomic integration of a LacO array allows the focal recruitment in the nucleus of a LacI fused to the GFP binder, which in turn recruits the GFP-tagged probe (HSF2-YFP) and its potential interactants (CBP/EP300), being either endogenous or brought by overexpression. d, e Representative confocal sections of BHK cells carrying a stably integrated Lac-operator array, transfected with LacI-GFP binder, HSF2-YFP, and CBP-HA (d) or EP300-HA (e) showing the interaction between HSF2-YFP (green) and exogenous CBP-HA, endogenous CBP (d) or with exogenous EP300-HA (e) (red). White arrows, co-localization of HSF2 and CBP or EP300 at the LacO array. Negative controls are shown in Supplementary Fig. 3d–g. Scale bar: 10 μm. Graphs represent the combined signal intensity of the two fluorescence signals at the LacO array. Quantification: percentage of cells showing co-recruitment of YFP-HSF2 and EP300-HA, CBP-HA or endogenous CBP at the Lac0 array (n = 3 or 4, average of 100 counted cells per experiment). Source data are provided as a Source Data file.
Fig. 4
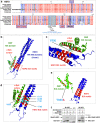
Fig. 4. Modeling of CBP and HSF2 interaction.
a Amino acid sequence of the KIX-binding motifs located in the HSF2 HR-A/B region. Blue rectangle, conserved KIX-binding motif sequences (“ΦXXΦΦ”). Purple boxes, positions of the very conserved and major acetylated lysine residues; K82 (blue) is located in the DBD, K128, K135, and K197 (red) are located in the HR-A/B and K209/K210 (black) is located downstream the HR-A/B. b In silico model structure of the CBP KIX domain and the HSF2 HR-A/B domain interaction. Representation of the HSF2 HR-A/B domains In the HSF2 trimer, as a triple-coiled coil (in blue). The KIX recognition motifs of HSF2 are indicated in red. Representation of the KIX domain of CBP, a triple helical globular domain (in green). The c-Myb surface of the KIX domain is indicated in red. c In silico model. Magnification of the HSF2 and CBP interaction domains shown in b showing the tyrosine residue Y650 (pale blue) within the c-Myb surface of the CBP KIX domain in contact with the KIX recognition motifs of the HSF2 HR-A/B domain. d In silico model representation of the position of the four residues of HSF2 KIX recognition motifs and of Y650 of the CBP KIX domain that have been analyzed by in silico mutation. e In silico Y650A mutation disrupts interaction between the HSF2 KIX motifs and the CBP KIX domain (Firedock analysis). f Representative immunoblots of immunoprecipitated CBP KIX domain (IP GST) after in vitro interaction experiments between wild-type or mutated CBP KIX-GST and SNAP-HSF2 recombinant proteins produced in bacteria and reticulocyte lysates showing Y650A mutation disrupts interaction between the HSF2 KIX motifs and the CBP KIX domain (n = 3). lc IgG light chain. The left and right immunoblots correspond to two independent experiments. Source data are provided as a Source Data file.
Fig. 5
Fig. 5. Impact of preventing or mimicking acetylation of lysine residues K128, K135, and K197 on HSF2 protein stability.
a Representative immunoblots. The inhibition of CBP/EP300 decreases HSF2 and is counteracted by proteasome inhibition in N2A cells treated with the CBP/EP300 inhibitor C646 (40 µM, 4 h) and/or with MG132 (20 µM, 6 h) (n = 4). Quantification of HSF2 signal intensity, normalized by HSC70 and relative to vehicle-treated samples (−). Error bars, mean ± standard error of the mean (SEM), *p = 0.0022. b Scheme of the principle of SNAP-TAG pulse-chase experiments. c Representative electrophoresis images of protein extracts from HSF2KO or WT U2OS cells expressing SNAP-tagged WT, 3KQ or 3KR HSF2, SNAP-labeled, and showing the decay of 3KQ HSF2 mutant protein levels (0–5 h). SNAP-H3.3, loading control. d Quantification of the fluorescent signal normalized to H3.3 and relative to the signal at t0 (n = 7 with replicates). Error bars, mean ± SEM, p = 0.0112 (1h30,KQ vs.WT), p = 0.0029 (1h30,KR vs.KQ), p = 0.0045 (3 h,KQ vs.WT), p = 0.0039 (3 h, KQ vs. KR), p = 0.0076 (5 h, KQ vs. WT); p = 0.0015 (3 h, KQ vs.KR) *p < 0.05; **p < 0.01. e Representative electrophoresis images of protein extracts from Hsf2KO U2OS cells expressing SNAP-tagged HSF2 WT or 3KR, pretreated by MG132 (vehicle (0), 10, 20 µM, 5 h), SNAP-labeled, and analyzed after 5 h, showing the decrease in SNAP-HSF2 WT and 3KR protein levels depending on proteasome activity (n = 3). Error bars, mean ± SEM. p = 0.0286 (KR vs. KR_MG), p = 0.0159 (WT vs. WT_MG) *p < 0.05, quantification as in d. f Representative immunoblots of immunoprecipitated HSF2-Myc (IP Myc) from HEK 293 cells transfected with HSF2-Myc WT, 3KR, or 3KQ, and treated (+) or not (−) with MG132 (20 µM, 6 h), showing preferential poly-ubiquitination of the HSF2 3KR mutant protein, compared to HSF2 WT or 3KQ (n = 3). g Representative electrophoresis image as in c, but Hsf2KO U2OS cells were treated with HS (42 °C) or not, (CTR), and analyzed prior (0, grey) or after 2.5 h (light grey) of HS (red), showing increased HSF2 3KQ stability, upon HS, compared to WT or 3KR (n = 7). Error bars, mean ± SEM *** p = 0.0011 (3KQ, HS 2h30 vs. CTR 2h30)), ****p < 0.0001 (WT, HS 2h30 vs. CTR 2h30); p = 0.0001 (3KR, HS2h30 vs. CTR 2h30). Quantification as in d. Significance was calculated by two-sided Mann–Whitney test in panels a, d, e, g. Source data are provided as a Source Data file.
Fig. 6
Fig. 6. Altered HSF2 protein levels and dysregulated stress response in cells from RSTS patients.
a Schematic representation of the mutations or deletions present in RSTS patients. The scheme of the genomic organization of the genes are taken from NCBI data base (NM_001429.3) (see Supplementary methods). b Representative immunoblots of protein extracts from HD and RSTS P1CBP hPSFs treated with 20 µM MG132 (6 h) showing reduced HSF2 levels in RSTS hPSFs, compared to HD, but restored levels in the presence of the proteasome inhibitor MG132 (n = 3). c Representative immunoblots of protein extracts from HD and RSTS P2EP300 hPSFs treated with 20 µM MG132 (6 h) or 1 mM of the HDAC inhibitor VPA (3 h) showing that reduced HSF2 levels observed in RSTS hPSFs, compared to HD, are restored in the presence of the proteasome inhibitor MG132, while the HDAC inhibitor VPA does not restore HSF2 levels (n = 3). d Representative immunoblots of protein extracts from HD and RSTS P1CBP hPSFs in control (CTR), heat shock (HS, 1 h at 42 °C), and recovery conditions (Rec, HS + 2 h at 37 °C) showing reduced HSP basal levels and induction by HS in RSTS, compared to HD hPSFs (n = 3). Blue arrowhead, hyperphosphorylated and thereby shifted HSF1 band. Quantification of HSP70 and HSP90 signal intensity in immunoblots, normalized to actin. Error bars, mean ± s.d. e Representative immunofluorescence of protein extracts from HD and RSTS P2EP300 hPSFs in control (CTR) or heat-shock conditions (HS, 1 h at 43 °C), showing altered formation of nSBs (HSF1 nuclear speckles, green) upon HS, in RSTS P2EP300 hPSFs compared to HD. Arrowheads, nSBs; white rectangle, magnified cell containing nSBs. Quantification of the percentage of hPSFs containing nSBs (n = 3, 100–150 cells). Error bars, mean ± SEM; **p = 0.0286. Significance was calculated by two-sided Mann–Whitney test. Scale bar: 10 µM. Source data are provided as a Source Data file.
Fig. 7
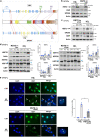
Fig. 7. HSF2-dependent dysregulated stress response and neurodevelopmental gene expression in cells from RSTS patients.
a Quantification of the percentage of cells containing nSBs (nuclear HSF1-positive dots) in HD1, HD2, RSTS P2EP300, and RSTS P1CBP hPSFs transfected with HSF2 3KQ-Myc or GFP, and subjected or not to HS (1 h at 43 °C). HSF2 3KQ restores the induction of HS-induced nSBs in RSTS hPSFs. Transfection rate efficiencies: 16% for HD PSFs, 11% for RSTS hPSFs (n = 4, 100–200 cells per experiment). Error bars, mean ± SEM; *p < 0.05. Significance was calculated by two-sided multicomparison Friedmann Test. Representative immunofluorescence of RSTS hPSFs transfected with HSF2 3KQ-Myc upon HS showing nSBs identified with HSF1 (red) in transfected cells (Myc, green). Scale bar: 10 µm. See Supplementary Figs. 7 and 8a. b Representative immunoblots of protein extracts from HD1, HD2, RSTS P1CBP, and RSTS P2EP300 hPSFs showing reduced expression of N-cadherin and HSP110 levels in RSTS, compared to HD hPSFs. Quantification of N-cadherin and HSP110 levels in immunoblots, normalized to actin (n = 3). Error bars, mean ± s.d. c Representative Immunofluorescence of hPSFs at cell–cell junctions (white dotted rectangles) showing that N-cadherin (green) is reduced in RSTS, compared to HD. Yellow rectangles, magnified areas. Scale bar: 20 µm. d Representative immunoblots of protein extracts from HD2 and RSTS P1CBP hPSFs treated by vehicle (0 nM) or BTZ (5 or 10 nM) for 22 h, showing increased HSF2 protein levels by subthreshold doses of BTZ, as well as restoration of HSP110 and N-cadherin levels in RSTS, compared to HD cells. *, endogenous HSF2 before treatment; short and long, different exposure times. Quantification of N-cadherin and HSP110 levels in immunoblots, normalized to actin (n = 2). Error bar, SEM. e Representative immunoblots of HDIMR90 and RSTS P2EP300 iNPCs, showing the reduction of levels of HSF2 and its targets in RSTSEP300, compared to HD iNPCs and hCOs. Quantification of the levels of HSF2, N-cadherin (N-cadh), and HSP110, detected in immunoblots, normalized to actin (n = 3). Error bars, mean ± SEM. f Representative immunofluorescence of HDIMR90 and RSTS P2EP300 iNPCs stained with N-cadherin (green) and HSF2 (purple). g. Same as in e but with D24(±1) hCOs. (n = 3). Error bars, mean ± SEM. Source data are provided as a Source Data file.
Fig. 8
Fig. 8. Pharmacological augmentation of HSF2 levels restores its target expression in iNPCs and hCOs.
a, b Representative immunoblots of protein extracts from RSTS P2EP300 iNPCs (a) or D25 hCOs (b) after treatment for 8 h (iNPCs) or 8h (hCOs) with vehicule (0) or MG132 (10 or 20 µM) showing the restoration of protein levels of HSF2 and its targets in the presence of MG132. Quantification of HSF2, N-cadherin, NDE1, HSP70, and HSP110 signal intensity in immunoblots, normalized to actin (n = 3). Error bars, mean ± SEM. c Representative immunofluorescence labeling of iNPCs by neural progenitor (PAX6) and radial glia (FABP7) markers (n = 3) showing the rosette-like, radial organization present in HD and lost in RSTS P2EP300 . Arrowheads, PAX6 positive groups of cells; arrows, radially organized FABP7 positive cells. Scale bar: 50 µm. d Representative immunofluorescence of HD or RSTS P1CBP D25 hCOs stained for the VZ apical belt (ZO-1, green) and for mitotic progenitor cells (H3S10Ph, red). Arrows point to subapical mitoses. Scale bar: 50 µm. Quantification of the mean subapical mitoses, relative to total mitoses per hCO loop (H3S10Ph positive cells not in contact with the apical belt) (n = 3 independent hCO production runs; for HD, n = 11 hCOs, 52 loops, 526 mitoses; for RSTS, n = 8 hCOs, 43 loops, 275 mitoses). The box indicates the upper and lower quartiles and the whiskers indicate the 5th and 95th percentiles of the data. Error bars, mean ± s.d., p = 0.0001; ***p < 0.0001. Significance was calculated by two-sided Mann–Whitney test. Source data are provided as a Source Data file.

References

    1. Gräff J, Kim D, Dobbin MM, Tsai L-H. Epigenetic regulation of gene expression in physiological and pathological brain processes. Physiol. Rev. 2011;91:603–649. doi: 10.1152/physrev.00012.2010. - DOI - PubMed
    1. Bourgeron T. From the genetic architecture to synaptic plasticity in autism spectrum disorder. Nat. Rev. Neurosci. 2015;16:551–563. doi: 10.1038/nrn3992. - DOI - PubMed
    1. Spena S, Gervasini C, Milani D. Ultra-rare syndromes: the example of Rubinstein-Taybi syndrome. J. Pediatr. Genet. 2015;4:177–186. doi: 10.1055/s-0035-1564571. - DOI - PMC - PubMed
    1. Lopez-Atalaya JP, Valor LM, Barco A. Epigenetic factors in intellectual disability: the Rubinstein-Taybi syndrome as a paradigm of neurodevelopmental disorder with epigenetic origin. Prog. Mol. Biol. Transl. Sci. 2014;128:139–176. doi: 10.1016/B978-0-12-800977-2.00006-1. - DOI - PubMed
    1. Van-Gils J, et al. Fetal phenotype of Rubinstein-Taybi syndrome caused by CREBBP mutations. Clin. Genet. 2019;95:420–426. doi: 10.1111/cge.13493. - DOI - PubMed

Publication types

MeSH terms