. 2022 Nov 16;13(1):7003.
doi: 10.1038/s41467-022-33713-y.

Global disparities in SARS-CoV-2 genomic surveillance

Anderson F Brito #  1   2 Elizaveta Semenova #  3 Gytis Dudas #  4 Gabriel W Hassler  5 Chaney C Kalinich  6   7 Moritz U G Kraemer  8 Joses Ho  9   10 Houriiyah Tegally  11   12 George Githinji  13   14 Charles N Agoti  13   15 Lucy E Matkin  8 Charles Whittaker  16   17 Bulgarian SARS-CoV-2 sequencing groupCommunicable Diseases Genomics Network (Australia and New Zealand)COVID-19 Impact ProjectDanish Covid-19 Genome ConsortiumFiocruz COVID-19 Genomic Surveillance NetworkGISAID core curation teamNetwork for Genomic Surveillance in South Africa (NGS-SA)Swiss SARS-CoV-2 Sequencing ConsortiumBenjamin P Howden  18 Vitali Sintchenko  19   20 Neta S Zuckerman  21 Orna Mor  21 Heather M Blankenship  22 Tulio de Oliveira  11   12   23   24 Raymond T P Lin  25 Marilda Mendonça Siqueira  26 Paola Cristina Resende  26 Ana Tereza R Vasconcelos  27 Fernando R Spilki  28 Renato Santana Aguiar  29   30 Ivailo Alexiev  31 Ivan N Ivanov  31 Ivva Philipova  31 Christine V F Carrington  32 Nikita S D Sahadeo  32 Ben Branda  9 Céline Gurry  9 Sebastian Maurer-Stroh  9   10   25 Dhamari Naidoo  33 Karin J von Eije  34   35 Mark D Perkins  35 Maria van Kerkhove  35 Sarah C Hill  36 Ester C Sabino  37   38 Oliver G Pybus  8   36 Christopher Dye  8 Samir Bhatt  16   17   39 Seth Flaxman  3 Marc A Suchard  5   40   41 Nathan D Grubaugh  6   42 Guy Baele  43 Nuno R Faria  44   45   46   47
Collaborators, Affiliations

Global disparities in SARS-CoV-2 genomic surveillance

Anderson F Brito et al. Nat Commun. .

Abstract

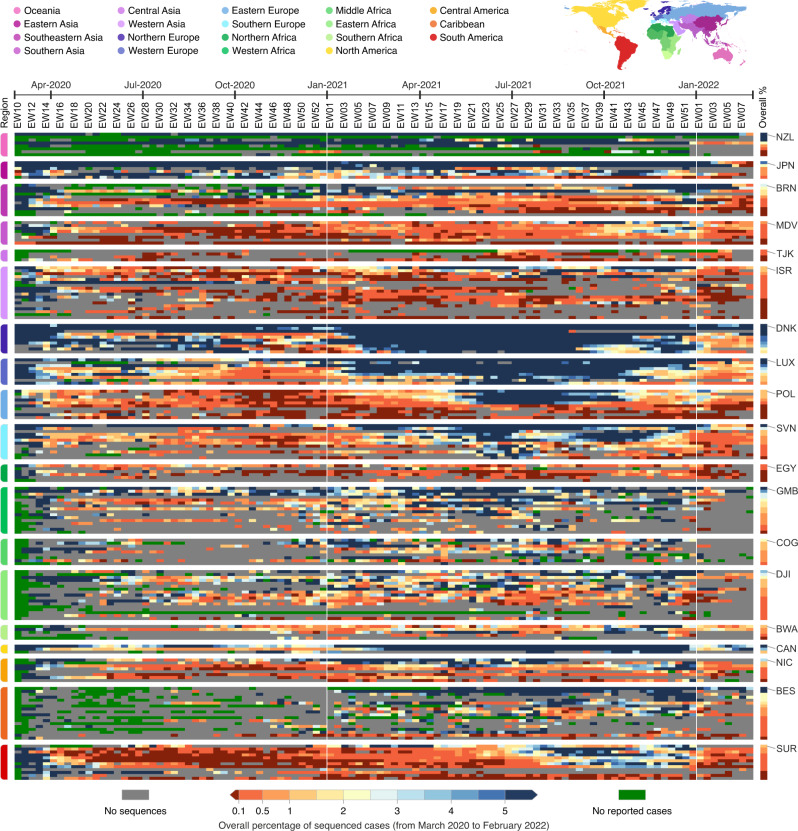
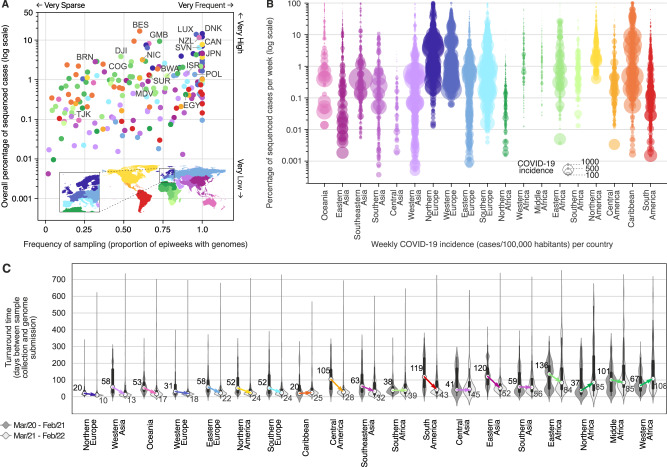
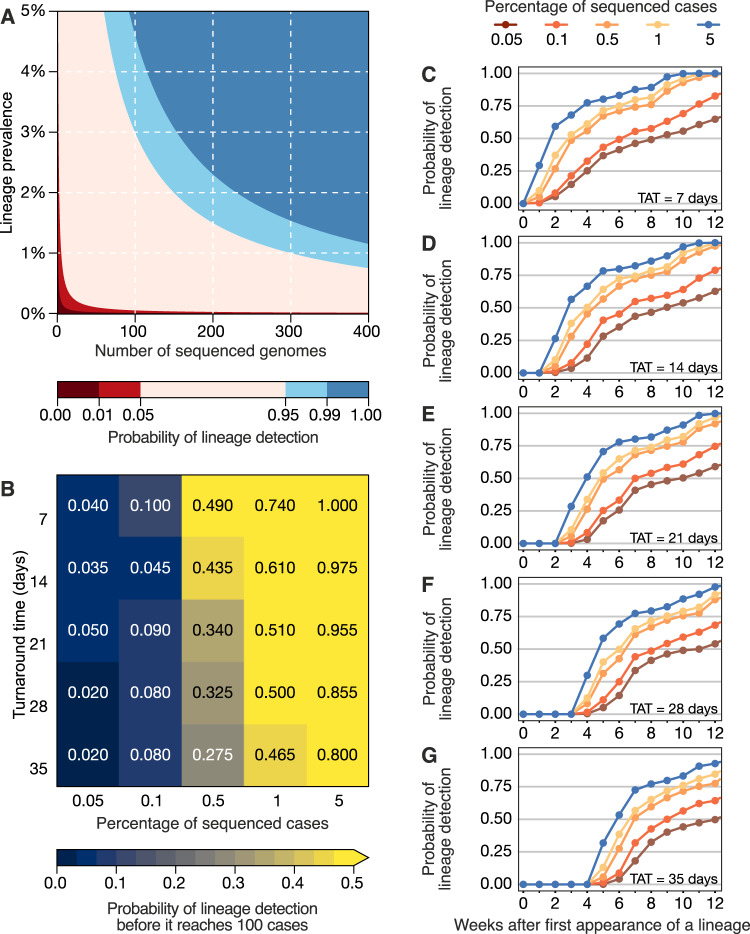
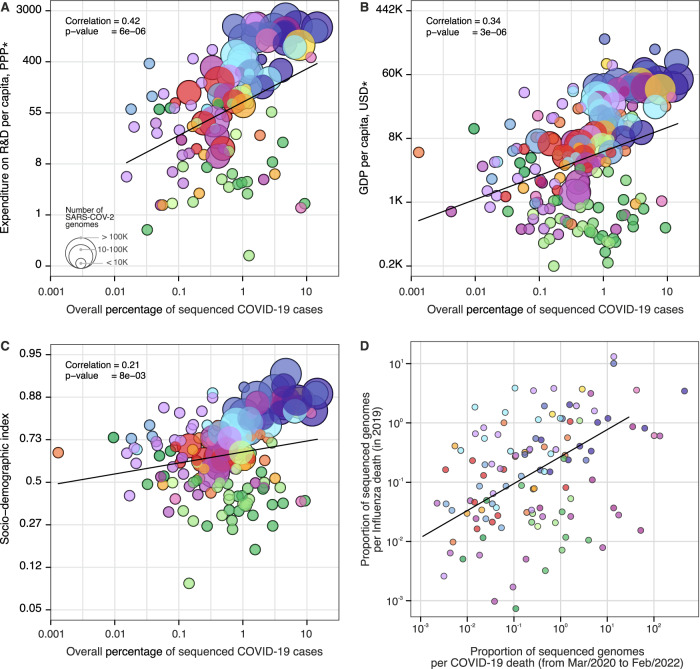
Genomic sequencing is essential to track the evolution and spread of SARS-CoV-2, optimize molecular tests, treatments, vaccines, and guide public health responses. To investigate the global SARS-CoV-2 genomic surveillance, we used sequences shared via GISAID to estimate the impact of sequencing intensity and turnaround times on variant detection in 189 countries. In the first two years of the pandemic, 78% of high-income countries sequenced >0.5% of their COVID-19 cases, while 42% of low- and middle-income countries reached that mark. Around 25% of the genomes from high income countries were submitted within 21 days, a pattern observed in 5% of the genomes from low- and middle-income countries. We found that sequencing around 0.5% of the cases, with a turnaround time <21 days, could provide a benchmark for SARS-CoV-2 genomic surveillance. Socioeconomic inequalities undermine the global pandemic preparedness, and efforts must be made to support low- and middle-income countries improve their local sequencing capacity.


Conflict of interest statement

N.D.G. is an infectious diseases consultant for Tempus Labs and the National Basketball Association. M.A.S. receives grants and contracts from the National Institutes of Health, the US Food & Drug Administration, the US Department of Veterans Affairs and Janssen Research & Development. O.G.P. has undertaken work for AstraZeneca on SARS-CoV-2 classification and genetic lineage nomenclature. The remaining authors declare no competing interests.

Figures

Fig. 1
Fig. 1. Disparities in SARS-CoV-2 global genomic surveillance.
Percentage of reported cases that were sequenced per country, per epidemiological week (EW), based on genomes collected from EW 10 of 2020 (March 1st) to EW 8 of 2022 (February 26th), with metadata submitted to GISAID up to March 18th, 2022. Updated numbers on sequence submissions and proportion of sequenced cases are available on the GISAID Submissions Dashboard at “gisaid.org”. Countries are grouped in regions according to the UNSD geoscheme, and countries with the highest overall proportion of sequenced cases are highlighted using the ISO 3166-1 nomenclature: NZL New Zealand, JPN Japan, BRN Brunei, MDV Maldives, TJK Tajikistan, ISR Israel, DNK Denmark, LUX Luxembourg, POL Poland, SVN Slovenia, EGY Egypt, GMB Gambia, COG Republic of the Congo, DJI Djibuti, BWA Botswana, CAN Canada, NIC Nicaragua, BES Bonaire, and SUR Suriname.
Fig. 2
Fig. 2. Genomic sequencing intensity and timeliness.
A Frequency and overall percentage of sequenced cases per country (colored as in Fig. 1). This plot summarizes the data shown in Fig. 1, where the x-axis shows the percentage of EWs with sequenced cases, and the y-axis displays the overall percentage of cases (shown in Fig. 1 as the rightmost column). Countries with the highest overall percentage of sequenced cases in each region are highlighted using the ISO 3166-1 nomenclature: NZL New Zealand, JPN Japan, BRN Brunei, MDV Maldives, TJK Tajikistan, ISR Israel, DNK Denmark, LUX Luxembourg, POL Poland, SVN Slovenia, EGY Egypt, GMB Gambia, COG Republic of the Congo, DJI Djibuti, BWA Botswana, CAN Canada, NIC Nicaragua, BES Bonaire, and SUR Suriname. B Percentage of cases sequenced per EW per country, per geographic region. Each circle represents an EW with at least one sequenced case; circle diameters represent incidence, defined here as number of reported cases per 100,000 people per EW per country. C Distribution of turnaround times of genomes collected in different geographic regions during the first year (from March 2020 to February 2021) and second year (from March 2021 to February 2022) of COVID-19 pandemic, grouped by year of submission (n = 8,947,455 genomes). The elements in the violin plots represent the median TATs (white circles), the interquartile range (black rectangles) and the minimum and maximum data points in the datasets (black vertical lines). The arrows highlight the changes in the median TATs between the first and second year of pandemic.
Fig. 3
Fig. 3. Detection of SARS-CoV-2 lineages under different genomic surveillance scenarios, assuming random sampling.
A The probability of detecting at least one genome of a rare lineage under different sequencing regimes. B Relative importance of decreasing genomic sequencing turnaround time (TAT) versus increasing sequencing percentage, measured as the probability that a given lineage (in simulated datasets) was detected before it had reached 100 cases (described in Fig. S8) across n = 100 resamplings. CG Probability of detecting any of the top 10 most prevalent lineages considering TATs of 7, 14, 21, 28 and 35 days across n = 100 resamplings.
Fig. 4
Fig. 4. Case sequencing percentages and socioeconomic covariates.
Covariates that show the highest correlation with the overall percentage of COVID-19 sequenced cases (during the period shown in Fig. 1, with geographic regions colored as shown in that figure). A Expenditure on R&D per capita (slope = 1.30, CI = (0.76, 1.84), t-value = 4.76). B GDP per capita (slope = 0.75, CI = (0.44, 1.05), t-value = 4.83). C Socio-demographic index (slope = 0.25, CI = (0.07, 0.44), t-value = 2.70). D Overall proportion of sequenced genomes per influenza death in 2019 (HA segment) (slope = 0.89, CI = (0.40, 1.37), t-value = 3.62). For correlations between covariates and turnaround time, see Fig. S10. The color scheme is the same as in Figs. 1 and 2. Solid line shows the linear fit; correlation is Pearson’s correlation; p values are reported based on the t-statistic using two-sided hypothesis, with the null hypothesis being that the slope of the linear trend is zero. There was no need for multiple comparison adjustments. *PPP purchasing power parity, USD US dollar 2005.

Update of

  • Global disparities in SARS-CoV-2 genomic surveillance.
    Brito AF, Semenova E, Dudas G, Hassler GW, Kalinich CC, Kraemer MUG, Ho J, Tegally H, Githinji G, Agoti CN, Matkin LE, Whittaker C; Danish Covid-19 Genome Consortium; COVID-19 Impact Project; Network for Genomic Surveillance in South Africa (NGS-SA); GISAID core curation team; Howden BP, Sintchenko V, Zuckerman NS, Mor O, Blankenship HM, de Oliveira T, Lin RTP, Siqueira MM, Resende PC, Vasconcelos ATR, Spilki FR, Aguiar RS, Alexiev I, Ivanov IN, Philipova I, Carrington CVF, Sahadeo NSD, Gurry C, Maurer-Stroh S, Naidoo D, von Eije KJ, Perkins MD, van Kerkhove M, Hill SC, Sabino EC, Pybus OG, Dye C, Bhatt S, Flaxman S, Suchard MA, Grubaugh ND, Baele G, Faria NR. Brito AF, et al. medRxiv [Preprint]. 2021 Dec 9:2021.08.21.21262393. doi: 10.1101/2021.08.21.21262393. medRxiv. 2021. Update in: Nat Commun. 2022 Nov 16;13(1):7003. doi: 10.1038/s41467-022-33713-y. PMID: 34462754 Free PMC article. Updated. Preprint.

Similar articles

Cited by

References

    1. WHO. WHO COVID-19 Explorer. https://worldhealthorg.shinyapps.io/covid/ (2021).
    1. Lauring AS, Hodcroft EB. Genetic variants of SARS-CoV-2—what do they mean? JAMA. 2021;325:529–531. doi: 10.1001/jama.2020.27124. - DOI - PubMed
    1. Rydland HT, Friedman J, Stringhini S, Link BG, Eikemo TA. The radically unequal distribution of Covid-19 vaccinations: a predictable yet avoidable symptom of the fundamental causes of inequality. Humanit. Soc. Sci. Commun. 2022;9:1–6. doi: 10.1057/s41599-022-01073-z. - DOI
    1. Ye Y, et al. Equitable access to COVID-19 vaccines makes a life-saving difference to all countries. Nat. Hum. Behav. 2022;6:207–216. doi: 10.1038/s41562-022-01289-8. - DOI - PMC - PubMed
    1. Mobarak AM, et al. End COVID-19 in low- and middle-income countries. Science. 2022;375:1105–1110. doi: 10.1126/science.abo4089. - DOI - PubMed

Publication types