. 2022 Nov 16;13(1):7015.
doi: 10.1038/s41467-022-34676-w.

Elective nodal irradiation mitigates local and systemic immunity generated by combination radiation and immunotherapy in head and neck tumors

Affiliations

Elective nodal irradiation mitigates local and systemic immunity generated by combination radiation and immunotherapy in head and neck tumors

Laurel B Darragh et al. Nat Commun. .

Erratum in

Abstract

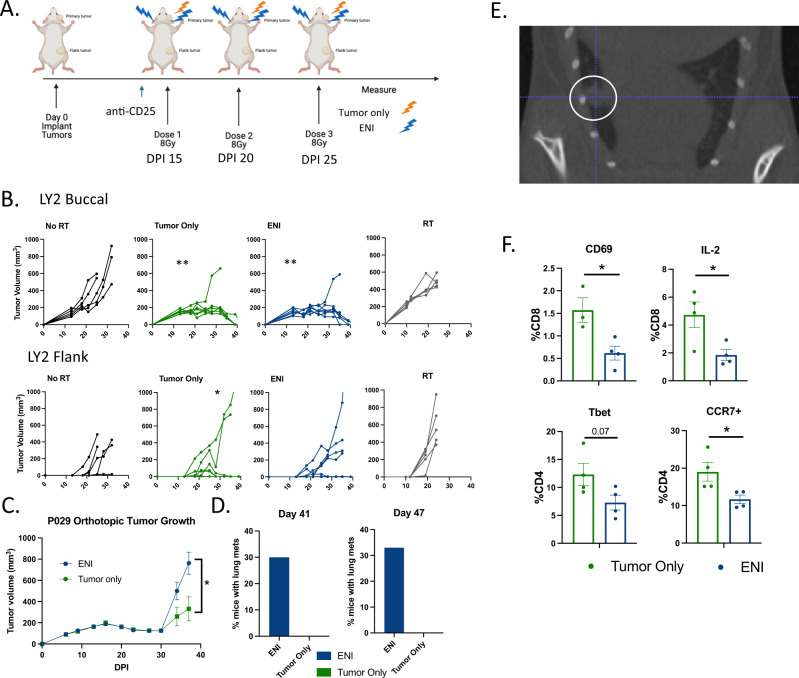
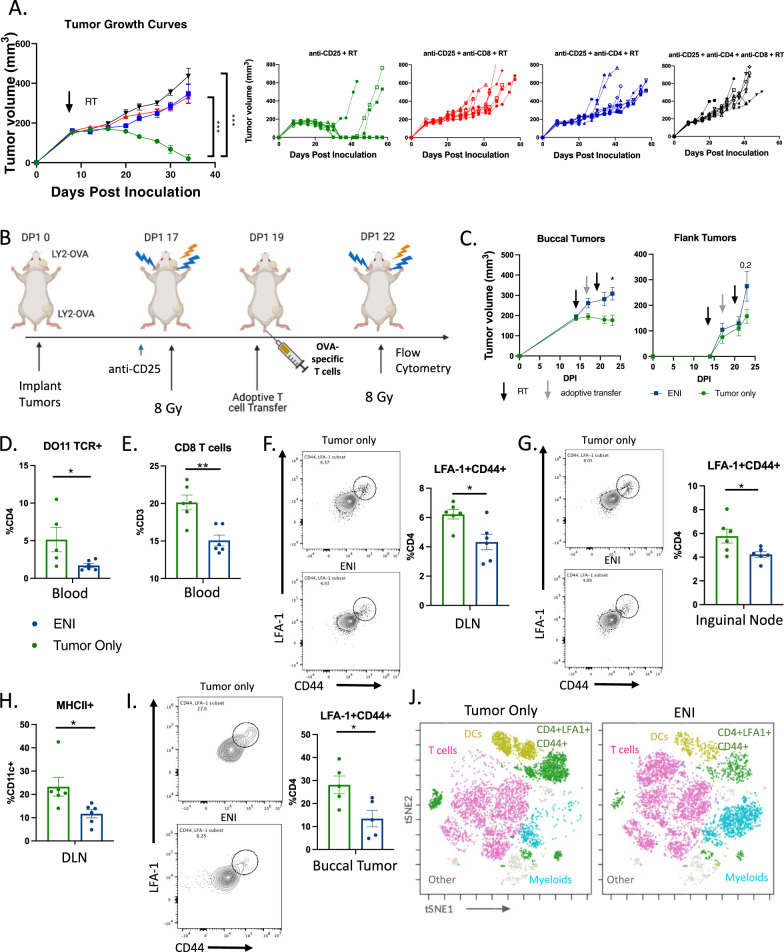
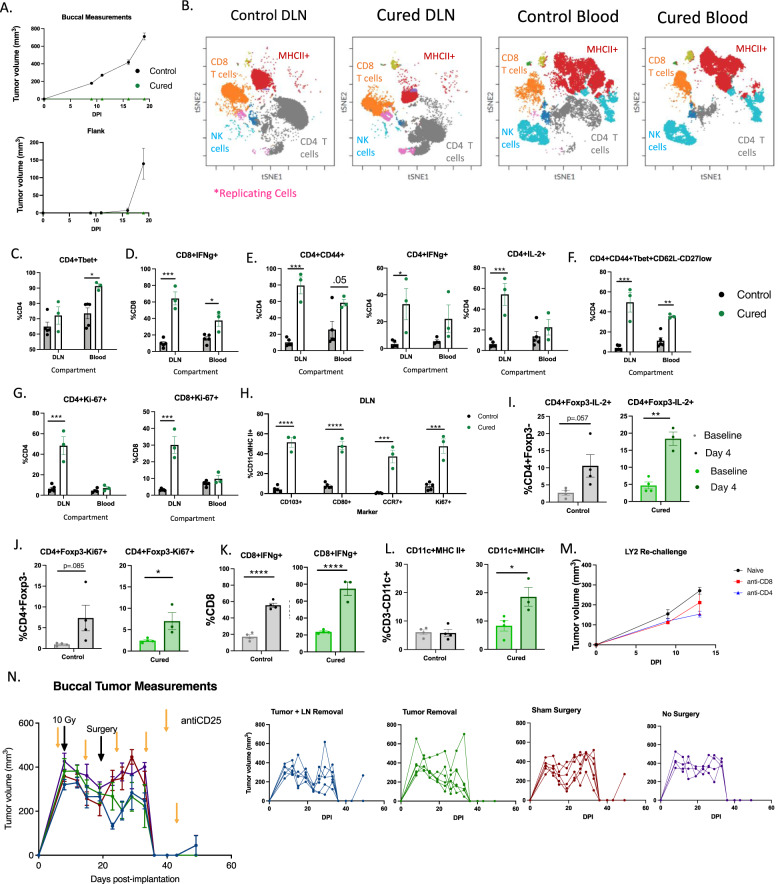
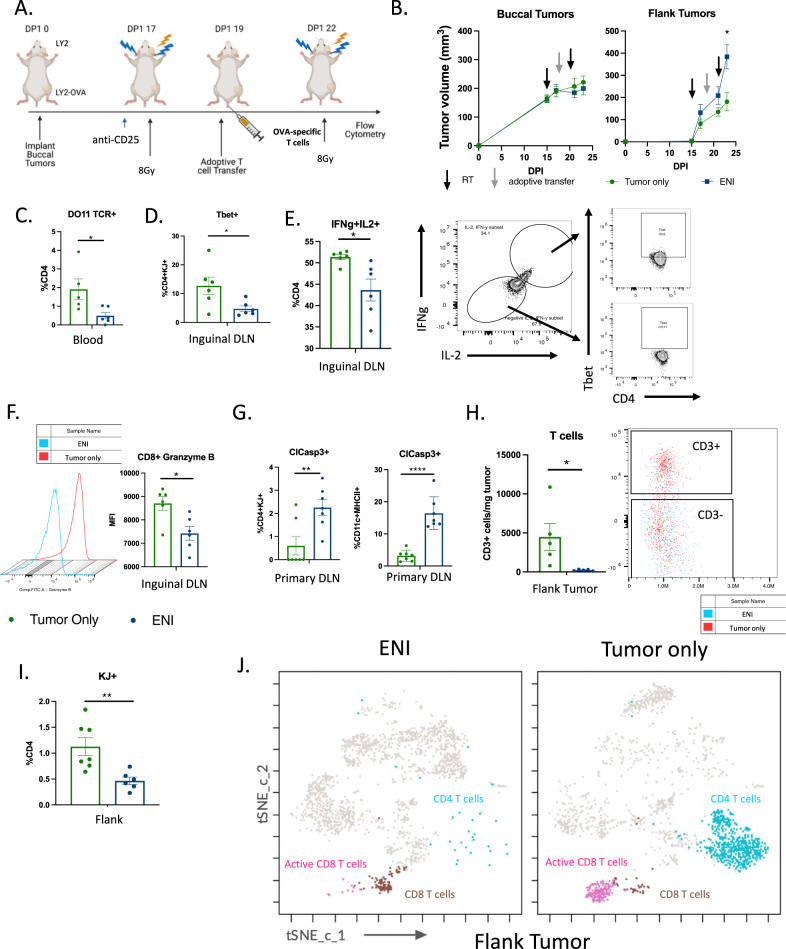
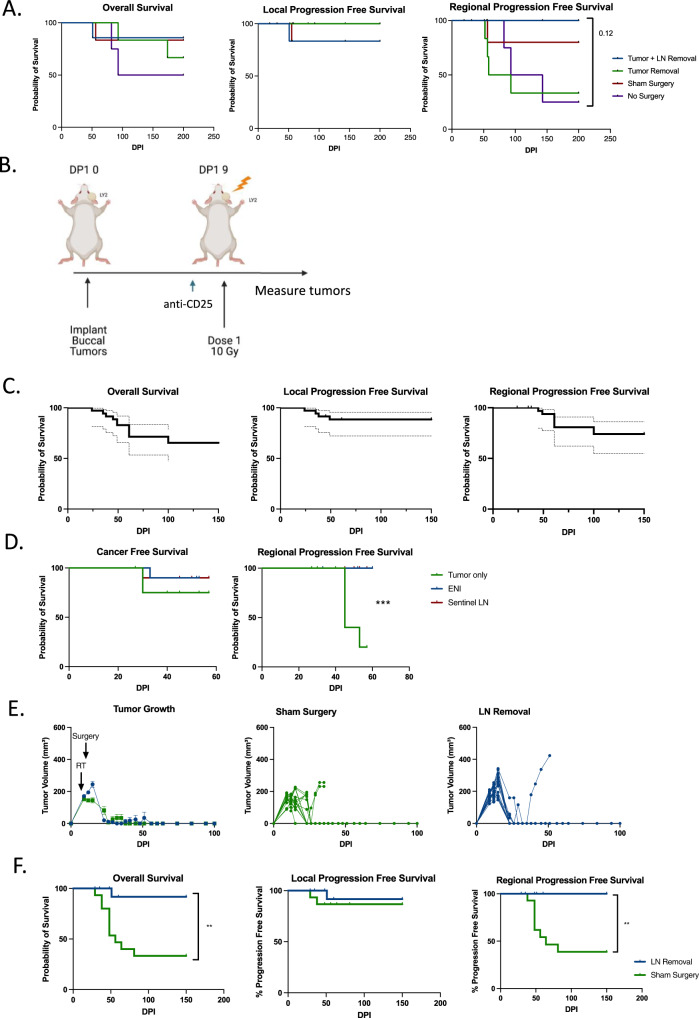
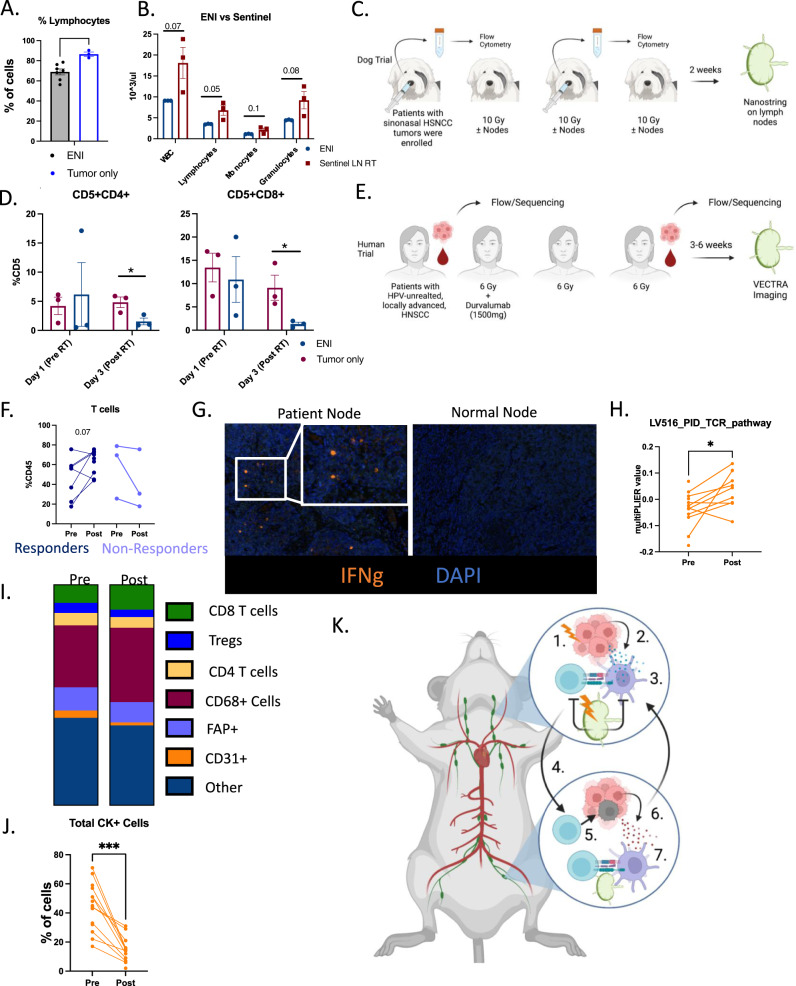
In the setting of conventional radiation therapy, even when combined with immunotherapy, head and neck cancer often recurs locally and regionally. Elective nodal irradiation (ENI) is commonly employed to decrease regional recurrence. Given our developing understanding that immune cells are radio-sensitive, and that T cell priming occurs in the draining lymph nodes (DLNs), we hypothesize that radiation therapy directed at the primary tumor only will increase the effectiveness of immunotherapies. We find that ENI increases local, distant, and metastatic tumor growth. Multi-compartmental analysis of the primary/distant tumor, the DLNs, and the blood shows that ENI decreases the immune response systemically. Additionally, we find that ENI decreases antigen-specific T cells and epitope spreading. Treating the primary tumor with radiation and immunotherapy, however, fails to reduce regional recurrence, but this is reversed by either concurrent sentinel lymph node resection or irradiation. Our data support using lymphatic sparing radiation therapy for head and neck cancer.


Conflict of interest statement

Dr. Karam receives clinical funding from Genentech and Ionis that does not relate to this work. She receives clinical trial funding from AstraZeneca, a part of which is included in this manuscript. She also receives preclinical research funding from Roche for work related to the anti-CD25 antibody, which is utilized as immunotherapy in this manuscript. The remaining authors declare no competing interests.

Figures

Fig. 1
Fig. 1. ENI ablates the immune response to combined radiation and immunotherapy.
A Schematic of the experimental design for gross tumor irradiation with or without elective nodal irradiation (ENI). Mice were implanted both in the buccal and in the flank on day 0 post-implantation (DPI). Stereotactic body irradiation (SBRT) was given when tumors reached ~150mm3 and anti-CD25 was given a day before SBRT. Created with BioRender.com. B Tumor growth curves, from the experiment depicted in (A), Buccal tumor (top) and flank tumor growth curves (bottom) for mice treated with anti-CD25 (n = 5), anti-CD25 and tumor only SBRT (n = 7), anti-CD25 and ENI (n = 7), and tumor only SBRT alone (n = 5). C Buccal tumor growth curves for mice implanted with the P029 cell line (n = 10 per group). Mice were implanted in the buccal on day 0 post-implantation (DPI). SBRT was given when tumors reached ~150mm3 and anti-CD25 was given a day before SBRT and once a week thereafter. The doses of SBRT were spaced by 4–5 days. D Quantification of the percentage of mice with P029 tumors that had radiographically detectable lung metastases at days 41 (ENI, n = 10; tumor only, n = 7) and 47 (ENI, n = 9; tumor only, n = 7) post-tumor cell implantation. Lung metastases were evaluated by microCT images. E A representative microCT image of a lung metastasis identified in a mouse treated with ENI in the P029 model. A metastasis is highlighted with a white circle. F Flow cytometry analysis of blood taken from mice at day 24 DPI in the experiment depicted in (A) (ENI, n = 4; tumor only, n = 4). CD8 T cells were defined as CD45+CD3+CD8+ and CD4 T cells were defined as CD45+CD3+CD4+. For tumor growth at different time points, 3 or more groups differences were determined by a One-Way ANOVA test with Tukey’s post hoc comparisons, with only 2 groups a Two-Way ANOVA was used. To test if there is a difference between tumor only SBRT and ENI treatment groups in reducing the number of mice that grew flank tumors, we used a Fischer’s Exact test. For the flow cytometry analysis, a two-tailed student’s t-test was used. Significance was determined if the p-value was <0.05* and <0.01**. The error bars represent the standard error of the mean (± SEM). Source data are provided as a Source Data file. p-values are indicated for figures B. buccal tumor only **0.0035, buccal ENI **0.0032, *0.0278, (C) *0.0371, and (F) CD69 *0.0222, IL-2 *0.0284, CCR7 *0.0366.
Fig. 2
Fig. 2. ENI decreases antigen-experienced T cell expansion in the DLNs and infiltration into the TME.
A Tumor growth curves of mice depleted of CD4 T cells, CD8 T cells, both CD4 and CD8 T cells, or neither before tumor implantation (n = 10 for all groups). Mice with LY2 tumors were treated with 10 Gy × 1 SBRT to the tumor only when the tumors reached ~200mm3 and treated with anti-CD25. B Schematic of experimental design. OVA-specific T cells (1 × 105 cells) were adoptively transferred into the mice via tail vein injection after the first dose of SBRT. At day 23 post-tumor cell implantation tumors, DLNs, and blood were harvested for flow cytometry. Created with BioRender.com. C Buccal and flank tumor growth curves for the experiment described in (B) (tumor only, n = 7; ENI n = 10). D Quantification of the percentage of CD4 T cells (CD45+CD3+CD4+) in the blood that were also DO11 TCR+ (tumor only, n = 5; ENI n = 6). E Quantification of CD8 T cells (CD45+CD3+CD8+) in the blood (tumor only, n = 6; ENI n = 6). F Flow plots and quantification of CD4+LFA−1+CD44+ T cells in the primary tumor DLN (tumor only, n = 6; ENI n = 6). G Flow plots and quantification of LFA1+CD44+CD4 T cells in the inguinal node (tumor only, n = 6; ENI n = 6). H Quantification of DCs (CD45+CD3−CD11c+MHCII+) in the primary tumor DLN (tumor only, n = 6; ENI n = 6). I Flow plots and quantification of LFA-1+CD44+ T cells in the buccal tumor (tumor only, n = 5; ENI n = 5). J t-SNE with FlowSOM population overlay of multi-spectral flow cytometry data (tumor only, n = 6; ENI n = 6). T cells (pink) were defined by expression of CD3 and CD4 or CD8, dendritic cells (DCs) (gold) were defined by CD3−CD11c+MHCII+ cells, CD4+LFA−1+CD44+ T cells (green) were defined by expression of CD4, LFA−1 and CD44, and myeloid cells (light blue) was defined by CD3−CD11c− cells. For tumor growth at selected time points, 3 or more groups differences were determined by a One-Way ANOVA test with Tukey’s post hoc comparisons, with only 2 groups a mixed-effects model was used. For the flow cytometry analysis, a two-tailed student’s t test was used. Significance was determined if the p-value was <0.05*, <0.01**, and <0.001***. The error bars represent the standard error of the mean (±SEM). Source data are provided as a Source Data file. p-values are indicated for figures A.**0.0014, CD8 depletion ***0.0002, double depletion ***0.0001 C. *0.0183, D. *0.0478, E. **0.002, F. *0.0125, G. *0.0366, H. *0.024, and I. *0.252.
Fig. 3
Fig. 3. Systemic, long-term, DLN-independent memory is formed with tumor only SBRT.
A Tumor growth curves of mice rechallenged with LY2 tumor cells in both the buccal and in the flank (Cured, n = 3; Naïve, n = 8). B t-SNE clustering and FlowSOM clusters superimposed of CD45+ immune cells in the DLN and Blood. CD8 T cells (CD3+CD8+), CD4 T cells (CD3+CD4+), NK cells (CD3-NKp46+), replicating cells (Ki-67+), and MHCII+ cells are highlighted. CH Quantification of activation markers expressed by T cells in the DLN and in the blood of naive mice or mice rechallenged with LY2 cells in the buccal (<6 months after initial eradication) (Cured, n = 3; Naïve, n = 5). IL Quantification of immune cells in the blood of mice before and after rechallenging with LY2 cells in the buccal or implanting LY2 cells into naïve mice (<6 months after initial eradication) (Cured, n = 4; Naïve, n = 4). M Tumor growth curves of naïve mice or cured mice treated with either a CD8 or CD4 T cell depleting antibody (anti-CD4, n = 5; anti-CD8, n = 3; naïve, n = 5). N Tumor growth curves of mice treated with neoadjuvant SBRT and anti-CD25 with a neck dissection occurring on day 19 post-tumor implantation. Individual tumor growth curves are provided to the right (Tumor and LN removal, n = 6; Tumor removal, n = 6; sham surgery, n = 6; no surgery, n = 4). A two-tailed student’s t test was used to examine group differences. Significance was determined if the p-value was <0.05*, <0.01**, <0.001***, and <0.0001****. The error bars represent the standard error of the mean (±SEM). Source data are provided as a Source Data file. p-values are indicated for figures C. *0.011, D. ***0.0002, *0.0114, E. CD4+CD44+***0.0001, *0.0137, CD4+IL-2+ ***0.0009, F. ***0.0008, **0.0014, G. CD4***0.0007, CD8***0.0003, H. CD103**** < 0.0001, CD80**** < 0.0001, CCR7***0.0006, Ki-67***0.0004, I. **0.0011, J. *0.0423, K. control ****<0.0001, cured ****<0.0001, and L. *0.0341.
Fig. 4
Fig. 4. ENI reduces epitope spreading and T cell activation in the distant DLN and tumor.
A Schematic of experimental design. An adoptive transfer of DO11 CD4 T cells (1 × 105 cells) was given to the mice two days after the first dose of SBRT. Tissue was harvested three days after the last dose of SBRT. Created with BioRender.com. B Tumor growth curves of the mice depicted in (A) (tumor only, n = 9; ENI, n = 10). C Quantitation of the percentage of CD4+ T cells that were positive for the DO11 TCR (KJ+) in the blood (ENI, n = 6; tumor only, n = 5). D Quantification of Tbet+ antigen-specific CD4 T cells (DO11 TCR+ or KJ+) in the inguinal DLN (ENI, n = 6; tumor only, n = 6). E Quantitation of IFNg+IL-2+CD4 T cells in the inguinal lymph node (ENI, n = 6; tumor only, n = 6). Gating strategy for IFNg+IL-2+ cells are provided on the right. Representative flow plots of Tbet expression in IFNg+IL-2+ and IFNg-IL-2- cells are also shown. F Quantitation of the mean florescent intensity (MFI) of Granzyme B in CD8 T cells in the inguinal lymph node. Histogram of MFI is provided to the left (ENI, n = 6; tumor only, n = 6). G Quantification of cleaved caspase 3 expression on KJ+CD4 T cells and on DCs (CD11c+MHCII+) in the DLNs (ENI, n = 7; tumor only, n = 7). H Quantification of the number of CD3+ T cells in the flank tumor. Flow plot of CD3+ cells are provided to the right (ENI, n = 5; tumor only, n = 5). I Quantification of KJ+CD4 T cells in the flank tumor (ENI, n = 6; tumor only, n = 6). J t-SNE with FlowSOM population overlay of CD45+ cells (ENI, n = 6; tumor only, n = 6). CD8 T cells (brown) were defined as having CD3 and CD8 expression. Activation CD8 T cells (pink) were defined as having expression of CD3, CD8, IFNg and Granzyme B expression. CD4 T cells (blue) were defined as having CD3 and CD4 expression. For tumor growth at selected time points, treatment difference was determined by a Two-Way ANOVA test. For the flow cytometry analysis, a two-tailed student’s t test was used. Significance was determined if the p-value was <0.05*, <0.01**, and <0.001***. The error bars represent the standard error of the mean (± SEM). Source data are provided as a Source Data file. p-values are indicated for figures B. *0.015, C. *0.0260, D. *0.0313, E. *0.015, F. *0.011, G. **0.0077, ****<0.0001, H. *0.0391, and I. **0.0068.
Fig. 5
Fig. 5. Sentinel node resection, or irradiation, reduces regional recurrence.
A Overall survival, local progression free survival and regional progression free survival curves for mice treated with a late neck resection depicted in Supplementary Fig. 4E (Tumor+LN removal, n = 6; Tumor removal, n = 6; Sham surgery, n = 6; and no surgery, n = 4). B Schematic of experimental design to look at rates of regional progression in the setting of tumor only SBRT and anti-CD25 with or without a distant tumor (n = 10 for buccal and flank tumor group and n = 15 for only buccal tumor group). Created with BioRender.com. C Overall survival, local progression free survival, and regional progression free survival curves for mice implanted with a buccal tumor or a buccal tumor and a flank tumor. 95% C.I. is shown in dotted lines (n = 25 mice). D Regional progression free survival and cancer free survival of mice treated with ENI, tumor only SBRT, or Sentinel Lymph node SBRT (ENI, n = 10; tumor only SBRT, n = 10, and Sentinel LN SBRT, n = 10). Experimental design is depicted in Supplementary Fig. 7F. E Tumor growth curves for mice treated with or without sentinel lymph node removal (n = 15 for both groups). To the right, the individual curves are shown. F Overall survival, local progression free survival, and regional progression free survival curves are shown for mice treated with sentinel lymph node removal (n = 15 for both groups). A log-rank (Mantel–Cox) test was conducted to determine the survival difference between treatment groups. Significance was determined if the p-value was <0.05*, <0.01**, and <0.001***. Source data are provided as a Source Data file. p-values are indicated for figures E. ***0.0001, and G. **0.0021, **0.0018.
Fig. 6
Fig. 6. Tumor only SBRT increases immune responses in canines and humans with HNSCC.
A Complete blood count from B16-OVA mice from Supplemental Fig. 2B (ENI, n = 7; tumor only, n = 3). B Complete blood count from LY2 mice from Fig. 5D (Sentinel LN, n = 3; ENI, n = 3). C Schematic of the clinical trial conducted in dogs diagnosed with sinonasal cancer and treated with SBRT with or without ENI. D Quantitation of CD4 (CD5+CD4+) and CD8 (CD5+CD8+) T cells from nasal lavages of dogs (ENI, n = 3; tumor only, n = 3). E Schematic of human phase I/Ib clinical trial using neoadjuvant SBRT and Durvalumab. F Quantitation of the percentage of CD45+ cells that are CD3+ T cells in the blood of patients before and after treatment with SBRT and durvalumab (Responders, n = 9; Non-responders, n = 3). G Representative multispectral fluorescent images of lymph nodes from patients and normal control nodes. IFNg is in orange. H MultiPLIER quantification of genes involved in TCR activation and genes downstream of TCR activation (n = 14 patients). I Quantification of cells within the TME of patients before and after treatment. J Quantification of cancer cells (CK+) in patients before and after treatment (n = 18). K Model of how SBRT triggers a systemic immune response and how ENI reduces that response. 1. SBRT increases antigen in the TME, 2. antigen is acquired by DCs, which 3. present antigen to T cells in DLNs. These activated T cells act on the local tumor, but also 4. enter systemic circulation and go to the distant tumor site and 5. kills cancer cells which 6. release new antigen upon cell death. 7. These new antigens are presented to T cells in the distant DLN and triggers additional antigen-specific T cells to distant tumor only antigens. ENI decreases this systemic immune response by decreasing DC activation of antigen-specific T cells in the DLNs by radiation induced cell death. A two-tailed un-paired Student’s t test was used for mouse and canine data. A two-tailed paired Student’s t test was used for the human data. Significance was determined if the p-value was <0.05*, <0.01**, and <0.001***. The error bars represent the standard error of the mean (±SEM). Source data are provided as a Source Data file. p-values are indicated for figures A. **0.0071, D. CD4 *0.0375, CD8 *0.0451, H. *0.0346, and J. ***0.0002. Panels (C, E and K) created with BioRender.com.

Similar articles

Cited by

References

    1. Manukian, G., Bar-Ad, V., Lu, B., Argiris, A. & Johnson, J. M. Combining radiation and immune checkpoint blockade in the treatment of head and neck squamous cell carcinoma. Front Oncol.9, 122 (2019). - PMC - PubMed
    1. Hui, C. et al. Overcoming resistance to immunotherapy in head and neck cancer using radiation: a review. Front Oncol.11, 592319 (2021). - PMC - PubMed
    1. Pennock, G. K. & Chow, L. Q. The evolving role of immune checkpoint inhibitors in cancer treatment. Oncologist20, 812–822 (2015). - PMC - PubMed
    1. Lee, N. Y. et al. Avelumab plus standard-of-care chemoradiotherapy versus chemoradiotherapy alone in patients with locally advanced squamous cell carcinoma of the head and neck: a randomised, double-blind, placebo-controlled, multicentre, phase 3 trial. Lancet Oncol.22, 450–462 (2021). - PubMed
    1. McBride, S. et al. Randomized phase II trial of nivolumab with stereotactic body radiotherapy versus nivolumab alone in metastatic head and neck squamous cell carcinoma. J. Clin. Oncol.39, 30–37 (2021). - PMC - PubMed

Publication types