

NETome: A model to Decode the Human Genome and Proteome of Neutrophil Extracellular Traps
- PMID: 36385149
- PMCID: PMC9668915
- DOI: 10.1038/s41597-022-01798-1
NETome: A model to Decode the Human Genome and Proteome of Neutrophil Extracellular Traps
Abstract
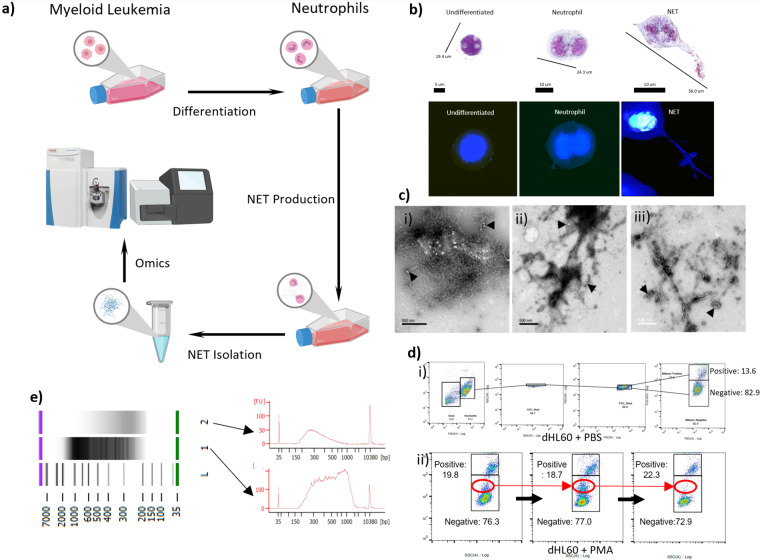
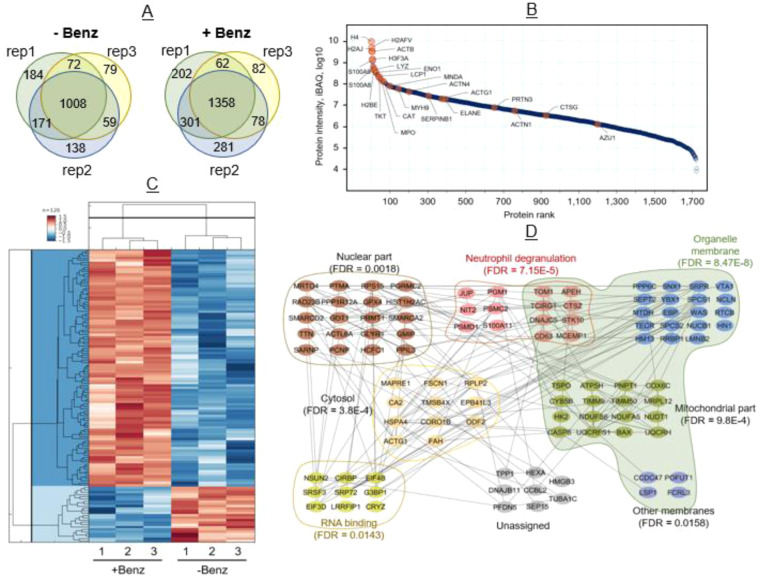
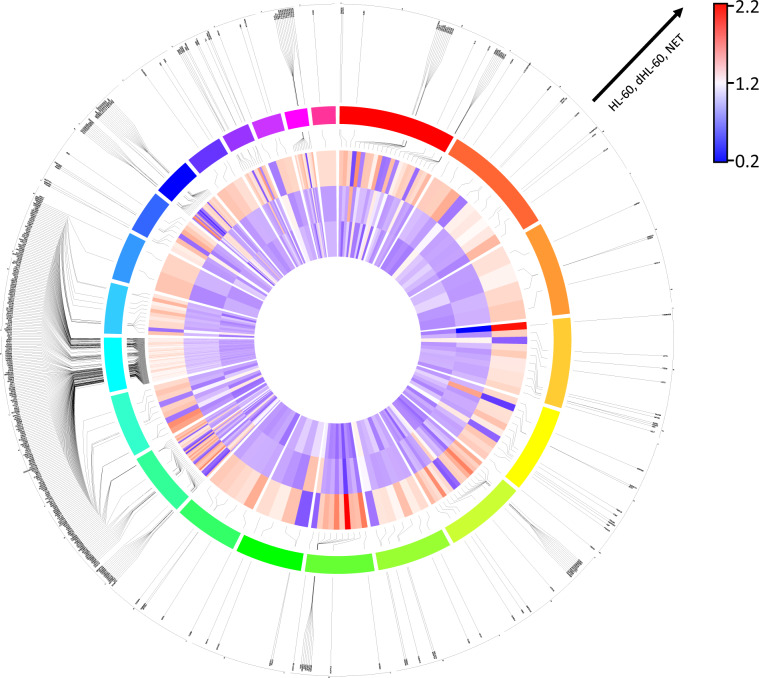
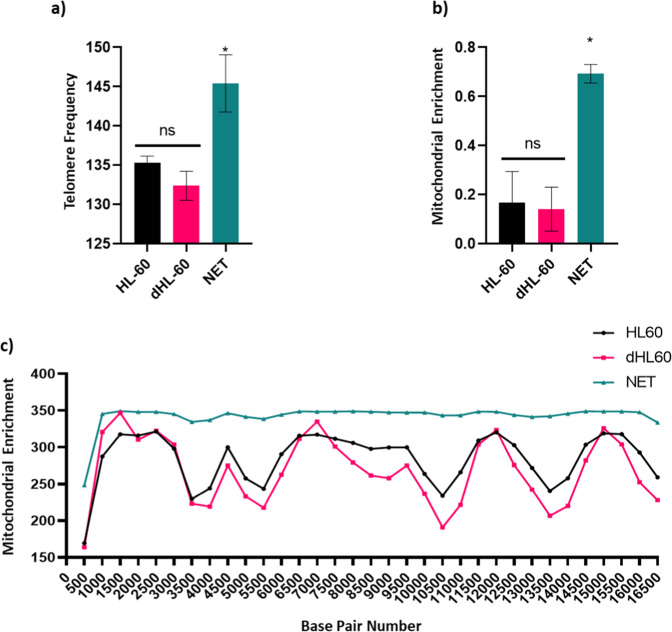
Neutrophils are the most abundant type of white blood cells in humans with biological roles relevant to inflammation, and fighting off infections. Neutrophil Extracellular Traps (NETs) act as enxogenous agents controlling invasion by bacteria, viruses, fungi, metabolic, and traumatic agents. Traditionally, studies have focused on elucidating molecular and cellular pathways preceding NET formation. Here, we developed a model to decode the human genome and proteome of developted NETs. Via in vitro system to differentiate HL-60 human myeloid cell line into neutrophil extracellular trap (ecTrap) producing cells, we isolated and captured ectrap derived DNA and proteins for shotgun sequencing. The genomic sequences revealed accurate delineation of gene composition including immune response genes and mitochondrial enrichment, while providing a reference database for future interrogation. Shotgun proteomics showed global proteins in differentiated cells with specific immune pathways when compared to undifferentiated counterparts. Coupled with omics' approaches, we validated our system by functional assays and began to dissect host-microbial interactions. Our work provides a new understanding of the genomic and proteomic sequences, establishing the first human database deposition of neutrophil extracellular traps.
© 2022. The Author(s).
Conflict of interest statement
The authors declare no competing interests.
Figures
Similar articles
-
NET Proteome in Established Type 1 Diabetes Is Enriched in Metabolic Proteins.Cells. 2023 May 5;12(9):1319. doi: 10.3390/cells12091319. Cells. 2023. PMID: 37174719 Free PMC article.
-
Thrombin and Plasmin Alter the Proteome of Neutrophil Extracellular Traps.Front Immunol. 2018 Jul 9;9:1554. doi: 10.3389/fimmu.2018.01554. eCollection 2018. Front Immunol. 2018. PMID: 30038618 Free PMC article.
-
Mouse Bone Marrow Neutrophil Extracellular Trap Proteomics by Microbial Stimuli.Sci Data. 2025 May 23;12(1):853. doi: 10.1038/s41597-025-05181-8. Sci Data. 2025. PMID: 40410159 Free PMC article.
-
Avoiding the trap: Mechanisms developed by pathogens to escape neutrophil extracellular traps.Microbiol Res. 2021 Feb;243:126644. doi: 10.1016/j.micres.2020.126644. Epub 2020 Nov 5. Microbiol Res. 2021. PMID: 33199088 Review.
-
Neutrophil extracellular traps as a new paradigm in innate immunity: friend or foe?Periodontol 2000. 2013 Oct;63(1):165-97. doi: 10.1111/prd.12025. Periodontol 2000. 2013. PMID: 23931060 Review.
Cited by
-
Natural and induced immune responses in oral cavity and saliva.BMC Immunol. 2025 Apr 18;26(1):34. doi: 10.1186/s12865-025-00713-8. BMC Immunol. 2025. PMID: 40251519 Free PMC article. Review.
-
Persistent immune and clotting dysfunction detected in saliva and blood plasma after COVID-19.Heliyon. 2023 Jul 4;9(7):e17958. doi: 10.1016/j.heliyon.2023.e17958. eCollection 2023 Jul. Heliyon. 2023. PMID: 37483779 Free PMC article.
-
Lipid Metabolism Reprogramming of Immune Cells in Acne: An Update.Clin Cosmet Investig Dermatol. 2023 Sep 1;16:2391-2398. doi: 10.2147/CCID.S424478. eCollection 2023. Clin Cosmet Investig Dermatol. 2023. PMID: 37675181 Free PMC article. Review.
-
Effects of calcium oxalate crystals on neutrophil cellular proteome and functions: implications for nephrolithiasis.Cell Commun Signal. 2025 Jul 11;23(1):336. doi: 10.1186/s12964-025-02345-2. Cell Commun Signal. 2025. PMID: 40646566 Free PMC article.
References
-
- Janeway, CA. The immune system in health and disease. http://www.garlandscience.com 2001. https://ci.nii.ac.jp/naid/10027833236/ (accessed 5 Jun2019).
Publication types
MeSH terms
Substances
Grants and funding
LinkOut - more resources
Full Text Sources
