. 2023 Apr;28(4):1571-1584.
doi: 10.1038/s41380-022-01862-7. Epub 2022 Nov 16.

Impact of alcohol exposure on neural development and network formation in human cortical organoids

Affiliations

Impact of alcohol exposure on neural development and network formation in human cortical organoids

Jason W Adams et al. Mol Psychiatry. 2023 Apr.

Abstract

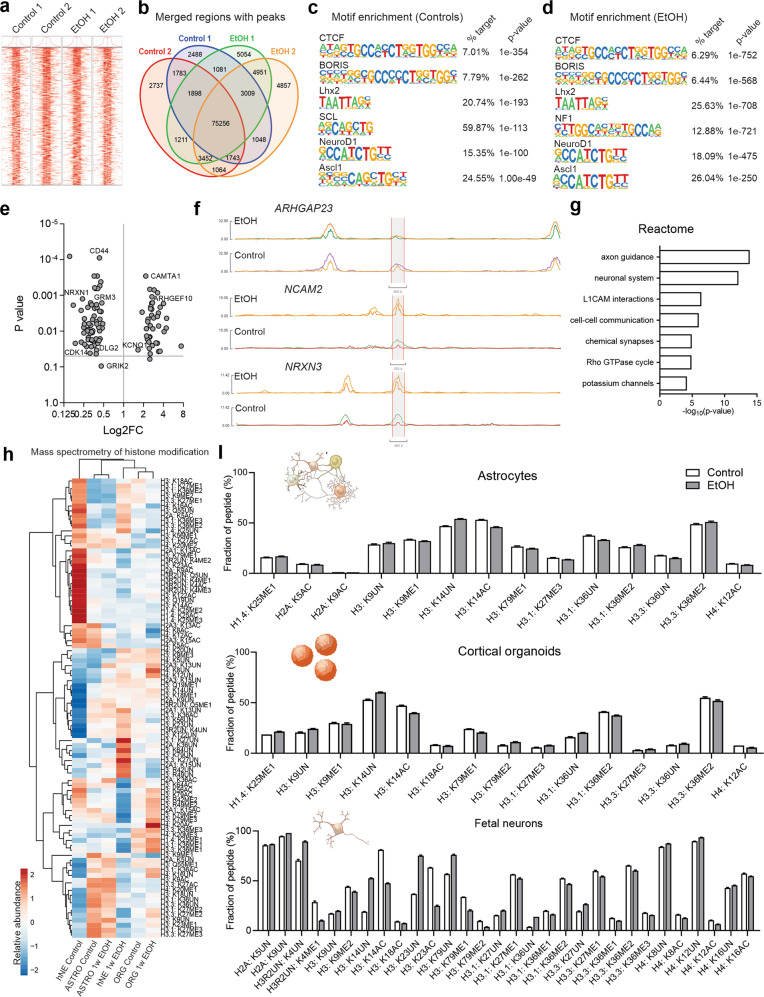
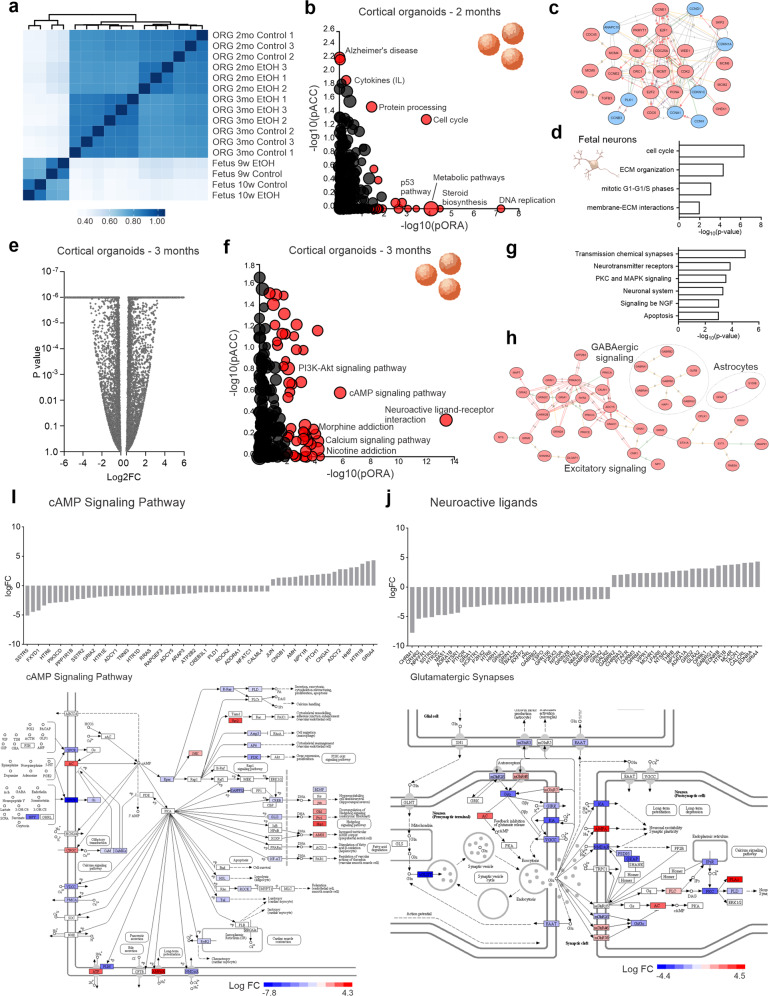
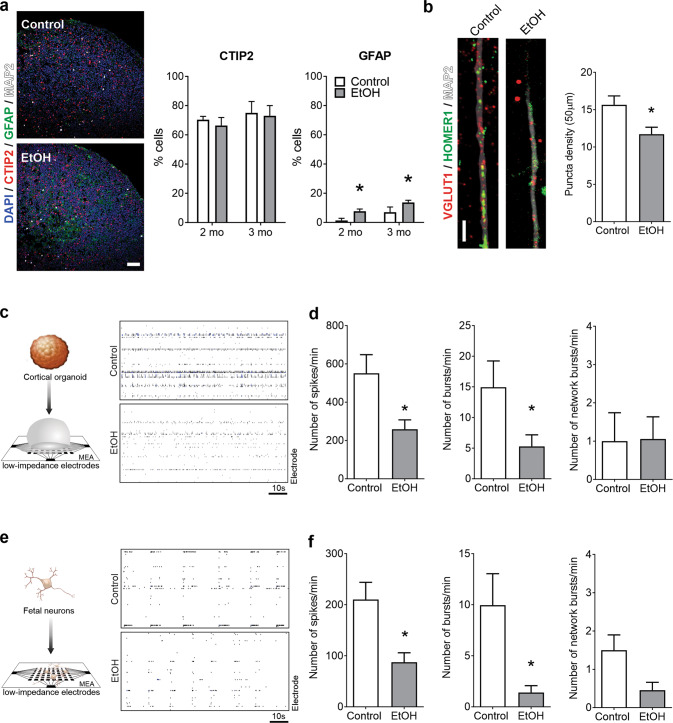
Prenatal alcohol exposure is the foremost preventable etiology of intellectual disability and leads to a collection of diagnoses known as Fetal Alcohol Spectrum Disorders (FASD). Alcohol (EtOH) impacts diverse neural cell types and activity, but the precise functional pathophysiological effects on the human fetal cerebral cortex are unclear. Here, we used human cortical organoids to study the effects of EtOH on neurogenesis and validated our findings in primary human fetal neurons. EtOH exposure produced temporally dependent cellular effects on proliferation, cell cycle, and apoptosis. In addition, we identified EtOH-induced alterations in post-translational histone modifications and chromatin accessibility, leading to impairment of cAMP and calcium signaling, glutamatergic synaptic development, and astrocytic function. Proteomic spatial profiling of cortical organoids showed region-specific, EtOH-induced alterations linked to changes in cytoskeleton, gliogenesis, and impaired synaptogenesis. Finally, multi-electrode array electrophysiology recordings confirmed the deleterious impact of EtOH on neural network formation and activity in cortical organoids, which was validated in primary human fetal tissues. Our findings demonstrate progress in defining the human molecular and cellular phenotypic signatures of prenatal alcohol exposure on functional neurodevelopment, increasing our knowledge for potential therapeutic interventions targeting FASD symptoms.


Conflict of interest statement

ARM is a co-founder and has equity interest in TISMOO, a company dedicated to genetic analysis and brain organoid modeling focusing on therapeutic applications customized for autism spectrum disorder and other neurological disorders with genetic origins. The terms of this arrangement have been reviewed and approved by the University of California San Diego in accordance with its conflict of interest policies.

Figures

Fig. 1
Fig. 1. Ethanol (EtOH) exposure alters proliferation and survival dynamics in human cellular models.
a EtOH was applied to ~4-week-old human iPSC-derived cortical organoids, ~2–4-week-old human iPSC-derived astrocytes, and human 10–11 post-conception weeks (PCW) fetal primary neurons. b Cortical organoid diameter is decreased by EtOH exposure (Student’s t-test, t541 = 17.05, P < 0.0001; n = 210–333 organoids/condition). c Immunohistochemistry portrays layers of Ki67+ proliferation (two months, Student’s t-test, t64 = 4.518, P < 0.0001; three months, Student’s t-test, t18 = 1.63, P = 0.12; n = 10–33 organoids/condition using WT83, CVB, and 4C1 cell lines). df EtOH exposure produces cell cycle alterations in cortical organoids (two-way analysis of variance (ANOVA), F3,16 = 8.14, P = 0.002; n = 3 replicates/condition, from WT83, CVB, and 4C1 cell lines) (d), iPSC-derived astrocytes (two-way ANOVA, F2,42 = 17.06, P < 0.0001; n = 8 replicates/condition, from WT83 and 4C1 cell lines) (e), and fetal neurons (two-way ANOVA, F2,42 = 41.92, P < 0.0001; n = 8 replicates/condition) (f). gi EtOH exposure promotes cell death, shown by CC3+ immunohistochemistry in cortical organoids (two months, Student’s t-test, t28 = 5.785, P < 0.0001; three months, Student’s t-test, t18 = 1.886, P = 0.076; n = 10–15 organoids/condition from WT83 cell line) (g) and Annexin+ in astrocytes (Student’s t-test, t14 = 15.03, P < 0.0001; n = 8 replicates/condition from WT83 and 4C1 cell lines) (h) and fetal neurons (Student’s t-test, t6 = 7.872, P = 0.0002; n = 4 replicates/condition) (i). Data are presented as mean ± standard error of the mean (s.e.m.). Scale bar = 100 µm.
Fig. 2
Fig. 2. EtOH affects chromatin accessibility in regions critical for neurodevelopment.
ag ATAC-seq analysis of two-month old control and EtOH-exposed cortical organoids. a Transcription start site (TSS) enrichment plot showing TSS ± 1.0 Kb for each sample. ‘Control 1’, ‘Control 2’, ‘EtOH 1’, and ‘EtOH 2’ labels denote independent batches of organoids made from the WT83 cell line. b Venn diagram depicts peaks in EtOH-exposed and control organoids. c, d Motif enrichment in control (c) and EtOH-exposed (d) organoids. e Plotting enrichment P values identifies prominent regions of altered accessibility. f Tracks plot of select prominent genes. g Reactome analysis predicts that the effects of altered chromatin accessibility concentrate in physiological processes central to neurodevelopment. h, i Mass spectrometry analysis shows histone modifications in astrocytes, cortical organoids, and fetal neurons (hNE) attributable to EtOH-exposure; cortical organoids and astrocytes were generated from the WT83 iPS cell line. Heatmap shows EtOH exposure modifies histone methylation (ME) and acetylation (AC) patterns in diverse neural cell types; scale bar portrays relative abundance of modification across samples: red=high compared to other samples, blue=low compared to other samples (h). A recurrent pattern of modifications is observed between astrocytes, organoids, and fetal neurons; only statistically significant differences in relative modification abundance are shown (i).
Fig. 3
Fig. 3. EtOH alters neurodevelopmental transcriptional pathways in cortical organoids and fetal neurons.
a RNAseq heatmap within cortical organoid and fetal neuron subgroups shows differential gene expression clustering by EtOH exposure. Scale indicates Pearson’s correlation coefficient. Cortical organoids are from the WT83 iPS cell line. b Visualization of prominently altered cell processes in two-month old EtOH-exposed organoids. Pathway enrichment analysis of genes altered by EtOH exposure is displayed according to total perturbation accumulation (pACC) and gene overrepresentation within pathways (pORA). Red dots represent pathways modified with a significant P value, proportional to the size of the dots. c Interactome depicting the interrelatedness of these processes. d Cross-comparative gene ontology analysis of EtOH-exposed fetal neurons shows overlapping pathway alterations with organoids. e Plot of P values for gene expression in three-month old organoids portrays range of alteration severity. f Visualization of prominently altered cell processes in three-month old EtOH-exposed organoids. g Gene ontology analysis of three-month old organoids shows gene expression alterations prominently affect neurotransmission and biochemical signaling pathways. h Interactome highlights involvement of key processes including excitatory and GABAergic signaling and astrocytic expression. i, j EtOH exposure impacts gene expression in prominent pathways with multifactorial downstream consequences. Shown are EtOH-induced changes in the cAMP signaling pathway (I) and glutamatergic synaptic function (j).
Fig. 4
Fig. 4. EtOH alters astrocytic and synaptic protein quantities and promotes differential protein abundance in cortical organoids.
a, b Western blot and quantification of astrocytic and synaptic protein markers in cortical organoids during development (two-way ANOVA for each protein; *P < 0.05, **P < 0.01, ***P < 0.001; n = 3 replicates (~5–10 organoids)/condition from independent organoid batches from the WT83 iPS cell line). c Principal components analysis of protein digital spatial profiling distinguishes distinct clusters between proliferative and non-proliferative regions and between EtOH-exposed and control samples (n~10 control and EtOH-exposed organoids) (d) Heatmap showing variation in protein abundance in organoid samples between distinct spatial and EtOH-exposure clusters. e Volcano plot of proliferative (rosette) regions from control and EtOH-exposed organoids highlights the differences in expression of various proteins. Green bar represents a P value of 0.05.
Fig. 5
Fig. 5. EtOH exposure increases astrocytic content and impairs network connectivity.
a Immunohistochemistry reveals no difference in the proportion of CTIP2+ cells (left graph; two months, P = 0.88; three months, P > 0.99; n = 3 organoids per age, per condition from WT83 and 4C1 iPS cell lines) but shows EtOH increases GFAP expression (right graph; two months, P = 0.017; three months, P = 0.013; two-way ANOVAs; n = 3 organoids per age, per condition from WT83 and 4C1 iPS cell lines). Scale bar = 50 μm. b EtOH exposure decreases co-localized synaptic puncta density (Student’s t-test, t32 = 2.59, P = 0.01; n = 17 neurons/condition from WT83, CVB, and 4C1 iPS cell lines). Scale bar = 10 μm. ce Multi-electrode array (MEA) analysis in WT83-based cortical organoids (c, d, n = 18 MEA wells/condition) and fetal neurons (e, f, n = 11–22 MEA wells/condition). c Representative cortical organoid MEA raster plot. d EtOH-exposed cortical organoids showed fewer spikes per minute (Student’s t-test, t34 = 2.68, P = 0.011) and fewer bursts (Student’s t-test, P = 0.047), although not network bursts (Student’s t-test, t34 = 0.06, P = 0.95). e Representative fetal neuron MEA raster plot. f EtOH-exposed fetal neurons showed fewer spikes per minute (Student’s t-test, t30 = 2.68, P = 0.012) and fewer bursts per minute (Student’s t-test, t40 = 2.60, P = 0.013), but not network bursts (Student’s t-test, t31 = 1.78, P = 0.085). Data are presented as mean ± s.e.m.
Fig. 6
Fig. 6. Pharmacological reversal of synaptic impairment associated with EtOH exposure.
a Schematic showing the drug treatment strategy of EtOH-exposed cortical organoids. b Western blot shows a reduced amount of the presynaptic protein Synapsin in EtOH-exposed organoids that is increased by treatment with Donepezil, but not Nefiracetam (Nefi) or IGF-1. c Levels of the postsynaptic protein PSD-95 were rescued by treatment with either Donepezil or Nefiracetam, but not IGF-1. d Donepezil treatment reversed the synaptic puncta impairment observed in EtOH-exposed organoids (one-way ANOVA with Dunnett’s test for multiple comparisons, F3,173 = 10.86, P < 0.0001; Control vs EtOH, P < 0.0001; Donepezil vs EtOH, P = 0.024; n = 48 neurites/condition from WT83, CVB, and 4C1 iPS cell lines), with lesser support for the efficacy of Nefiracetam (P = 0.066; n = 33 neurites from WT83 and CVB iPS cell lines). Dnpzl Donepezil. Nefi Nefiracetam. Data are presented as mean ± s.e.m.

References

    1. Roozen S, Peters G-JY, Kok G, Townend D, Nijhuis J, Curfs L. Worldwide prevalence of fetal alcohol spectrum disorders: a systematic literature review including meta-analysis. Alcohol Clin Exp Res. 2016;40:18–32. doi: 10.1111/acer.12939. - DOI - PubMed
    1. Lange S, Probst C, Rehm J, Popova S. Prevalence of binge drinking during pregnancy by country and World Health Organization region: systematic review and meta-analysis. Reprod Toxicol. 2017;73:214–21. doi: 10.1016/j.reprotox.2017.08.004. - DOI - PubMed
    1. Popova S, Lange S, Probst C, Gmel G, Rehm J. Global prevalence of alcohol use and binge drinking during pregnancy, and fetal alcohol spectrum disorder. Biochem Cell Biol. 2018;96:237–40. doi: 10.1139/bcb-2017-0077. - DOI - PubMed
    1. May PA, Chambers CD, Kalberg WO, Zellner J, Feldman H, Buckley D, et al. Prevalence of fetal alcohol spectrum disorders in 4 US communities. JAMA. 2018;319:474–82. doi: 10.1001/jama.2017.21896. - DOI - PMC - PubMed
    1. May PA, Gossage JP, Kalberg WO, Robinson LK, Buckley D, Manning M, et al. Prevalence and epidemiologic characteristics of FASD from various research methods with an emphasis on recent in-school studies. Dev Disabil Res Rev. 2009;15:176–92. doi: 10.1002/ddrr.68. - DOI - PubMed

Publication types

MeSH terms