

Robustness and efficiency of international pesticide trade networks subject to link removal strategies
- PMID: 36385189
- PMCID: PMC9666929
- DOI: 10.1038/s41598-022-21777-1
Robustness and efficiency of international pesticide trade networks subject to link removal strategies
Abstract
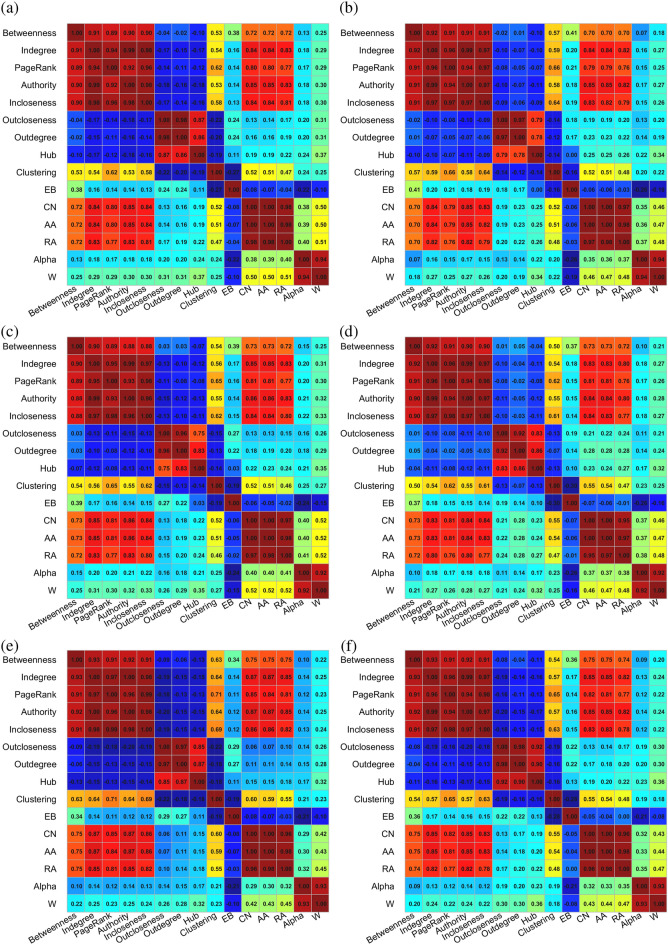
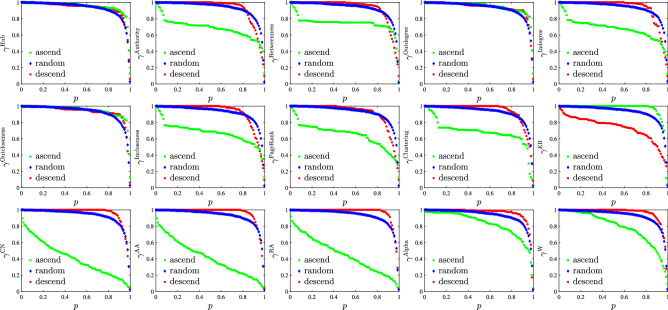
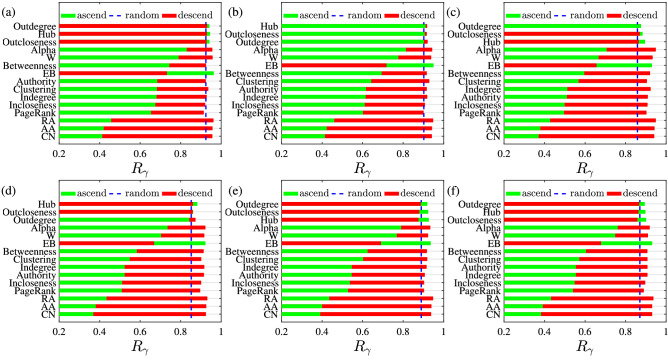
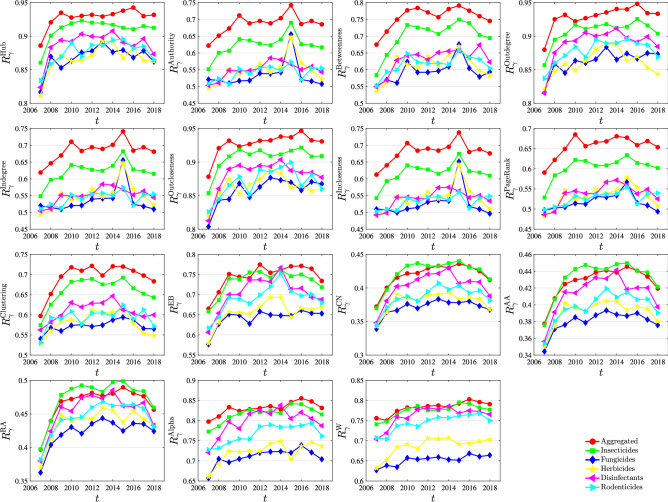
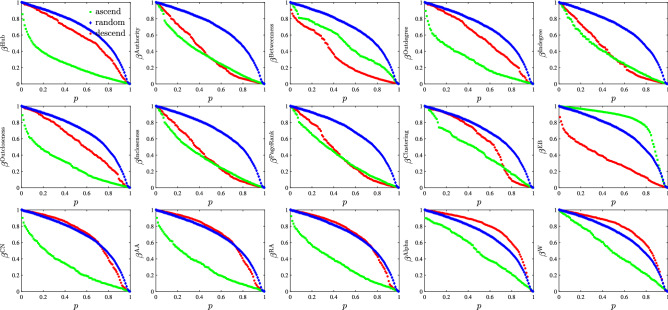
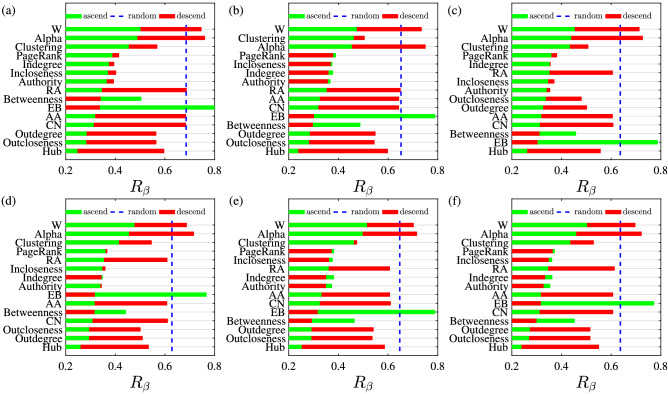
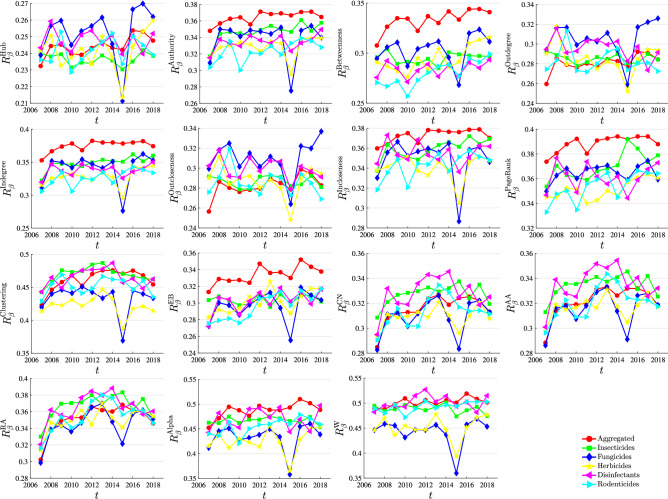
The international pesticide trade network (iPTN) is a key factor affecting global food production and food security. The trade relationship is a key component in iPTNs. In a complex international trade environment, we model the impacts of uncertain factors such as trade wars, economic blockades and local wars, as removing vital relationships in the trade network. There are many complex network studies on node centrality, but few on link centrality or link importance. We propose a new method for computing network link centrality. The main innovation of the method is in converting the original network into a dual graph, the nodes in the dual graph corresponding to the links of the original network. Through the dual graph, the node centrality indicators can measure the centrality of the links in the original network. We verify the effectiveness of the network link centrality indicator based on the dual graph in the iPTN, analyze the relationship between the existing network link centrality indicators and the indicator proposed in this paper, and compare their differences. It is found that the trade relationships with larger indicators (hub, outcloseness, outdegree) based on the dual graph have a greater impact on network efficiency than those based on the original pesticide trade networks.
© 2022. The Author(s).
Conflict of interest statement
The authors declare no competing interests.
Figures


Similar articles
-
Evolving community structure in the international pesticide trade networks.Heliyon. 2023 Oct 20;9(11):e21076. doi: 10.1016/j.heliyon.2023.e21076. eCollection 2023 Nov. Heliyon. 2023. PMID: 37928009 Free PMC article.
-
Dynamics of international Trade: A 30-year analysis of key exporting nations.PLoS One. 2023 Aug 1;18(8):e0289040. doi: 10.1371/journal.pone.0289040. eCollection 2023. PLoS One. 2023. PMID: 37527258 Free PMC article.
-
A network analysis of food flows within the United States of America.Environ Sci Technol. 2014 May 20;48(10):5439-47. doi: 10.1021/es500471d. Epub 2014 May 5. Environ Sci Technol. 2014. PMID: 24773310
-
Issues and gaps in international guidance and national regulatory systems affecting international live insect trade.Rev Sci Tech. 2022 May;41(1):198-210. doi: 10.20506/rst.41.1.3317. Rev Sci Tech. 2022. PMID: 35925620 Review. English.
-
Link Prediction on Complex Networks: An Experimental Survey.Data Sci Eng. 2022;7(3):253-278. doi: 10.1007/s41019-022-00188-2. Epub 2022 Jun 21. Data Sci Eng. 2022. PMID: 35754861 Free PMC article. Review.
Cited by
-
Analysis of the structure and robustness of the global semiconductor trade network.PLoS One. 2025 Jan 9;20(1):e0313162. doi: 10.1371/journal.pone.0313162. eCollection 2025. PLoS One. 2025. PMID: 39787179 Free PMC article.
References
-
- Freeman LC. Centrality in social networks conceptual clarification. Soc. Netw. 1979;1:215–239. doi: 10.1016/0378-8733(78)90021-7. - DOI
-
- Hage P, Harary F. Eccentricity and centrality in networks. Soc. Netw. 1995;17:57–63. doi: 10.1016/0378-8733(94)00248-9. - DOI
-
- Latora V, Marchiori M. A measure of centrality based on network efficiency. New J. Phys. 2007;9:188. doi: 10.1088/1367-2630/9/6/188. - DOI
Publication types
MeSH terms
Substances
Grants and funding
LinkOut - more resources
Full Text Sources
Medical
