Review
. 2023 Feb;18(2):396-423.
doi: 10.1038/s41596-022-00766-8. Epub 2022 Nov 16.

PepSeq: a fully in vitro platform for highly multiplexed serology using customizable DNA-barcoded peptide libraries

Affiliations
Review

PepSeq: a fully in vitro platform for highly multiplexed serology using customizable DNA-barcoded peptide libraries

Sierra N Henson et al. Nat Protoc. 2023 Feb.

Erratum in

Abstract

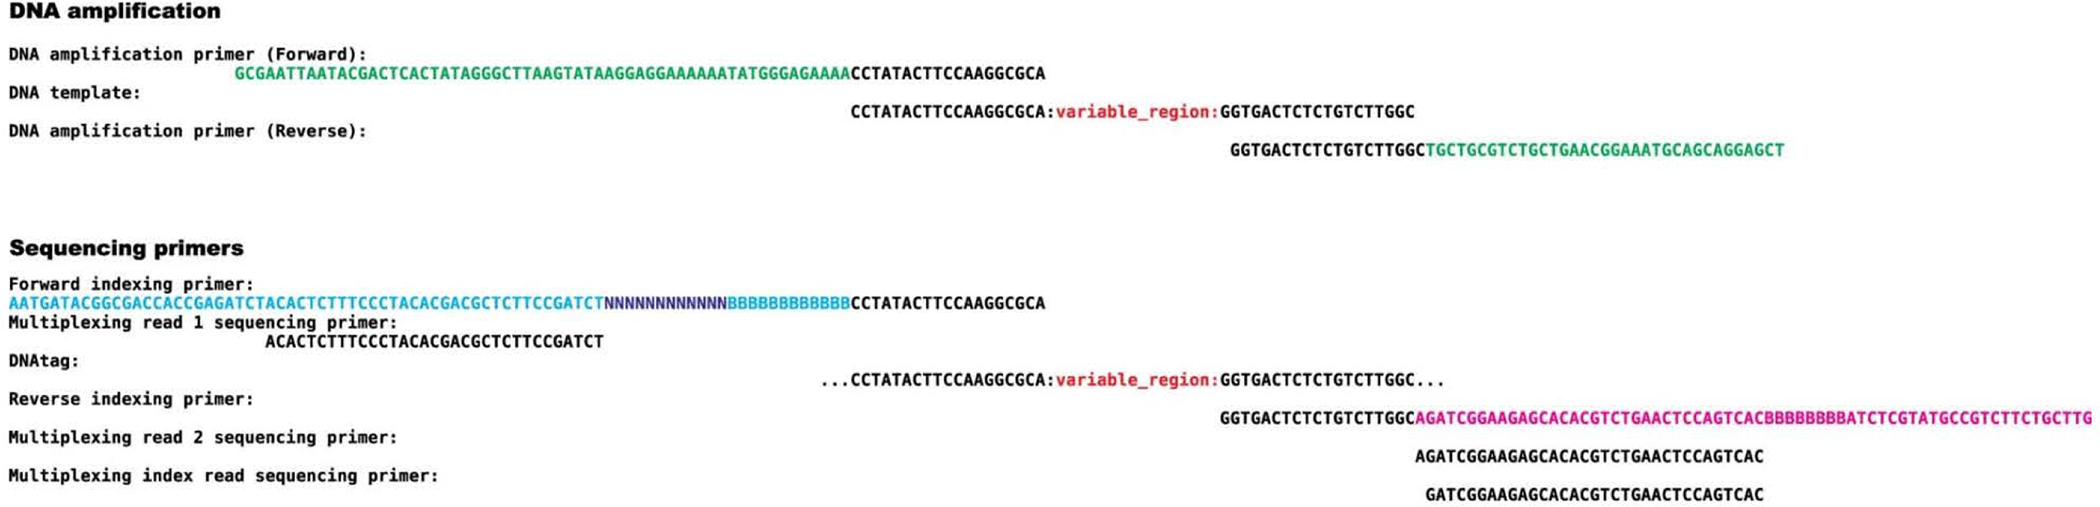
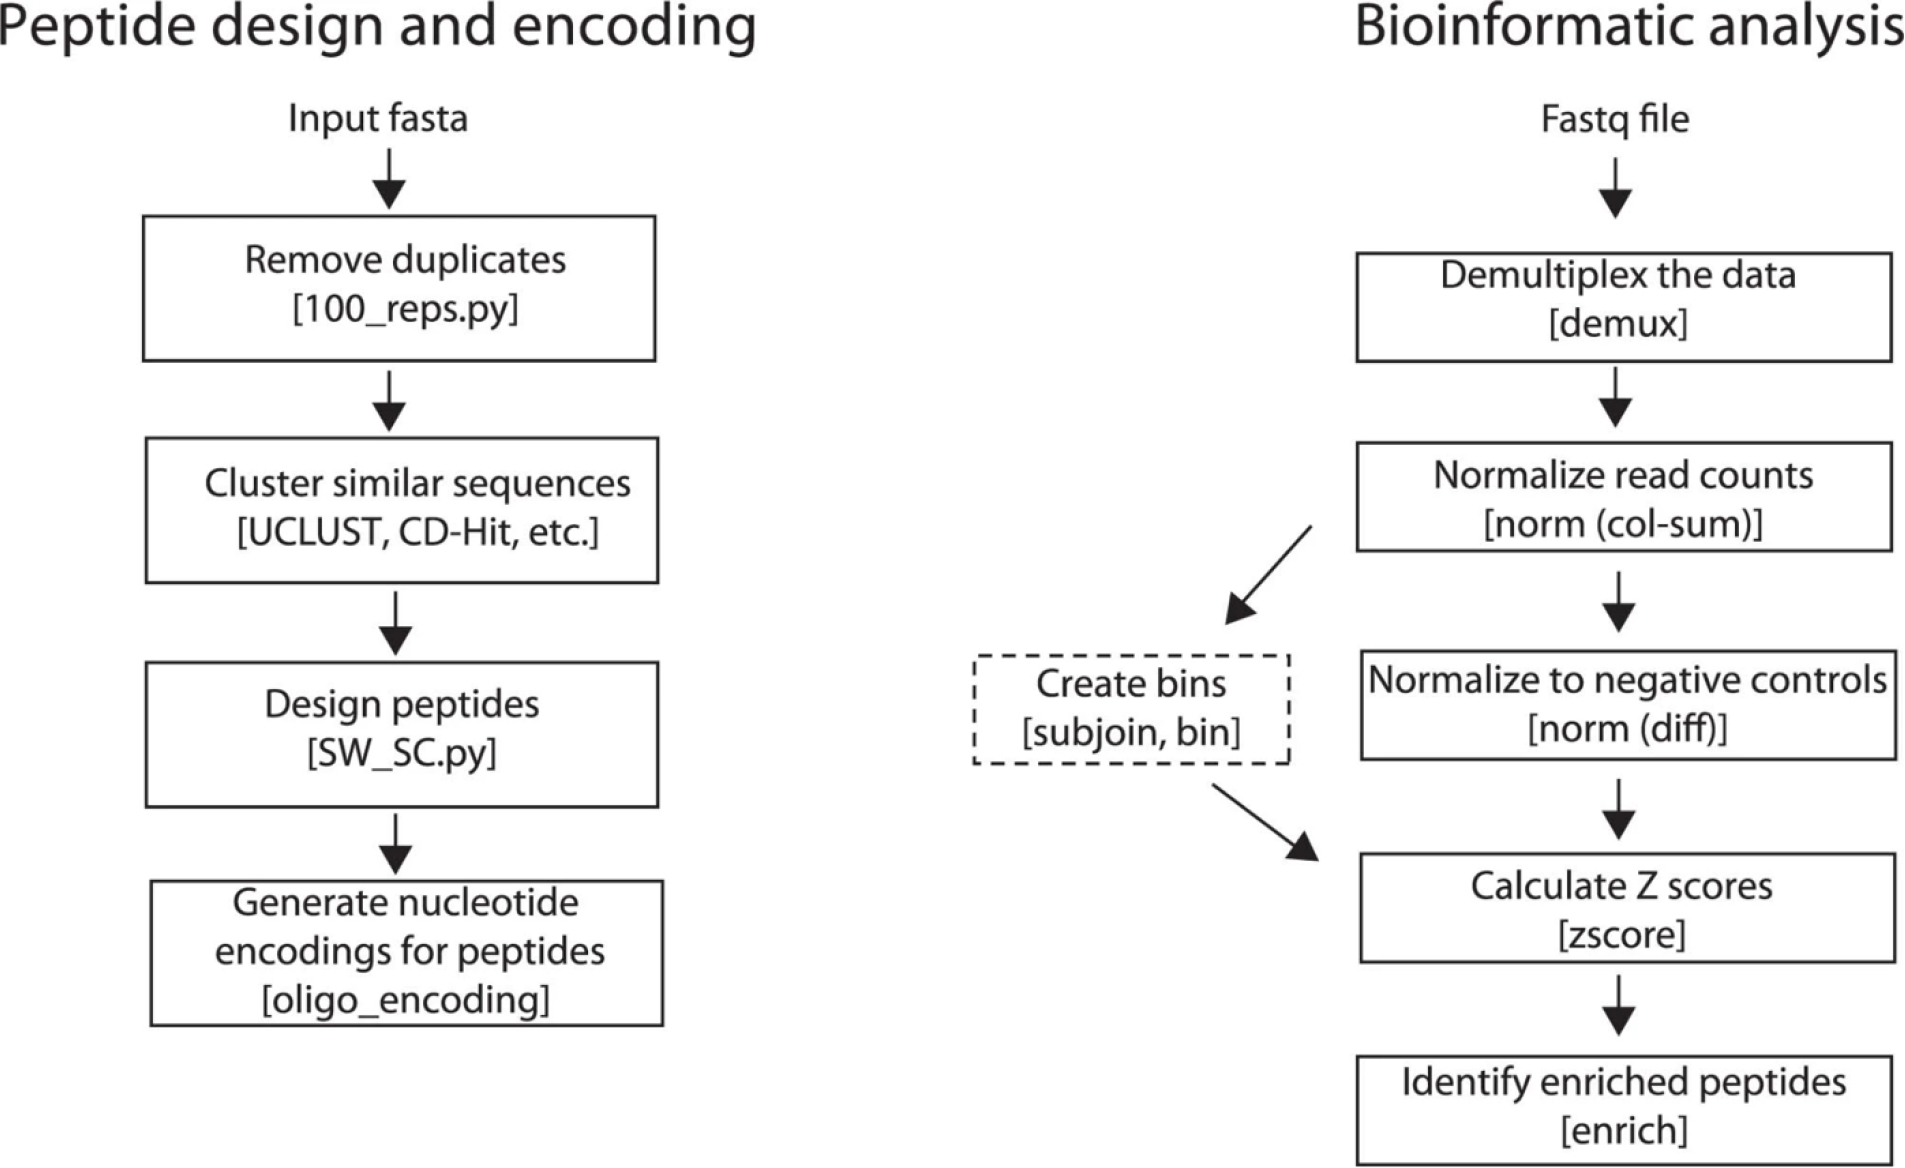
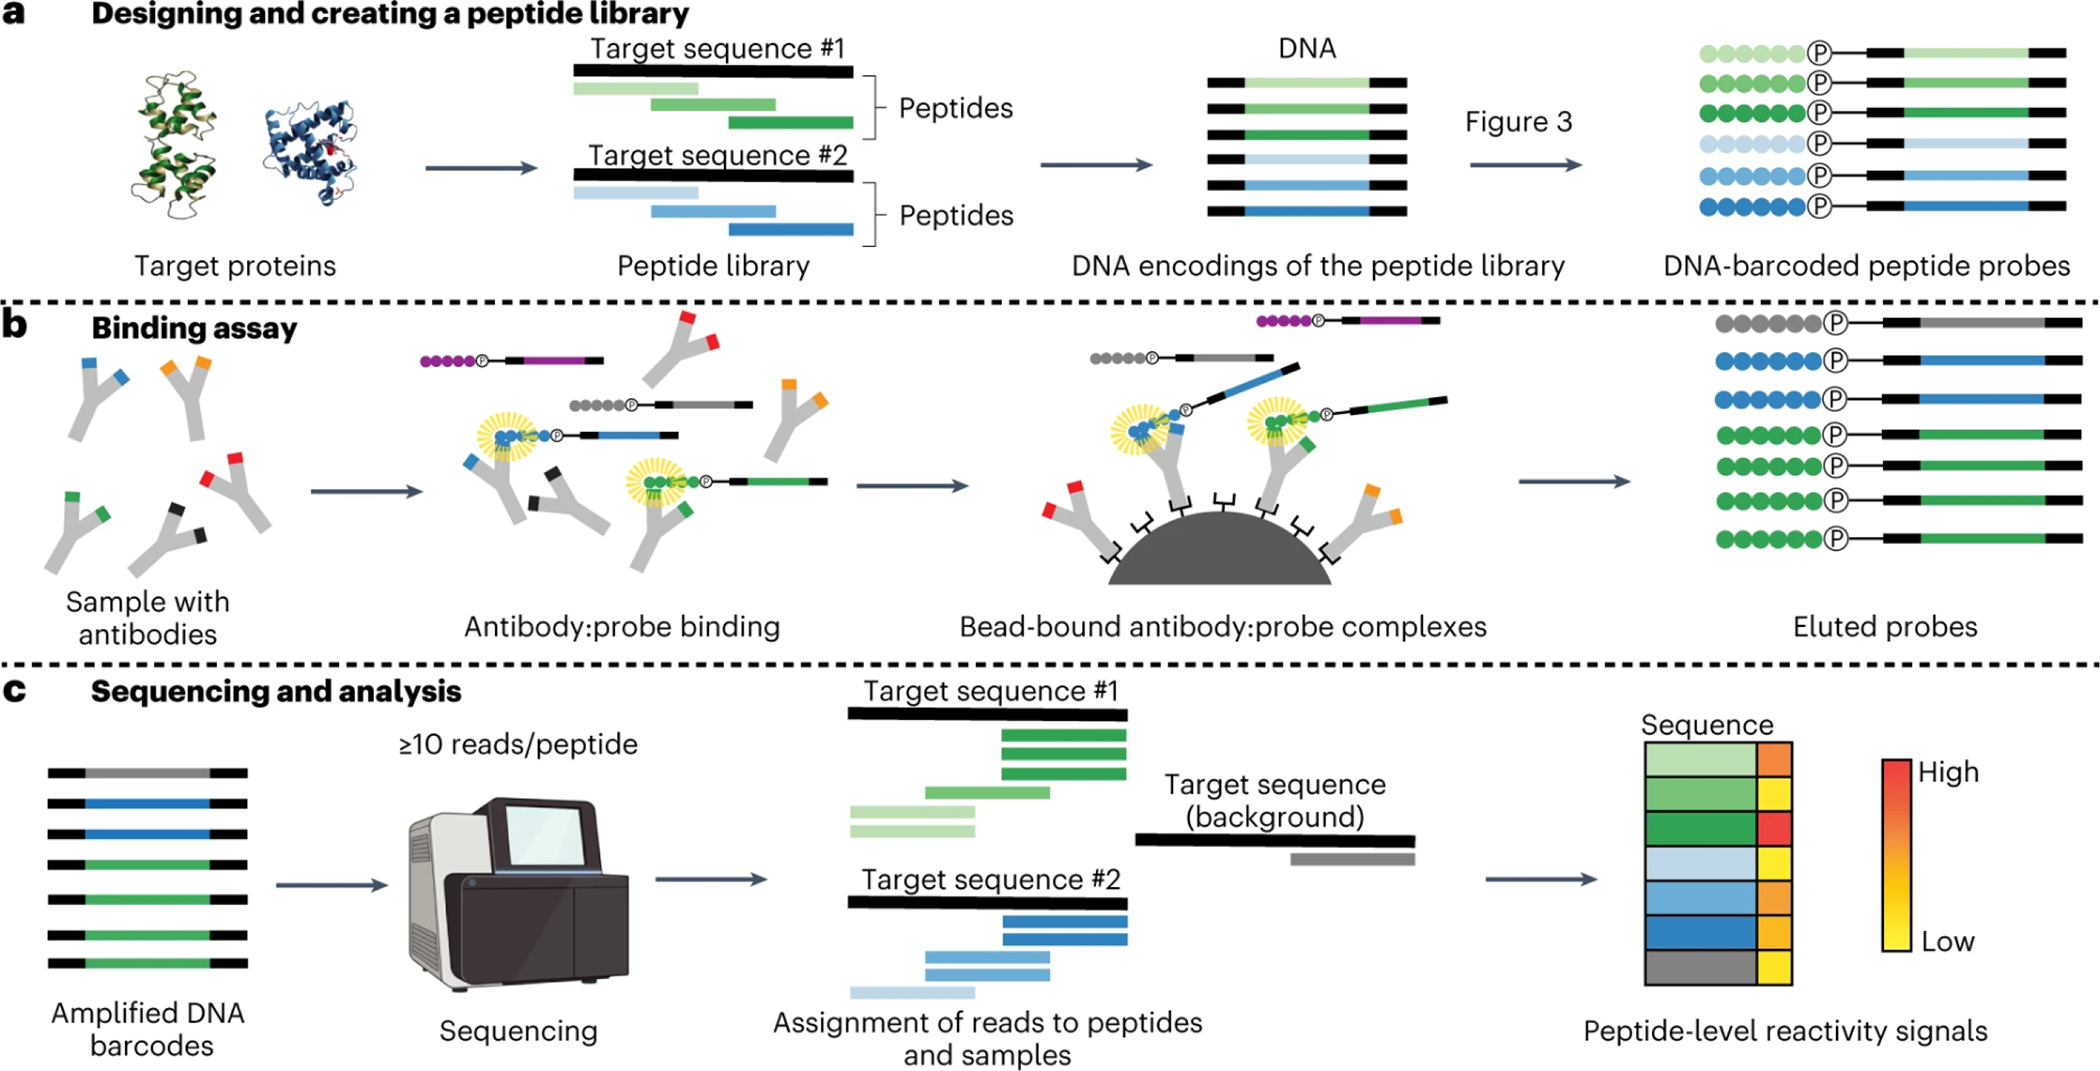
PepSeq is an in vitro platform for building and conducting highly multiplexed proteomic assays against customizable targets by using DNA-barcoded peptides. Starting with a pool of DNA oligonucleotides encoding peptides of interest, this protocol outlines a fully in vitro and massively parallel procedure for synthesizing the encoded peptides and covalently linking each to a corresponding cDNA tag. The resulting libraries of peptide/DNA conjugates can be used for highly multiplexed assays that leverage high-throughput sequencing to profile the binding or enzymatic specificities of proteins of interest. Here, we describe the implementation of PepSeq for fast and cost-effective epitope-level analysis of antibody reactivity across hundreds of thousands of peptides from <1 µl of serum or plasma input. This protocol includes the design of the DNA oligonucleotide library, synthesis of DNA-barcoded peptide constructs, binding of constructs to sample, preparation for sequencing and data analysis. Implemented in this way, PepSeq can be used for a number of applications, including fine-scale mapping of antibody epitopes and determining a subject's pathogen exposure history. The protocol is divided into two main sections: (i) design and synthesis of DNA-barcoded peptide libraries and (ii) use of libraries for highly multiplexed serology. Once oligonucleotide templates are in hand, library synthesis takes 1-2 weeks and can provide enough material for hundreds to thousands of assays. Serological assays can be conducted in 96-well plates and generate sequencing data within a further ~4 d. A suite of software tools, including the PepSIRF package, are made available to facilitate the design of PepSeq libraries and analysis of assay data.


Conflict of interest statement

Ethics declarations

Competing interests

The authors declare no competing interests.

Figures

Extended Data Fig. 1
Extended Data Fig. 1. Sequence alignment for a representative PepSeq probe with amplification and sequencing primers.
Top: For DNA amplification, the forward or reverse primers bind to the PepSeq probe via the 19-nt constant regions added to either end of the DNA tag. The forward DNA amplification primer contains a T7 promoter, NEB untranslated region, start codon and TEV cleavage site sequences. The reverse DNA amplification primer contains an S6 tag and a CP1 annealing site. Bottom: For sequencing, the forward indexing primer contains a 12-nt randomer (N) and a 10-nt barcode sequence (B). The reverse indexing primer contains a separate 8-nt barcode (B). Both indexing primers bind to the DNA tags via the 19-nt constant regions. For the reverse primers, we are showing the reverse complement sequences to clearly indicate annealing regions. See Supplementary Table 1 for oligonucleotide sequences to order.
Extended Data Fig. 2
Extended Data Fig. 2. Bioinformatic pipeline for design of the PepSeq library and analysis of sequencing results.
Graphical depiction of a typical analysis workflow through peptide design and encoding (left) and bioinformatic analysis (right). Each box represents a step in the bioinformatic pipeline and includes a basic description of the step, along with a recommended piece of software (left) or PepSIRF module (right) for accomplishing the described step (contained in square brackets). Arrows indicate a direct connection, with the output file from the upstream box being used as an input file for the downstream box. The dashed box indicates a step that needs to be performed the first time running the analysis but is not required to be run for every analysis.
Extended Data Fig. 3
Extended Data Fig. 3. Effect of Illumina sequencing cluster density on PepSeq demultiplexed read yield.
The relationship between flowcell cluster density (x-axis) and the total number of reads successfully demultiplexed to peptides and samples (y-axis) across a series of representative sequencing runs by using mid-output (blue dots) or high-output (red dots) 150-cycle Illumina NextSeq kits. We observe a cluster density between 250 and 325 (green shaded region) to yield the greatest number of usable PepSeq reads per run, which substantially exceeds the cluster density recommended by Illumina (blue shaded region). Cluster densities for high-output kits have been normalized by a factor of 3 to allow accurate comparison with mid-output kits.
Fig. 1:
Fig. 1:. Overview of protocol.
a, Design of a peptide library begins with a set of target protein sequences. An informatic approach (such as the combined sliding-window/set-cover algorithm described in the ‘Design of peptide-encoding oligonucleotides’ section of ‘Experimental design’) is then used to design a library of peptides of a user-defined length that cover the supplied target sequences (green and blue bars). Next, amino acid sequences are informatically converted into DNA encodings, and constant regions (black segments) are added to each end. The corresponding DNA oligonucleotide library is prepared by massively parallel DNA synthesis and converted in bulk to a corresponding library of DNA-barcoded peptides (‘PepSeq probes’) by using in vitro transcription and translation and taking advantage of intramolecular coupling mediated by a tethered puromycin (P)-containing molecule. b, A library of PepSeq probes, prepared as in a, are then incubated with biological samples of interest, allowing antibodies to bind their cognate epitopes (binding indicated by the yellow halos). The antibodies are then captured onto protein-bound beads via their constant regions, unbound PepSeq probes are washed away and bound PepSeq probes are eluted. c, The DNA tags of eluted PepSeq probes are amplified by PCR, and the relative abundance of each probe is quantified by using high-throughput sequencing. Changes in relative abundance provide a semi-quantitative measure of cognate antibody abundance/affinity for each peptide in the design. Created with BioRender.com.
Fig. 2:
Fig. 2:. Impact of the design algorithm and target sequence clustering approach on library design size.
a, Comparison of performance between the sliding window only (SW) and sliding window + set cover (SWSC) design strategies. Performance is measured as the ratio of the number of 30mer peptides required to cover all unique 9mers present in the target set of proteins (points above the horizontal dotted line indicate superior performance of the SWSC algorithm). Orange points represent results from simulated datasets with a fixed number of target protein sequences (3, 10 and 30) and variable average percent identity between targets (13–94%). Blue points represent results from datasets with variable numbers (1–100) of particular viral protein sequences downsampled randomly from the sequences present in UniProt. Across all of the analyzed datasets, the SWSC design strategy more efficiently covered the target protein set when each 9mer occurred in an average of at least ~1.75 target protein sequences. b, Performance of the SWSC algorithm when target protein sequences were clustered by using Uclust at different identity thresholds (50–95%). Each color represents a different target protein dataset (37,022–1,213,326 sequences in each) generated by downloading all available protein sequences from Uniprot for five different viral families (three RNA virus families (purple) and two DNA virus families (green)). The peptide library size at each cluster identity threshold was normalized by dividing by the number of peptides contained in the smallest design for the same set of target proteins. A percent cluster identity of between 65 and 75 resulted in the smallest number of peptides needed to cover all 9mers in the selected datasets. avg, average; Env, large envelope protein; Gag, group-specific antigen protein; HBV, hepatitis B virus; id, identity.
Fig. 3:
Fig. 3:. Synthesis of DNA-barcoded peptide libraries.
Generation of DNA-barcoded peptide (‘PepSeq’) libraries consists of the following 6 steps: 1) overlap extension PCR of a single- or double-stranded DNA library encoding the target peptides to create dsDNA templates for in vitro transcription, by using primers that anneal to flanking constant regions (dsDNA preparation, DDP); 2) in vitro transcription of dsDNA constructs to create mRNA (mRNA preparation, MRP); 3) self-splinting ligation of a puromycin-containing hairpin adapter oligonucleotide to the 3′ end of mRNA molecules (puromycin adapter ligation, PAL); 4) in vitro translation of each mRNA into its encoded peptide, and covalent intramolecular coupling of the C terminus of the translated peptide to the 3′ end of the mRNA via the puromycin molecule (peptide translatio and capture, PTC); 5) reverse transcription of the mRNA into cDNA, primed from the hairpin region of the adapter, followed by RNase digestion of the RNA strand, leaving the synthesized peptide attached to the cDNA construct (RNA to DNA conversion, RDC); and 6) tobacco etch virus (TEV) protease cleavage to remove constant-region amino acids from the N-terminal end of the peptide.
Fig. 4:
Fig. 4:. Analysis of the role of sequencing read depth in the accurate identification of enriched peptides.
a, Comparison of the ‘true positive’ rate at different sequencing depths (reads per peptide) with three different library sizes (244,000 (blue), 15,000 (red) and 2,500 (green) peptides). Three samples from each of the three libraries with >30 reads per peptide were randomly downsampled to the indicated number of reads per peptide, and the true positive rate was calculated as the proportion of the enriched peptides (Z score ≥ 10) from the largest dataset (30 reads per peptide, the ‘truth set’) that were also found to be enriched in the downsampled dataset. At ~10 reads per peptide, the true positive rate plateaus, and >90% of all ‘true’ enriched peptides are successfully identified in all three libraries. b, Comparison of the proportion of the total enriched peptides that are ‘false positives’ at different sequencing depths (reads per peptide) and using the same datasets described in a. False positives are peptides found to be enriched in the downsampled dataset but not in the largest truth set. Even with as few as three reads per peptide, we see a low proportion of false positives, and this proportion does not change much with an increase in sequencing depth. K, thousand.
Fig. 5:
Fig. 5:. Visualization of enriched peptides across a range of z score thresholds.
Density scatterplot comparing normalized read counts for each peptide from buffer-only negative control samples (x-axis) and a representative serum sample (y-axis) assayed with a PepSeq library containing 15,000 peptides. Colored dots indicate peptides enriched at the indicated Z score thresholds. This plot was created with Qiime2 by using the plug-in found at https://github.com/LadnerLab/q2-ps-plot.
Fig. 6:
Fig. 6:. Gel images showing expected products from Stage II of the protocol.
Abbreviations are as in Fig. 3. a, An example final gel image including the products of the MRP, PAL, PTC and TEV reactions from the production of a 30-aa library. The MRP product appears as a single band of mRNA. The PAL reaction material appears as two bands, an upper band for the adapter-ligated mRNA (mRNA+PuroAdapter) and a lower band of unligated mRNA (MRP product). The PTC reaction material runs as three dominant bands: the upper band is the adapter-ligated mRNA with the translated peptide attached (mRNA+PuroAdapter+Peptide), the middle band is the adapter-ligated mRNA (with no peptide) and the lower band is unligated mRNA. As a result of RNase treatment, the unligated mRNA product is not observed after the TEV reaction, but the puromycin-ligated cDNA and puromycin-ligated cDNA bound to peptide are both present. The faint band seen between the mRNA and mRNA+PuroAdapter in the PTC and below the cDNA+PuroAdapter band in the TEV lanes is a byproduct formed during in vitro translation. This is a 6% TBU gel run for 45 min in heated 1× TBE buffer. b, An example image of a quality-control gel run during the production of a 30-aa library. The single lower band in the PAL reaction material is the unligated puromycin adapter (PuroAdapter). It is also common to see a band near the bottom of the gel in the PTC lane, which is probably the capture oligo. This is a 10% TBU gel run for 75 min in unheated 1× TBE buffer.

Similar articles

Cited by

References

    1. Vengesai A et al. A systematic and meta-analysis review on the diagnostic accuracy of antibodies in the serological diagnosis of COVID-19. Syst. Rev. 10, 155 (2021). - PMC - PubMed
    1. Pollán M et al. Prevalence of SARS-CoV-2 in Spain (ENE-COVID): a nationwide, population-based seroepidemiological study. Lancet 396, 535–544 (2020). - PMC - PubMed
    1. Lequin RM Enzyme immunoassay (EIA)/enzyme-linked immunosorbent assay (ELISA). Clin. Chem. 51, 2415–2418 (2005). - PubMed
    1. Taylor CT et al. Detection of specific ZIKV IgM in travelers using a multiplexed flavivirus microsphere immunoassay. Viruses 10, 253 (2018). - PMC - PubMed
    1. Graham H, Chandler DJ & Dunbar SA The genesis and evolution of bead-based multiplexing. Methods 158, 2–11 (2019). - PubMed

Publication types