

Crystal growth in confinement
- PMID: 36385223
- PMCID: PMC9669051
- DOI: 10.1038/s41467-022-34330-5
Crystal growth in confinement
Abstract
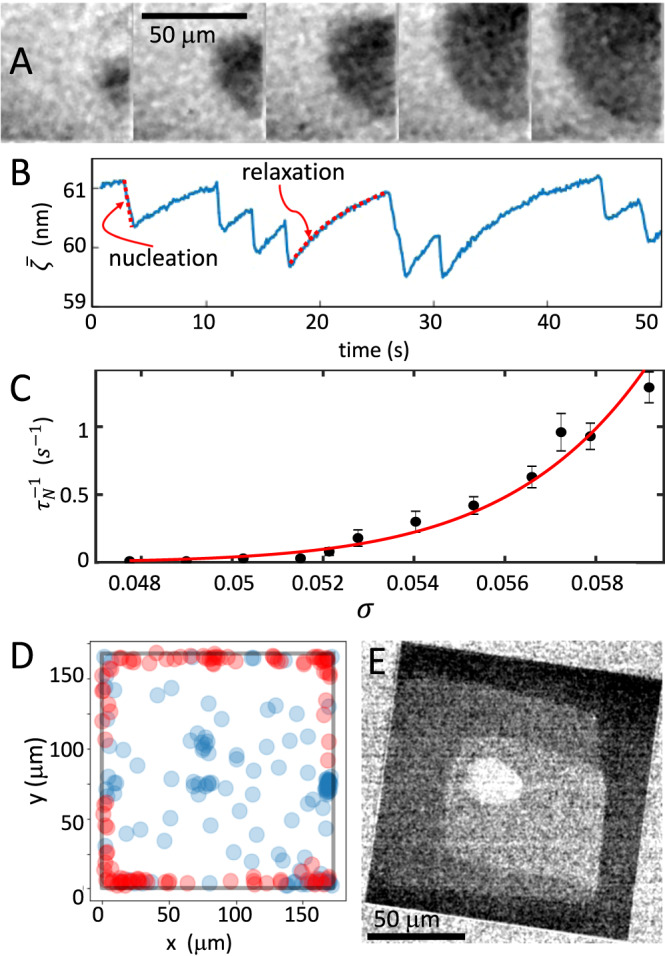
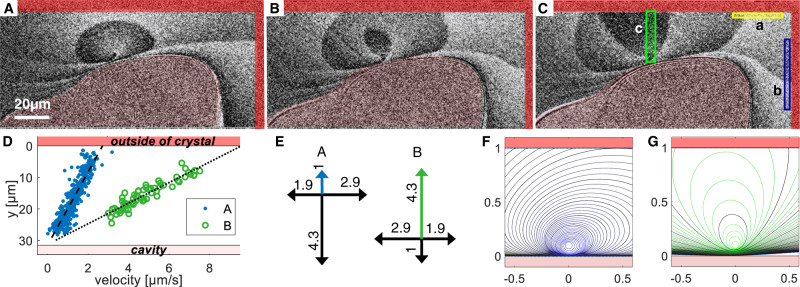
The growth of crystals confined in porous or cellular materials is ubiquitous in Nature and forms the basis of many industrial processes. Confinement affects the formation of biominerals in living organisms, of minerals in the Earth's crust and of salt crystals damaging porous limestone monuments, and is also used to control the growth of artificial crystals. However, the mechanisms by which confinement alters crystal shapes and growth rates are still not elucidated. Based on novel in situ optical observations of (001) surfaces of NaClO3 and CaCO3 crystals at nanometric distances from a glass substrate, we demonstrate that new molecular layers can nucleate homogeneously and propagate without interruption even when in contact with other solids, raising the macroscopic crystal above them. Confined growth is governed by the peculiar dynamics of these molecular layers controlled by the two-dimensional transport of mass through the liquid film from the edges to the center of the contact, with distinctive features such as skewed dislocation spirals, kinetic localization of nucleation in the vicinity of the contact edge, and directed instabilities. Confined growth morphologies can be predicted from the values of three main dimensionless parameters.
© 2022. The Author(s).
Conflict of interest statement
The authors declare no competing interests.
Figures


Similar articles
-
Heterogeneous Nucleation and Growth of Nanoparticles at Environmental Interfaces.Acc Chem Res. 2016 Sep 20;49(9):1681-90. doi: 10.1021/acs.accounts.6b00208. Epub 2016 Aug 11. Acc Chem Res. 2016. PMID: 27513685 Review.
-
The influence of surface active molecules on the crystallization of biominerals in solution.Adv Colloid Interface Sci. 2006 Dec 21;128-130:135-58. doi: 10.1016/j.cis.2006.11.022. Epub 2007 Jan 23. Adv Colloid Interface Sci. 2006. PMID: 17254533 Review.
-
A kinetic model of the transformation of a micropatterned amorphous precursor into a porous single crystal.Acta Biomater. 2010 Mar;6(3):1001-5. doi: 10.1016/j.actbio.2009.09.002. Epub 2009 Sep 6. Acta Biomater. 2010. PMID: 19735744
-
An artificial biomineral formed by incorporation of copolymer micelles in calcite crystals.Nat Mater. 2011 Sep 4;10(11):890-6. doi: 10.1038/nmat3103. Nat Mater. 2011. PMID: 21892179
-
Nonclassical crystallization in vivo et in vitro (II): Nanogranular features in biomimetic minerals disclose a general colloid-mediated crystal growth mechanism.J Struct Biol. 2016 Nov;196(2):260-287. doi: 10.1016/j.jsb.2016.09.005. Epub 2016 Sep 9. J Struct Biol. 2016. PMID: 27620641 Review.
Cited by
-
Reconstructing Waddington Landscape from Cell Migration and Proliferation.Interdiscip Sci. 2025 Sep;17(3):541-554. doi: 10.1007/s12539-024-00686-z. Epub 2025 Jan 7. Interdiscip Sci. 2025. PMID: 39775538
-
Exploring the Role of Miniemulsion Nanodroplet Confinement on the Crystallization of MoO3: Morphology Control and Insight on Crystal Formation by In Situ Time-Resolved SAXS/WAXS.Nanomaterials (Basel). 2023 Mar 14;13(6):1046. doi: 10.3390/nano13061046. Nanomaterials (Basel). 2023. PMID: 36985940 Free PMC article.
References
-
- Mann, S. Biomineralization (Oxford University Press, 2001).
-
- Aizenberg J. New nanofabrication strategies: inspired by biomineralization. MRS Bull. 2010;35:323–330. doi: 10.1557/mrs2010.555. - DOI
Publication types
MeSH terms
Substances
LinkOut - more resources
Full Text Sources
Medical
