. 2022 Nov 17;13(1):7017.
doi: 10.1038/s41467-022-34813-5.

Open-channel structure of a pentameric ligand-gated ion channel reveals a mechanism of leaflet-specific phospholipid modulation

Affiliations

Open-channel structure of a pentameric ligand-gated ion channel reveals a mechanism of leaflet-specific phospholipid modulation

John T Petroff 2nd et al. Nat Commun. .

Abstract

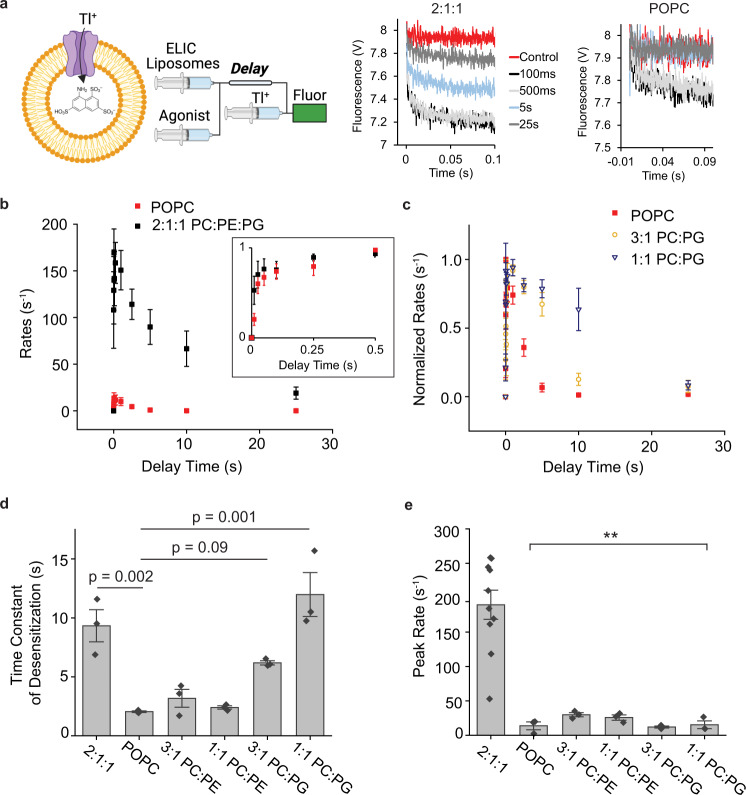
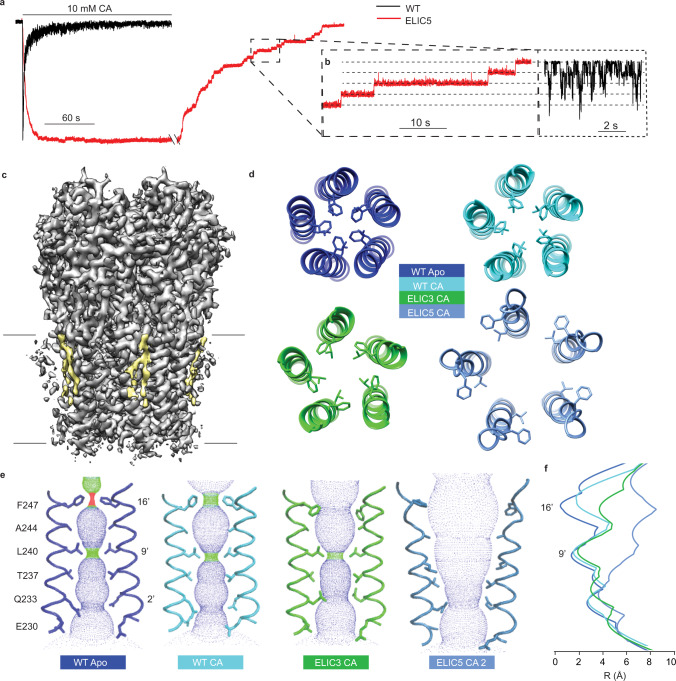
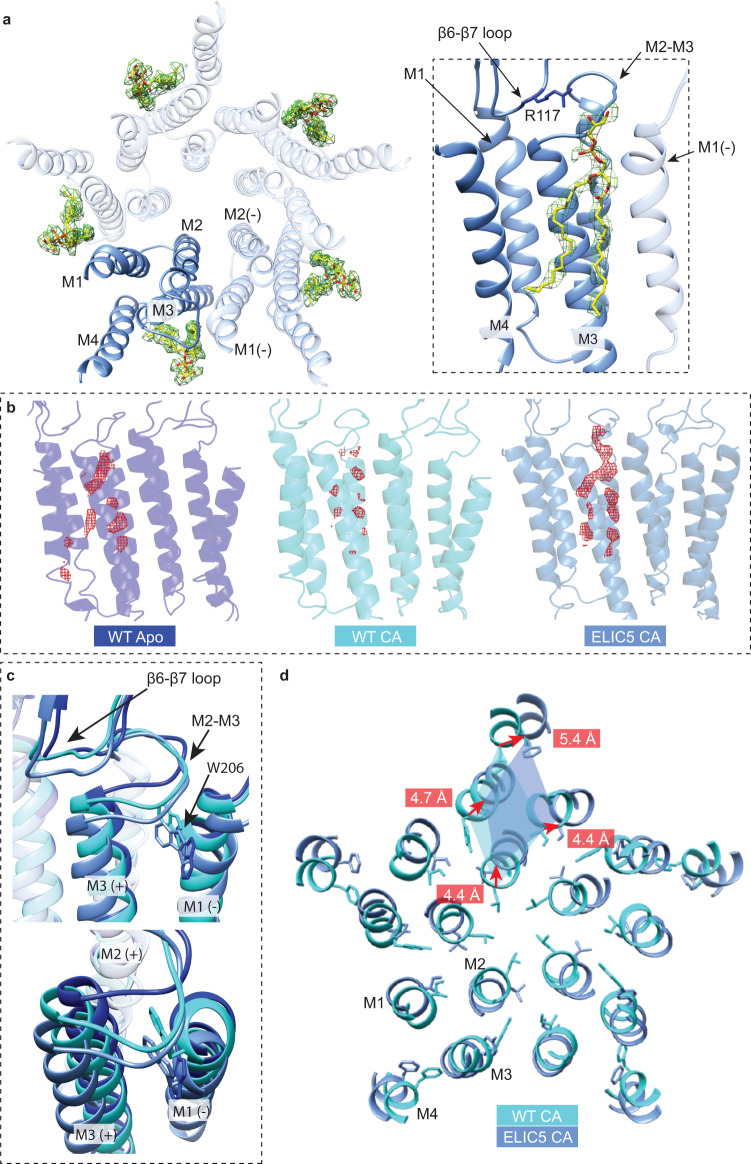
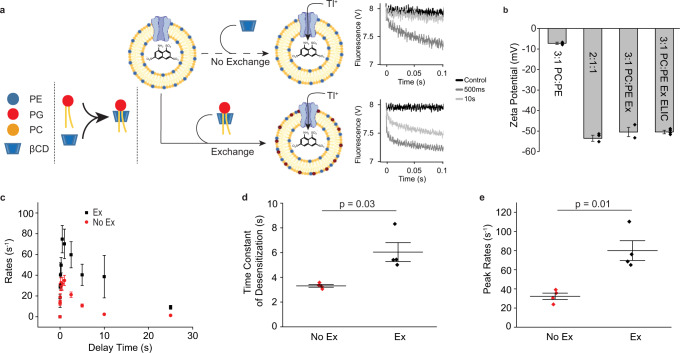
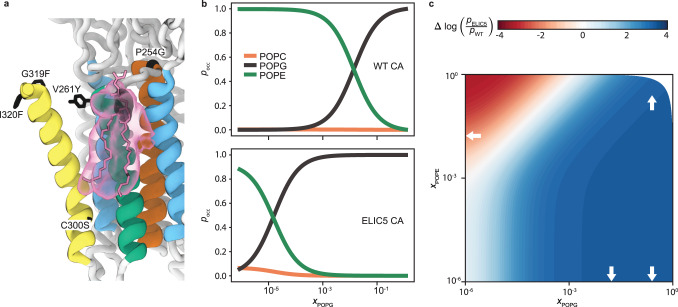
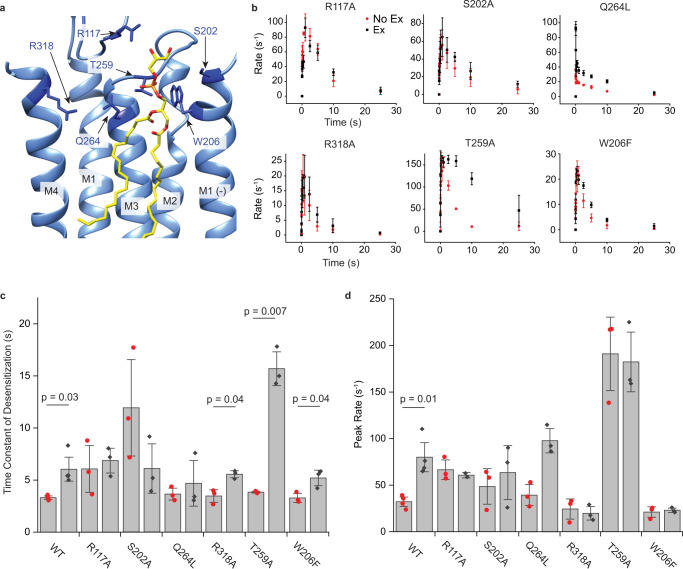
Pentameric ligand-gated ion channels (pLGICs) mediate synaptic transmission and are sensitive to their lipid environment. The mechanism of phospholipid modulation of any pLGIC is not well understood. We demonstrate that the model pLGIC, ELIC (Erwinia ligand-gated ion channel), is positively modulated by the anionic phospholipid, phosphatidylglycerol, from the outer leaflet of the membrane. To explore the mechanism of phosphatidylglycerol modulation, we determine a structure of ELIC in an open-channel conformation. The structure shows a bound phospholipid in an outer leaflet site, and structural changes in the phospholipid binding site unique to the open-channel. In combination with streamlined alchemical free energy perturbation calculations and functional measurements in asymmetric liposomes, the data support a mechanism by which an anionic phospholipid stabilizes the activated, open-channel state of a pLGIC by specific, state-dependent binding to this site.


Conflict of interest statement

The authors declare no competing interests.

Figures

Fig. 1
Fig. 1. ELIC agonist responses in different lipid conditions.
a Left: Schematic of the sequential mixing experiment for the fluorescence liposomal stopped-flow assay (created with BioRender.com). ELIC proteoliposomes containing the fluorescent Tl+ indicator, ANTS, are mixed with agonist (propylamine), and then with Tl+ solution after a variable delay time. Right: Representative raw fluorescence traces; the first 0.1 s are fit with a stretched exponential to determine the fluorescence quenching rate, which relates to ELIC channel activity. The legend shows control (no agonist) and different delay times. b Tl+ flux rates of WT ELIC in 2:1:1 POPC:POPE:POPG (black) and POPC (red) liposomes as a function of time after mixing with 10 mM propylamine (n = 3). Inset shows activation time course of normalized data. Activation was too fast to accurately determine the rate. c Normalized Tl+ flux rates of WT ELIC in POPC, 3:1 POPC:POPG and 1:1 POPC:POPG as a function of time after mixing with 10 mM propylamine (n = 3). d Weighted time constant for the time course of desensitization in response to 10 mM propylamine from the Tl+ flux assay for the indicated liposome compositions (n = 3). 2:1:1 indicates 2:1:1 POPC:POPE:POPG. e Same as c showing peak channel activity (rate) in response to 10 mM propylamine from the Tl+ flux assay (2:1:1, n = 12; other, n = 3). Statistical analysis was performed using a one-way ANOVA and post-hoc Tukey test. ** indicates p < 0.01 when comparing 2:1:1 with all other liposome compositions. P-values for these comparisons with 2:1:1 are 0.003 for POPC, 0.006 for 3:1 PC:PE, 0.005 for 1:1 PC:PE, 0.002 for 3:1 PC:PG and 0.003 for 1:1 PC:PG. Data are shown as mean ± se for (n) independent experiments. Source data are provided as a source data file.
Fig. 2
Fig. 2. Conformational changes of pore opening.
a Representative ELIC currents in response to 10 mM cysteamine of excised patches from 2:1:1 POPC:POPE:POPG giant liposomes (black = WT, red = ELIC5, −60 mV holding voltage). The ELIC5 currents show sustained response to 10 mM cysteamine, followed by slow deactivation with the removal of cysteamine. b Inset that shows ELIC5 (red) single channel currents taken from the deactivation trace (i.e., channel closure) or WT (black) single channel currents in the presence of 10 mM cysteamine. c Cryo-EM density map of ELIC5 in 2:1:1 POPC:POPE:POPG nanodiscs + 10 mM cysteamine (grey) with outer leaflet lipid density (yellow) and black lines approximating the bilayer. d View of the pore lining M2 helix from the extracellular side showing 16’ (F247) and 9′ (L240) side chains from WT apo, WT CA (WT + 10 mM cysteamine), ELIC3 CA (ELIC3 + 10 mM cysteamine), and ELIC5 CA (ELIC5 + 10 mM cysteamine). All are structures in 2:1:1 POPC:POPE:POPG nanodiscs. e Ion permeation pathway as determined by HOLE of the same structures shown in d. The ELIC5 CA structure shows rotamer 2 for Q233 (see Supplementary Fig. 8 for a comparison of rotamers 1 and 2). Labeled are 16′, 9′, and 2′ side chains which form the narrowest portions of the pore in different structures. f Pore radius as a function of distance along the pore axis for the same structures as d and e.
Fig. 3
Fig. 3. Outer leaflet phospholipid binding site and conformational changes associated with ELIC opening.
a Left: Structure of ELIC5 TMD viewed from extracellular side showing bound POPG (yellow) in the density map (green). Right: Side view of ELIC5 phospholipid binding site showing POPG (yellow) in the density map (green). The R117 side chain is shown. b Phospholipid density (red) displayed at σ-level of 3.0 from cryo-EM density maps of WT apo, WT CA, and ELIC5 CA. c Top: Conformational changes in the β6-β7 loop and the M2-M3 linker in WT apo, WT CA and ELIC5 CA. Shown is the W206 side chain for each structure. Bottom: Top down view of the conformational changes of the M2-M3 linker and W206 of WT apo, WT CA and ELIC5 CA. d View of the TMD helices from the extracellular side at the level of 9’ comparing WT CA and ELIC5 CA. Distances between C-α carbons of each structure are shown in red for each transmembrane helix. Images are from a global superposition of structures.
Fig. 4
Fig. 4. Asymmetric liposome stopped-flow Tl+ flux assay.
a Schematic representation of asymmetric liposome stopped-flow Tl+ flux assay (created with BioRender.com). Starting with 3:1 POPC:POPE liposomes reconstituted with ELIC, the sample was either treated with mβCD (top, “No Exchange”), or treated with mβCD/POPG to introduce 25 mole% POPG to the outer leaflet (bottom, “Exchange”). Right: Representative fluorescence quenching traces for no exchange (top) and exchange (bottom) samples showing control (no agonist) and responses to 10 mM propylamine with 500 ms and 10 s delay times. b Zeta potential measurements of symmetric 3:1 POPC:POPE liposomes (3:1 PC:PE) (n = 3), symmetric 2:1:1 POPC:POPE:POPG liposomes (2:1:1) (n = 3), asymmetric 3:1 POPC:POPE liposomes treated to introduce 25 mol% POPG to the outer leaflet (3:1 PC:PE Ex) (n = 2), and asymmetric 3:1 POPC:POPE proteoliposomes with ELIC treated to introduce 25 mol% POPG to the outer leaflet (3:1 PC:PE Ex ELIC) (n = 4). c Tl+ flux rates of WT ELIC in 3:1 PC:PE no exchange liposomes (red, “No Ex”) and exchanged asymmetric liposomes where 25 mol% POPG is introduced to the outer leaflet (black, “Ex”) (n = 4). Channel activation was elicited by 10 mM propylamine. d Weighted time constant of desensitization in the presence of 10 mM propylamine from Tl+ flux assay comparing no exchange and exchange conditions (n = 4). Statistical analysis was performed using a paired, two-sided T-test. e Peak rate of Tl+ flux in response to 10 mM propylamine in no exchange and exchange conditions (n = 4). Statistical analysis was performed using a paired, two-sided T-test. All data are shown as mean ± s.e. for (n) independent experiments. Source data are provided as a source data file.
Fig. 5
Fig. 5. Predicted lipid occupancy for the outer leaflet phospholipid binding site.
a ELIC5 CA structure showing lipid density from a brief 20 ns equilibrium MD simulation to estimate expected thermal fluctuations of the glycerol backbone around the structurally-modeled POPG (pink licorice). The region of glycerol backbone density is shown in black, while the remaining lipid density is shown in pink. The five mutations of ELIC5 are shown in black licorice. b The SAFEP-calculated probability (pocc) that the structurally-identified site will be occupied by each of three possible lipids in a 2POPC:1POPE:xPOPG mixture, for both the WT CA conformation (top) and the ELIC5 CA conformation (bottom). c The predicted relative conformational stability ΔlogpELIC5pWT as a function of mole fraction of POPG and POPE in a POPG:POPE:POPC mixture. Red and blue correspond to greater stability of the WT CA and ELIC5 CA conformations, respectively. White arrows indicate compositions where bulk calculations were carried out; remaining values were extrapolated as described in Methods. Data in panels b and c represent over 3 μs of simulation; pharmacological models relied on SAFEP-calculated parameters as described in Methods.
Fig. 6
Fig. 6. Mutational analysis of the outer leaflet phospholipid binding site.
a ELIC5 CA structure showing POPG (yellow) at the outer leaflet site and residues (dark blue) targeted by mutagenesis. b Tl+ flux rates of mutants in response to 10 mM propylamine for no-exchange (red) and exchange (black, 25 mol% POPG in the outer leaflet) conditions (n = 3). Source data are provided as a source data file. c Weighted time constant of desensitization in response to 10 mM propylamine for no-exchange (red) and exchange (black) conditions (n = 4 for WT, n = 3 for all mutants). d Same as c showing peak rates of Tl+ flux in response to 10 mM propylamine for no-exchange (red) and exchange (black) conditions (n = 4 for WT, n = 3 for all mutants). All data are shown as mean ± s.e. for (n) independent experiments. Statistical analysis was performed using a paired, two-sided T-test.

Similar articles

Cited by

References

    1. Corringer P-J, et al. Structure and pharmacology of pentameric receptor channels: from bacteria to brain. Structure. 2012;20:941–956. - PubMed
    1. Wu Z-s, Cheng H, Jiang Y, Melcher K, Xu HE. Ion channels gated by acetylcholine and serotonin: structures, biology, and drug discovery. Acta Pharmacol. Sin. 2015;36:895–907. - PMC - PubMed
    1. Bäckström T, et al. Allopregnanolone and mood disorders. Prog. Neurobiol. 2014;113:88–94. - PubMed
    1. Meltzer-Brody S, et al. Brexanolone injection in post-partum depression: two multicentre, double-blind, randomised, placebo-controlled, phase 3 trials. Lancet. 2018;392:1058–1070. - PubMed
    1. Gunduz-Bruce H, et al. Trial of SAGE-217 in patients with major depressive disorder. N. Engl. J. Med. 2019;381:903–911. - PubMed

Publication types