. 2022 Nov;611(7937):818-826.
doi: 10.1038/s41586-022-05432-3. Epub 2022 Nov 16.

T cells specific for α-myosin drive immunotherapy-related myocarditis

Affiliations

T cells specific for α-myosin drive immunotherapy-related myocarditis

Margaret L Axelrod et al. Nature. 2022 Nov.

Abstract

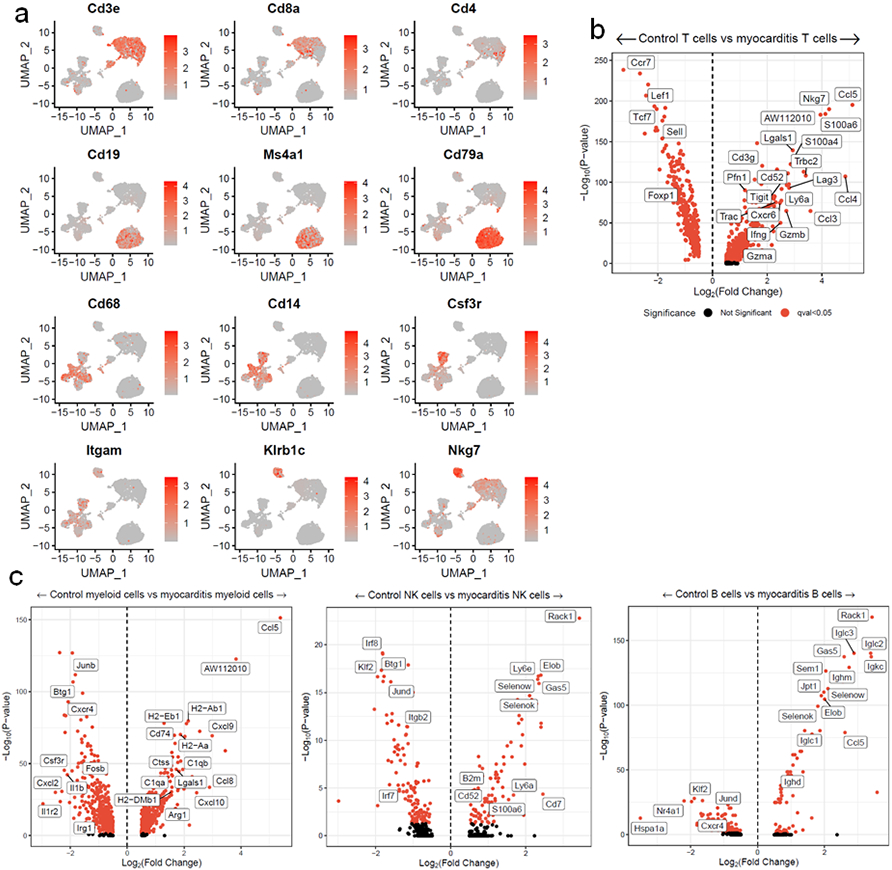
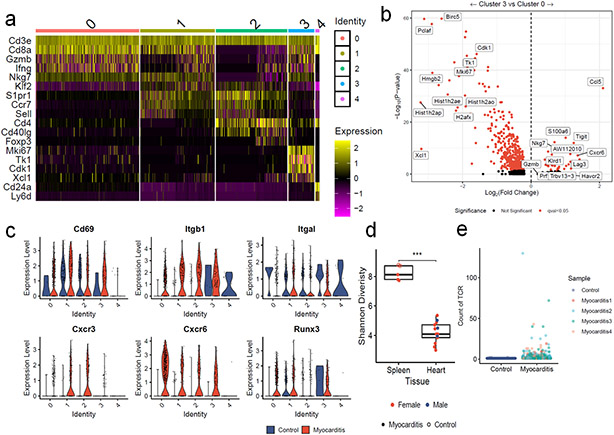
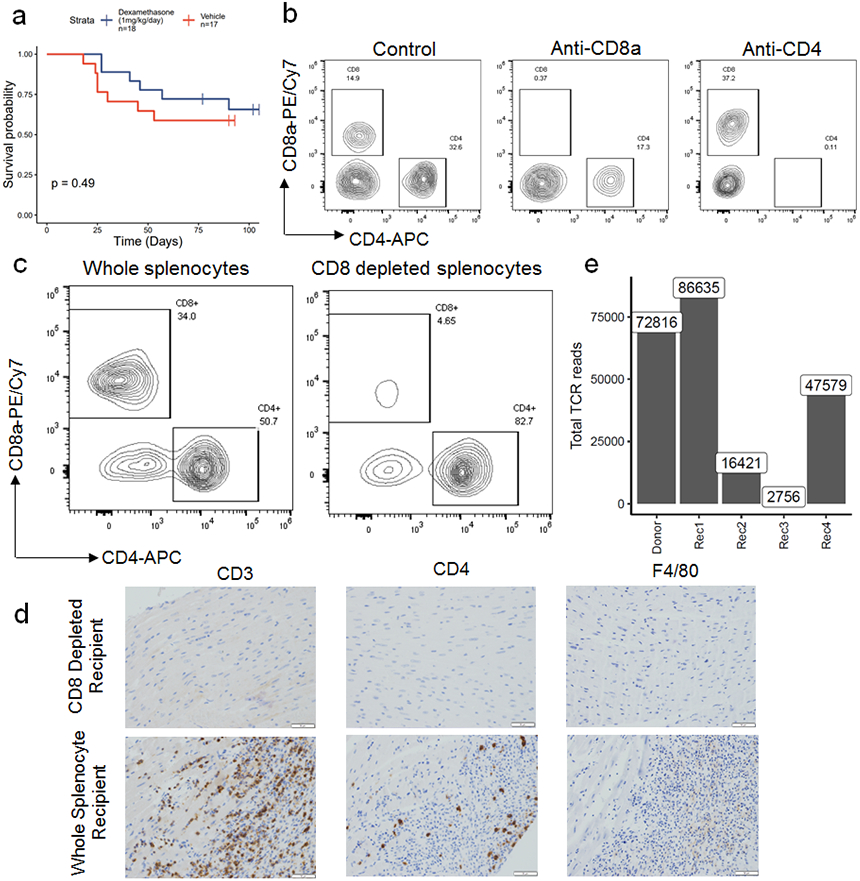
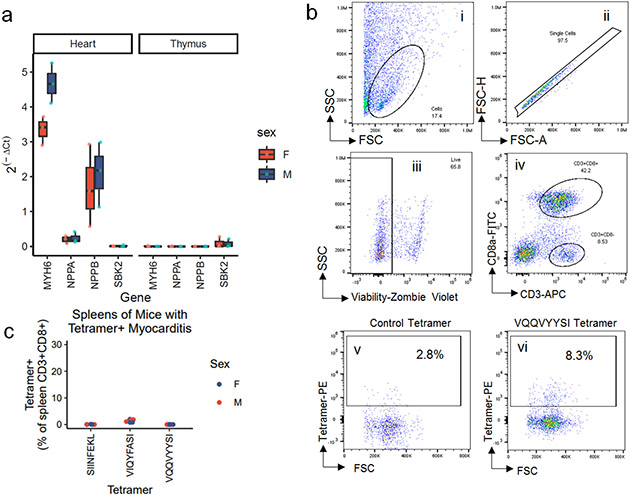
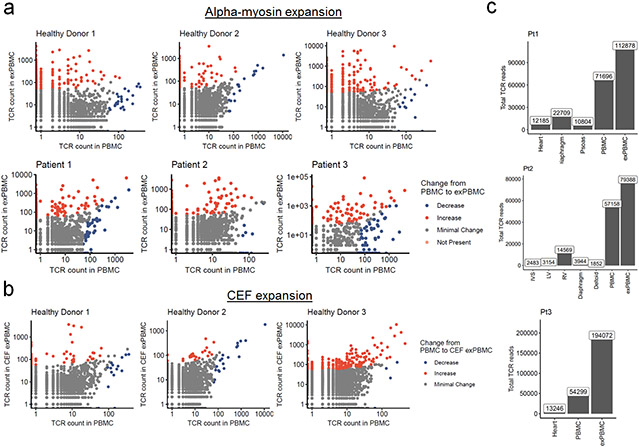
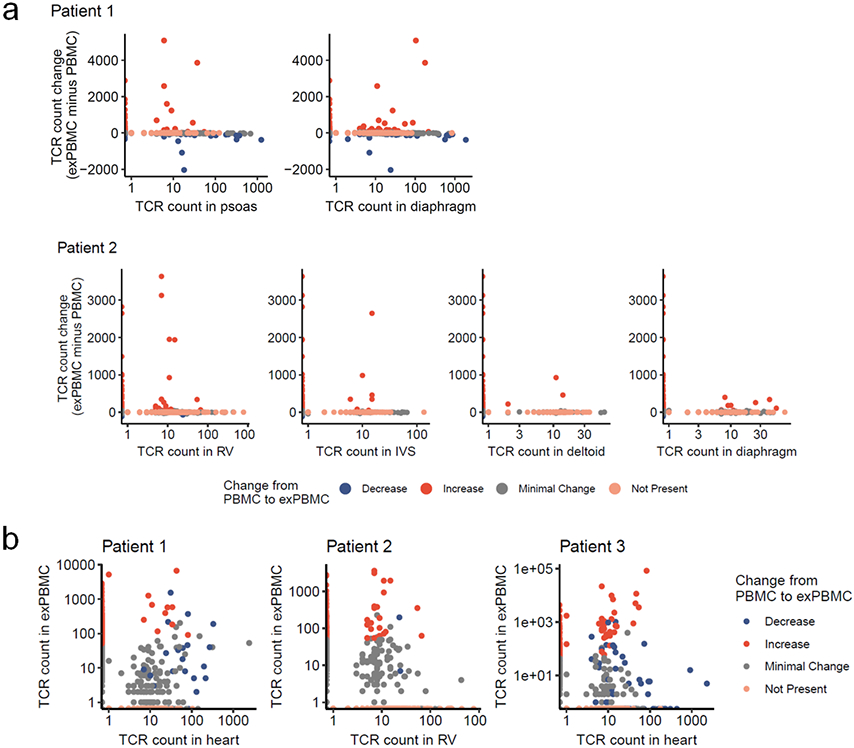
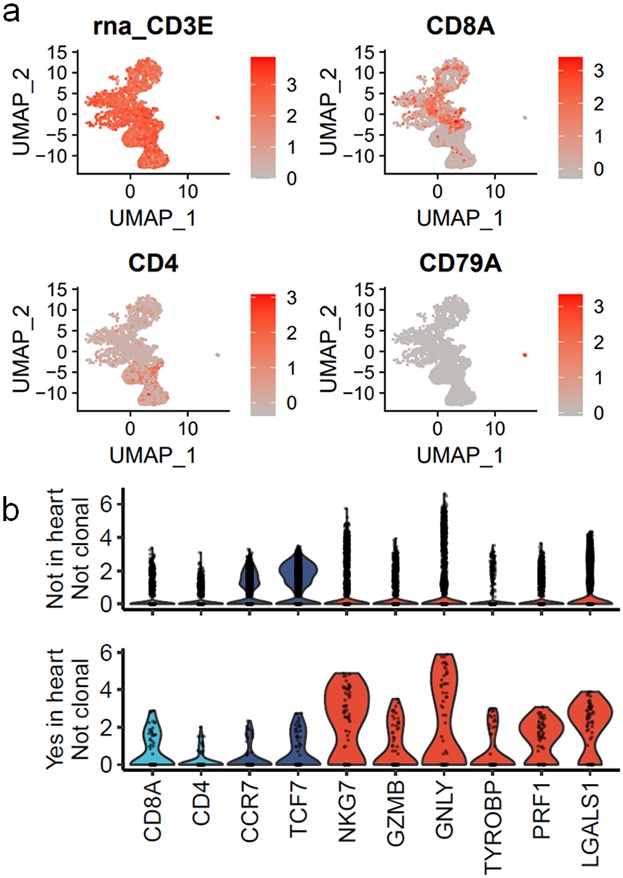
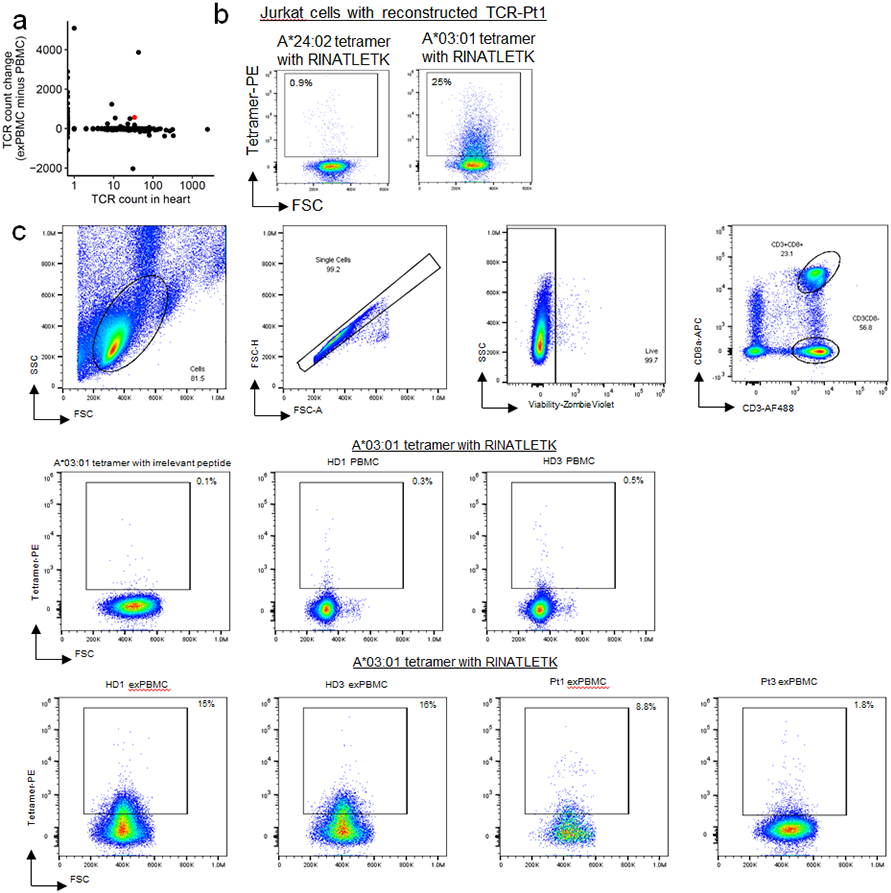
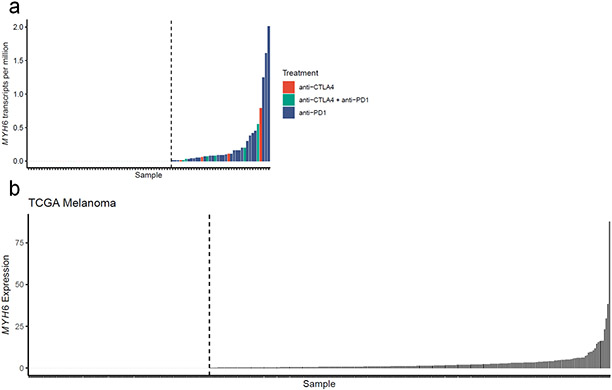
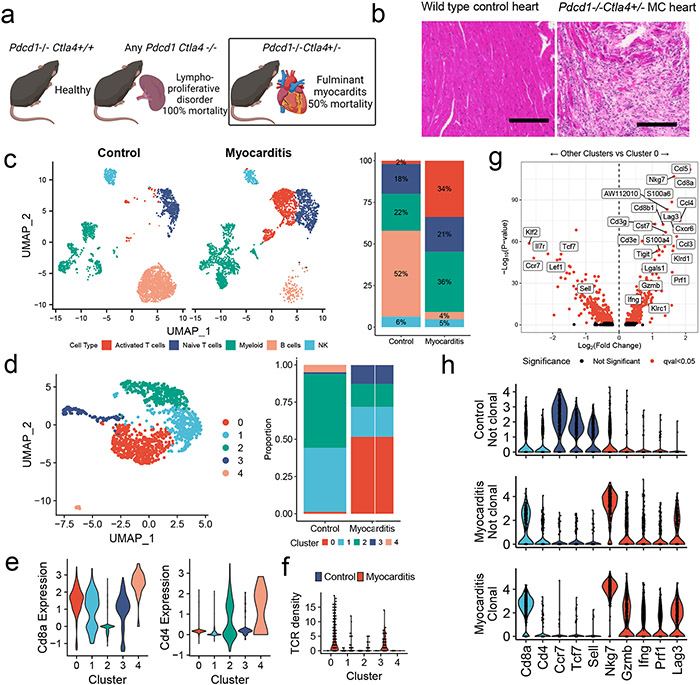
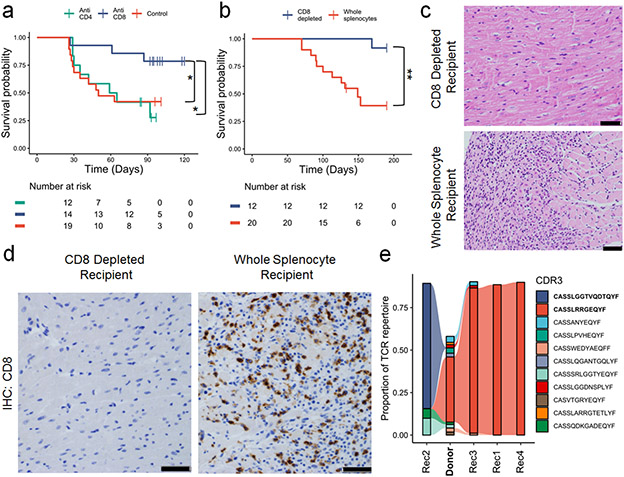
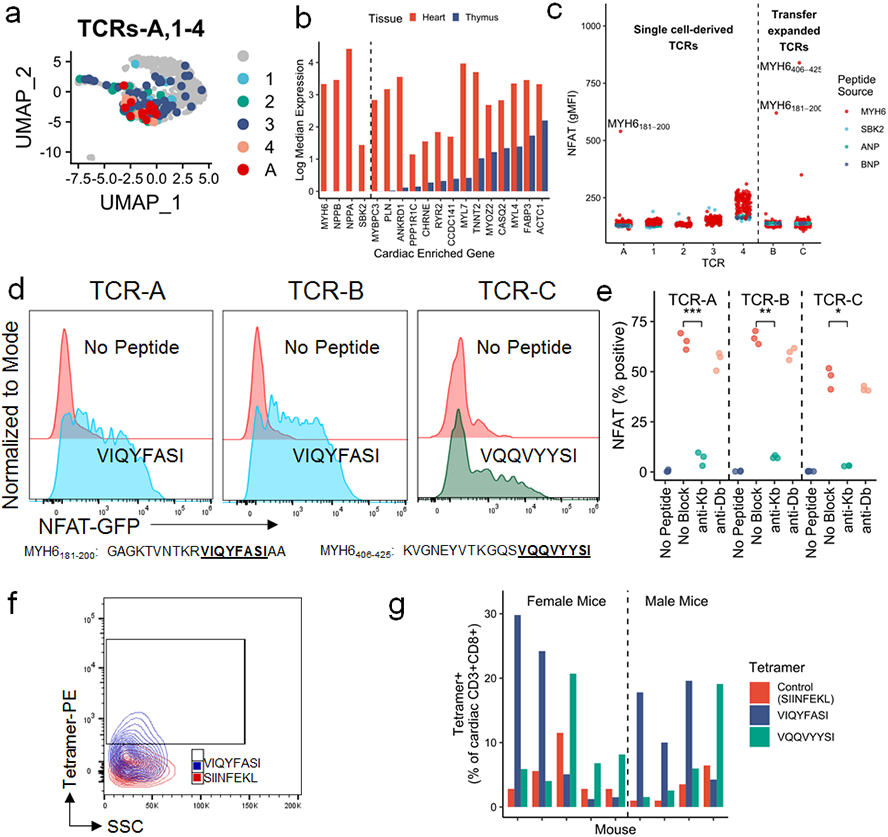
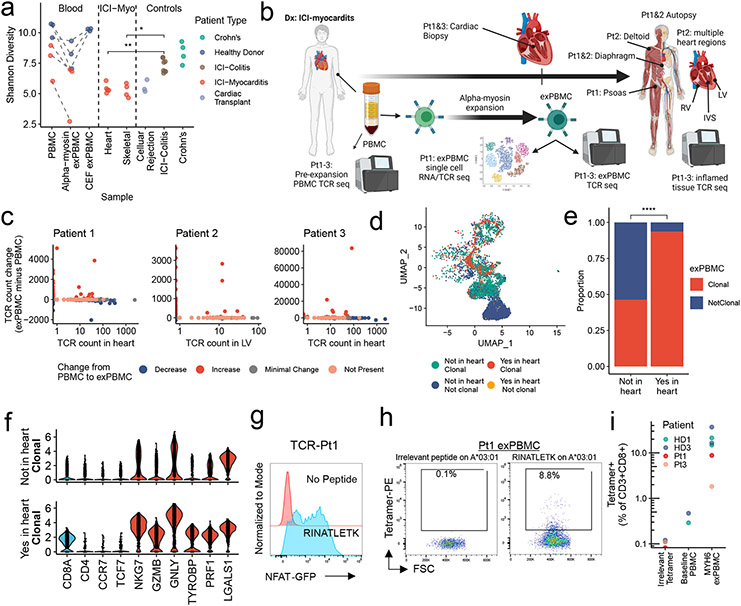
Immune-related adverse events, particularly severe toxicities such as myocarditis, are major challenges to the utility of immune checkpoint inhibitors (ICIs) in anticancer therapy1. The pathogenesis of ICI-associated myocarditis (ICI-MC) is poorly understood. Pdcd1-/-Ctla4+/- mice recapitulate clinicopathological features of ICI-MC, including myocardial T cell infiltration2. Here, using single-cell RNA and T cell receptor (TCR) sequencing of cardiac immune infiltrates from Pdcd1-/-Ctla4+/- mice, we identify clonal effector CD8+ T cells as the dominant cell population. Treatment with anti-CD8-depleting, but not anti-CD4-depleting, antibodies improved the survival of Pdcd1-/-Ctla4+/- mice. Adoptive transfer of immune cells from mice with myocarditis induced fatal myocarditis in recipients, which required CD8+ T cells. The cardiac-specific protein α-myosin, which is absent from the thymus3,4, was identified as the cognate antigen source for three major histocompatibility complex class I-restricted TCRs derived from mice with fulminant myocarditis. Peripheral blood T cells from three patients with ICI-MC were expanded by α-myosin peptides. Moreover, these α-myosin-expanded T cells shared TCR clonotypes with diseased heart and skeletal muscle, which indicates that α-myosin may be a clinically important autoantigen in ICI-MC. These studies underscore the crucial role for cytotoxic CD8+ T cells, identify a candidate autoantigen in ICI-MC and yield new insights into the pathogenesis of ICI toxicity.


Conflict of interest statement

Conflict of Interest Disclosure

M.L. Axelrod is listed as a coinventor on a provisional patent application for methods to predict therapeutic outcomes using blood-based gene expression patterns, that is owned by Vanderbilt University Medical Center, and is currently unlicensed. S.C. Wei is an employee of Spotlight Therapeutics, a consultant for BioEntre, and an inventor on a patent for a genetic mouse model of autoimmune adverse events and immune checkpoint blockade therapy (PCT/US2019/050551) pending to Board of Regents, The University of Texas System. K. Amancherla serves on the Data Safety Monitoring Board for ACI Clinical. J.C. Rathmell is a founder, scientific advisory board member, and stockholder of Sitryx Therapeutics, a scientific advisory board member and stockholder of Caribou Biosciences, a member of the scientific advisory board of Nirogy Therapeutics, has consulted for Merck, Pfizer, and Mitobridge within the past three years, and has received research support from Incyte Corp., Calithera Biosciences, and Tempest Therapeutics. P.B. Ferrell receives research support from Incyte Corporation. D.B.Johnson has served on advisory boards or as a consultant for BMS, Catalyst Biopharma, Iovance, Jansen, Mallinckrodt, Merck, Mosaic ImmunoEngineering, Novartis, Oncosec, Pfizer, and Targovax, has received research funding from BMS and Incyte, and has patents pending for use of MHC-II as a biomarker for immune checkpoint inhibitor response, and abatacept as treatment for immune-related adverse events. J.P. Allison reports personal fees from Achelois, Adaptive Biotechnologies, personal fees from Apricity Health, personal fees from BioAtla, Candel Therapeutics, personal fees from Codiak BioSciences, personal fees from Dragonfly Therapeutics, Earli, Enable Medicine, personal fees from Hummingbird, personal fees from ImaginAb, personal fees from Jounce Therapeutics, personal fees from Lava Therapeutics, personal fees from Lytix Biopharma, personal fees from Marker Therapeutics, PBM Capital, Phenomic AI, personal fees from BioNTech, and personal fees from Polaris Pharma, Time Bioventures, Trained Therapeutics, Two Bear Capital, Venn Biosciences outside the submitted work; in addition, J.P. Allison has a patent for a genetic mouse model of immune checkpoint blockade induced immune-related adverse events pending to The University of Texas MD Anderson Cancer Center; and have received royalties from intellectual property licensed to BMS and Merck. J. Moslehi has served on advisory boards for Bristol Myers Squibb, Takeda, Audentes, Deciphera, Janssen, Immuno-Core, Boston Biomedical, Amgen, Myovant, Kurome Therapeutics, Star Therapeutics, ProtinQure, Pharmacyclics, Pfizer, Mallinckrodt Pharmaceuticals, Silverback Therapeutics, Cytokinetics, and AstraZeneca. J. M. Balko receives research support from Genentech/Roche, and Incyte Corporation, and is an inventor on provisional patents regarding immunotherapy targets and biomarkers in cancer. No disclosures were reported by the other authors.

Figures

Extended Data Figure 1.
Extended Data Figure 1.. Myocardial immune infiltrate does not differ by sex.
a) Quantification of immunohistochemistry (IHC) for CD8 and CD4 in male and female Pdcd1−/−Ctla4+/− mice with MC. Cells are counted as number of positive cells per high power (40x) field (HPF). Each data point represents an average of three high power fields per mouse. n=4 female mice, n=4 male mice. Box plots show the median, first and third quartiles. The whiskers extend to the maxima and minima but no further than 1.5 times the inter-quartile range. b) Representative IHC for IgG and B220 (CD45R) in hearts of mice with MC and positive control staining in spleen. Images are representative of n=8 independent Pdcd1−/−Ctla4+/− mice with MC (n=4 male; n=4 female). Scale bars represent 50μm.
Extended Data Figure 2.
Extended Data Figure 2.. MC is characterized by activated immune cells and clonal T cells.
a) Gene expression of key identity genes, showing cell types of clusters. b) Differential gene expression for T, c) myeloid, B and NK cells in MC compared to control cardiac CD45+ cells. Red indicates FDR-corrected p-value (q-value) <0.05. Black indicates not significant.
Extended Data Figure 3.
Extended Data Figure 3.. T cells in MC are effector or proliferating, tissue-resident and clonal.
a) Expression of key T cell genes by cluster in single cell data. b) Differential gene expression for Cluster 0 vs. Cluster 3 T cells. Red indicates FDR-corrected p-value (q-value) <0.05. Black indicates not significant. c) Violin plots show expression of key tissue residency associated genes by cluster and MC vs. control. d) Shannon diversity on bulk TCR sequencing beta chain repertoires. Color indicates sex. Shape indicates whether the tissue was derived from a control wild type mouse (open circle) or a Pdcd1−/−Ctla4+/− mouse with MC (filled circle). P=0.0002, two-sided Wilcoxon test. Box plots show the median, first and third quartiles. The whiskers extend to the maxima and minima but no further than 1.5 times the inter-quartile range. e) TCR counts in single cell data. MC sample is divided by mouse of origin. Clonal TCRs are found in all 4 sequenced hearts.
Extended Data Figure 4.
Extended Data Figure 4.. Confirmation of cell type depletion.
a) Female Pdcd1−/−Ctla4+/− mice were treated with dexamethasone (1mg/kg/day; n=18) or vehicle (n=17) starting at 21 days of life. Time is measured since birth. P=0.49, two-sided cox proportional hazard test. b) Representative flow cytometry gated on live CD45+ cells isolated from blood of different treatment groups, at week 3 of treatment. c) Representative flow cytometry on CD8 depleted (via magnetic beads) compared to whole splenocytes used for adoptive transfer. d) Representative immunohistochemistry on hearts of a CD8 depleted splenocyte recipient compared to a whole splenocyte recipient. Only cardiac sections are shown. Scale bars show 50μm. Representative of n=10 animals per group. e) Total TCR reads for cardiac TCR beta chain sequencing on donor and recipient hearts.
Extended Data Figure 5.
Extended Data Figure 5.. Thymic expression of Myh6 and flow cytometry gating for murine α-myosin tetramers.
a) Gene expression for Myh6, Nppa, Nppb, and Sbk2 in the heart and thymus of n=3 each male and female Pdcd1−/−Ctla4+/− mice. Gene expression is normalized to beta-actin. Gene expression is plotted as 2^-(Ct gene of interest minus Ct of beta-actin). Box plots show the median, first and third quartiles. The whiskers extend to the maxima and minima but no further than 1.5 times the inter-quartile range. b) Gating strategy for H2-Kb tetramers on murine heart samples. Debris, doublets and dead cells (Zombie Violet positive) are excluded. CD3+CD8+ cells are used for tetramer analysis. Staining for Control (SIINFEKL) H2-Kb, and VQQVYYSI H2-Kb tetramers are shown. c) Quantification of spleen tetramer positive CD3+CD8+ cells, by sex of the mouse. The spleens used in this experiment correspond to the mice show in Fig. 3f, which all have α-myosin tetramer positive MC.
Extended Data Figure 6.
Extended Data Figure 6.. TCR sequencing on exPBMC shows expansion of α-myosin and CEF specific TCRs.
a) Comparison of TCR beta chain abundance in α-myosin exPBMC and pre-expansion PBMC for all patients. Each plot is within the same patient only. Color represents change from PBMC to exPBMC. Minimal change is less than a 50 read count change. b) Comparison of TCR beta chain abundance in CEF exPBMC and pre-expansion PBMC for all healthy donors. Color represents change from PBMC to CEF exPBMC. Minimal change is less than a 50 read count change. c) Total TCR reads for biopsy (heart), autopsy, and PBMC samples from patients 1, 2 and 3.
Extended Data Figure 7.
Extended Data Figure 7.. α-myosin expanded TCRs are found in the hearts and skeletal muscles of patients with ICI-MC.
a) Change in TCR counts from PBMC to α-myosin exPBMC plotted by abundance of the same TCR beta chain in the autologous inflamed cardiac or skeletal muscle tissue of each patient. Minimal change is less than a 50 read count change. Not present means not found in either PBMC or exPBMC, but present in indicated tissue. b) Comparison of TCR beta chain abundance in α-myosin exPBMC and heart (biopsy for patient 1 and 3 or right ventricle for patient 2). Color represents change from PBMC to exPBMC. Minimal change is less than a 50 read count change. Not present means not found in either PBMC or exPBMC, but present in heart.
Extended Data Figure 8.
Extended Data Figure 8.. Purity analysis for single cell sequencing on exPBMCs from patient 1.
a) Gene expression is shown on single cell sequencing of CD3 sorted exPBMCs from patient 1. b) Violin plots of key gene expression by presence or absence in cardiac TCR repertoire and clonality in exPBMC. Identity genes are shown in light blue. Genes associated with naïve T cells are shown in dark blue. Genes associated with T cell activation are shown in red.
Extended Data Figure 9.
Extended Data Figure 9.. TCR from Pt 1 exPBMC recognizes α-myosin epitope.
a) TCR-Pt1, which was cloned and transduced into Jurkat NFAT-GFP reporter cells, is shown in red on the same plot show in Fig 4c. This shows the expansion of this TCR in the exPBMC and abundance in the heart. b) Representative flow cytometry scatter plots are shown for the TCR-pt1 Jurkat cell line is stained with A*24:02 tetramer with RINATLETK or A*03:01 tetramer with RINATLETK. c) Full flow cytometry gating strategy for human PBMC and exPBMC tetramer staining. Debris, doublets and dead cells (Zombie Violet positive) are excluded. CD3+CD8+ cells are used for tetramer analysis. Tetramer staining for all samples is shown.
Extended Data Figure 10.
Extended Data Figure 10.. Tumor-specific MYH6 expression.
a) MYH6 transcripts per million are shown for n=91 pre-treatment RNA-sequencing melanoma samples. Bars are colored by what ICI treatment the patient received. b) MYH6 expression is shown for n=363 melanoma samples accessed from TCGA. Samples to the right of the dotted lines have detectable MYH6 expression.
Figure 1.
Figure 1.. Single Cell RNA/TCR sequencing reveals abundant clonal effector CD8+ T cells in ICI-MC.
A) Phenotypic summary of mice with Pdcd1 and Ctla4 genetic loss. Pdcd1−/−Ctla4+/+ mice do not have an overt phenotype. Mice with complete loss of Ctla4 have a fatal lymphoproliferative disorder, regardless of Pdcd1 genotype. Pdcd1−/−Ctla4+/− mice develop fulminant MC. B) H&E of cardiac tissue from a healthy wild type mouse and a Pdcd1−/−Ctla4+/− mouse with MC. Scale bar represents 200μm. Representative of n=10 animals per genotype. C) Dimensionality reduction with UMAP of scRNAseq on sorted CD45+ immune cells from control wild type mouse hearts (n=6) compared to hearts (n=4) of Pdcd1−/−Ctla4+/− mice with MC (n= 2509 cells per genotype). Cell type annotations were assisted by singleR and are quantified on the right. D) UMAP is subset on cells with Cd3e expression >1.5 and presence of a TCR, and then clustered using the Louvain algorithm (n=1266 cells). The proportion of the control and MC T cells in each cluster is quantified on the right. E) Expression of key T cell identity genes Cd8a and Cd4 are shown for each T cell cluster. F) TCR density is a measure of how many of the 100 nearest neighbors share the same TCR α and β chain. TCR density is shown for each cluster and split by control or MC. G) Differential gene expression between cluster 0 T cells and all other T cell clusters (1,2,3, and 4). Higher expression in cluster 0 is indicated by positive fold change. Red indicates FDR-corrected p-value (q-value) <0.05. Black indicates not significant. h) Violin plots shown expression of key genes by clonality and sample. Clonal is defined as > 2 cells with the same TCR α and β chains. No clonal cells are seen in the control sample. Identity genes are light blue. Naïve T cells genes are dark blue. T cell activation genes are red.
Figure 2.
Figure 2.. CD8+ T cells are necessary for MC.
A) Pdcd1−/−Ctla4+/− mice were treated with anti-CD4, anti-CD8 or control antibodies. Antibody treatments were started at 21 days of age and administered three times weekly. Time is measured since birth, but no animals are censored prior to the start of the experiment at day 21. P =0.03, anti-CD8 v control, p=0.02, anti-CD8 v. anti-CD4, two-sided cox proportional hazard tests. Risk tables show size of groups. B) Whole splenocytes or splenocytes from which CD8 cells were depleted from Pdcd1−/−Ctla4+/− mice with MC were transferred to Rag1−/− recipient mice. Day 0 is the day of adoptive transfer. P=0.0017, two-sided cox proportional hazard test. Risk tables show size of groups. C) Representative H&E from CD8 depleted splenocyte recipients compared to whole splenocyte recipients. Only cardiac sections are shown. Scale bars show 50μm. Representative of n=10 animals per group. D) Representative IHC for CD8 on cardiac sections from CD8 depleted splenocyte recipients compared to whole splenocyte recipients. Scale bars show 50μm. Representative of n=10 animals per group. E) TCR β chain sequencing on cardiac tissue from a donor Pdcd1−/−Ctla4+/− mouse (Donor, in bold) and Rag1−/− whole splenocyte recipients (Rec1-4). The top ten most abundant TCRs from the donor plus the most abundant TCR from Rec2 are shown. Flow between samples indicates shared TCRs. Bolded CDR3s indicate most clonal TCRs.
Figure 3.
Figure 3.. α-myosin is an MHC-I restricted autoantigen in murine MC.
A) TCRs-A, 1-4, used for antigen discovery, shown on the same plot as Fig. 1d. Grey cells do not express TCRs A or 1-4. b) Log median expression of 18 cardiac enriched genes in the heart (red) and thymus (blue). Genes to the left of the dashed line have no detectable expression in thymic APCs. c) NFAT-GFP reporter activity, measured by flow cytometry and shown as geometric mean fluorescence intensity, of all TCR cell lines stimulated independently with 172, 10-20aa SBK2, ANP, BNP, or α-myosin peptides. TCRs to the left of the dotted line are derived from single cell sequencing data (see Fig. 3a). TCRs to the right of the dotted line were selected due to expansion in adoptive transfer experiments (see Fig. 2e). TCRs named with letters (A-C) have a cognate antigen identified whereas TCRs named with numerals (1-4) do not have an identified cognate antigen. Top α-myosin peptide hits are labeled. d) Representative (of n=3 independent replicates) flow cytometry histograms of each TCR cell line co-cultured with BMDCs and stimulated with 10μg/mL predicted cognate peptide relative to no peptide. Peptide sequences are shown in the table. e) Each TCR cell line was co-cultured with EL-4 APCs and 10μg/mL cognate peptide (VIQYFASI for TCRs A and B; VQQVYYSI for TCR C; except for no peptide controls) with or without 10μg/mL of anti-Kb or anti-Db blocking antibody. NFAT-GFP reporter activity is shown as percent of live cells. n=3 biological replicates. P=0.00035 (TCR-A), p=0.004 (TCR-B), p=0.013 (TCR-C), two-sided t-tests for no block to anti-Kb, adjusted for multiple comparisons. f) Representative flow cytometry of SIINFEKL (red) and VIQYFASI (blue) loaded H2-Kb tetramer staining on cardiac CD3+CD8+ cells. g) Quantification of control, VIQYFASI, and VQQVYYSI H2-Kb-tetramer staining in cardiac CD3+CD8+ cells in individual mice. Each group of three bars represents one mouse with MC. n=9 mice (n=5 female; n=4 male).
Figure 4.
Figure 4.. α-myosin expanded TCRs are present in cardiac and skeletal muscle of patients with ICI-MC.
a) Shannon diversity of TCR beta chain repertoires. Dashed lines connect blood samples within same donor. P-values represent two-sided Wilcoxon tests. n=6 PBMC, n= 6 α-myosin exPBMC, n=3 CEF exPBMC, n=5 heart from 3 patients (multiple regions for pt2), n=4 skeletal muscle from 2 patients, n=3 rejection from 3 cardiac transplant patients, n=8 ICI-colitis from 8 patients, n=4 Crohn’s from 4 patients. b) ICI-MC patient tissues. RV= right ventricle. LV = left ventricle. IVS = interventricular septum. c) Change in TCR counts from PBMC to α-myosin exPBMC plotted by abundance of the same TCR beta chain in the autologous inflamed cardiac tissue. Minimal change is less than a 50 read count change. Not present means not found in either PBMC or exPBMC. d) Dimensionality reduction with UMAP on scRNAseq of CD3+ patient 1 exPBMC. Groups are divided by whether the TCR beta chain expressed by that cell is present in the patient’s heart and whether that TCR is clonal (expressed by >2 cells in exPBMC). e) Proportion of single cell sequenced exPBMCs that are clonal, stratified by whether that TCR is present in the heart. P<0.0001 by two-sided Fisher’s Exact test. f) Violin plots of key genes by presence or absence in heart and clonality in exPBMC. Identity genes are light blue. Naïve genes are dark blue. Activation genes are red. g) Flow cytometry histogram of TCR-Pt1 reporter cell line co-cultured with autologous LCLs and stimulated with 10μg/mL RINATLETK peptide relative to no peptide. (n=3 replicates) h) Scatter plot showing CD3+CD8+ Pt1 exPBMC stained with irrelevant peptide or RINATLETK on HLA-A:03*01 tetramer. i) Quantification of RINATLETK on HLA-A:03*01 tetramer staining across samples, compared to irrelevant peptide. n=2 healthy donors for baseline PBMC. n=6 exPBMC (1 replicate for 2 ICI-MC patients and 2 replicates for 2 healthy donors).

Comment in

References

    1. Wang DY, Salem J-EE, Cohen JV., et al. Fatal Toxic Effects Associated With Immune Checkpoint Inhibitors: A Systematic Review and Meta-analysis. JAMA Oncol. 2018;4(12):1721–1728. http://www.embase.com/search/results?subaction=viewrecord&from=export&id.... Accessed October 15, 2019. - PMC - PubMed
    1. Wei SC, Meijers WC, Axelrod ML, et al. A Genetic Mouse Model Recapitulates Immune Checkpoint Inhibitor–Associated Myocarditis and Supports a Mechanism-Based Therapeutic Intervention. Cancer Discov. 2020;11(3):614–639. doi:10.1158/2159-8290.cd-20-0856 - DOI - PMC - PubMed
    1. Lv H, Havari E, Pinto S, et al. Impaired thymic tolerance to α-myosin directs autoimmunity to the heart in mice and humans. J Clin Invest. 2011;121(4):1561–1573. doi:10.1172/JCI44583 - DOI - PMC - PubMed
    1. Gabrielsen ISM, Helgeland H, Akselsen H, et al. Transcriptomes of antigen presenting cells in human thymus. PLoS One. 2019;14(7):e0218858. doi:10.1371/JOURNAL.PONE.0218858 - DOI - PMC - PubMed
    1. Johnson DB, Balko JM, Compton ML, et al. Fulminant myocarditis with combination immune checkpoint blockade. N Engl J Med. 2016;375(18):1749–1755. doi:10.1056/NEJMoa1609214 - DOI - PMC - PubMed

Methods only extended references

    1. Mombaerts P, Iacomini J, Johnson RS, Herrup K, Tonegawa S, Papaioannou VE. RAG-1-deficient mice have no mature B and T lymphocytes. Cell. 1992;68(5):869–877. doi:10.1016/0092-8674(92)90030-G - DOI - PubMed
    1. Satija R, Farrell JA, Gennert D, Schier AF, Regev A. Spatial reconstruction of single-cell gene expression data. 2015;33(5):495–502. doi:10.1038/nbt.3192 - DOI - PMC - PubMed
    1. Butler A, Hoffman P, Smibert P, Papalexi E, Satija R. Integrating single-cell transcriptomic data across different conditions, technologies, and species. Nat Biotechnol. 2018;36(5):411–420. doi:10.1038/nbt.4096 - DOI - PMC - PubMed
    1. Stuart T, Butler A, Hoffman P, et al. Comprehensive Integration of Single-Cell Data. Cell. 2019;177(7):1888–1902.e21. doi:10.1016/j.cell.2019.05.031 - DOI - PMC - PubMed
    1. Heather JM, Spindler MJ, Alonso MH, et al. Stitchr: stitching coding TCR nucleotide sequences from V/J/CDR3 information. bioRxiv. December 2021:2021.12.20.473544. doi:10.1101/2021.12.20.473544 - DOI - PMC - PubMed

Publication types