. 2022 Dec;612(7939):347-353.
doi: 10.1038/s41586-022-05426-1. Epub 2022 Nov 16.

Colon tumour cell death causes mTOR dependence by paracrine P2X4 stimulation

Affiliations

Colon tumour cell death causes mTOR dependence by paracrine P2X4 stimulation

Mark Schmitt et al. Nature. 2022 Dec.

Abstract

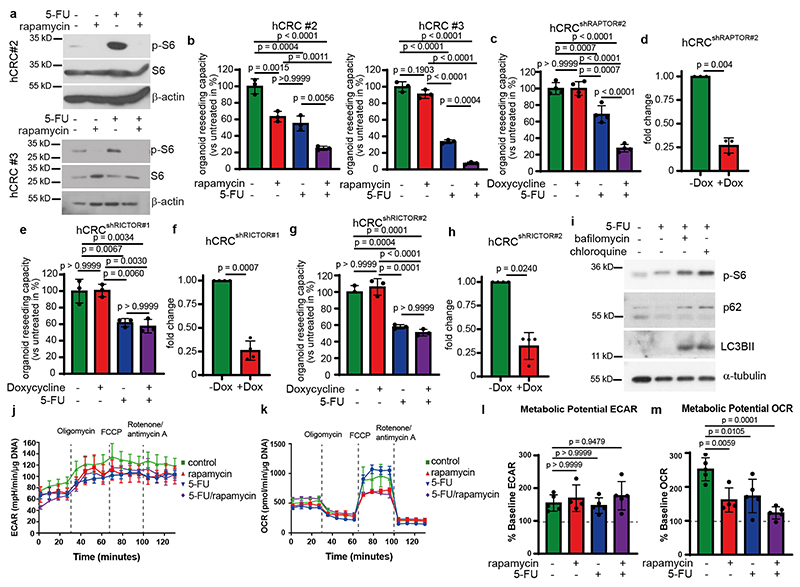
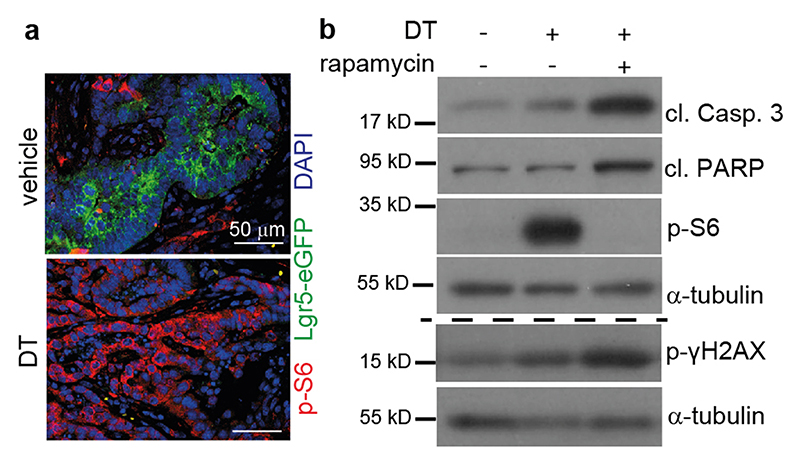
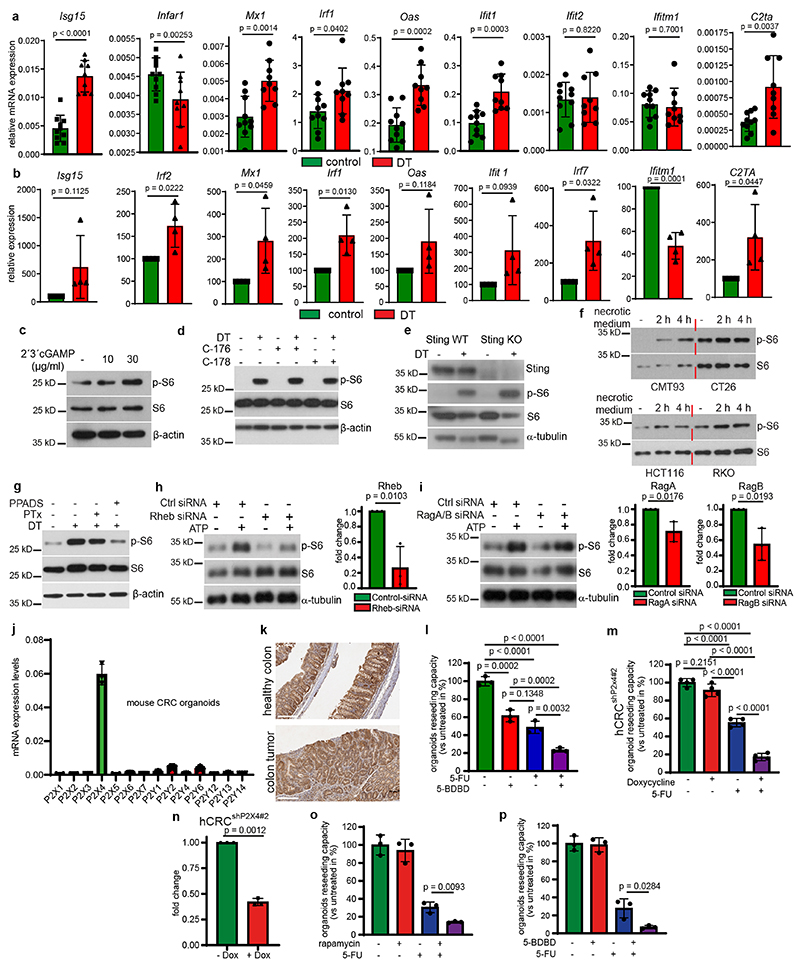
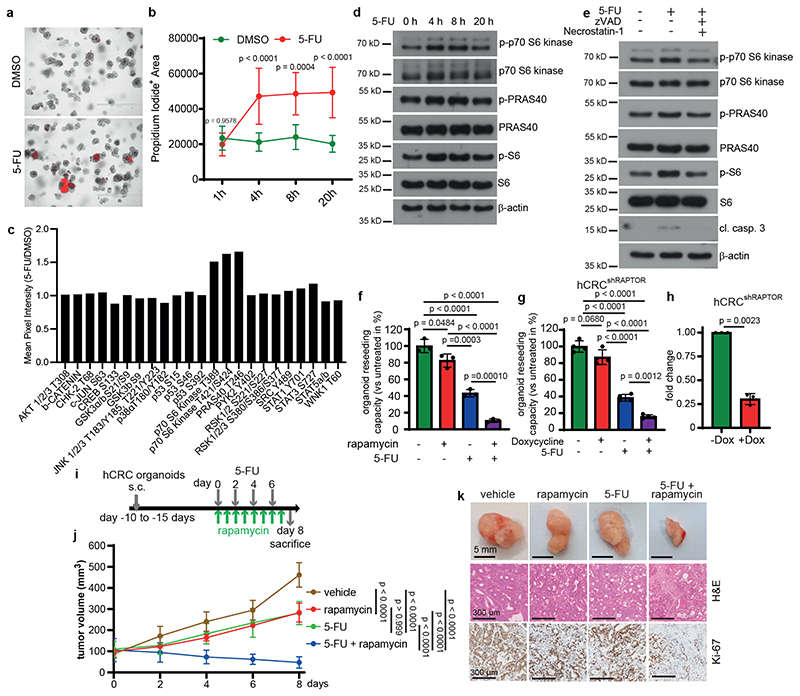
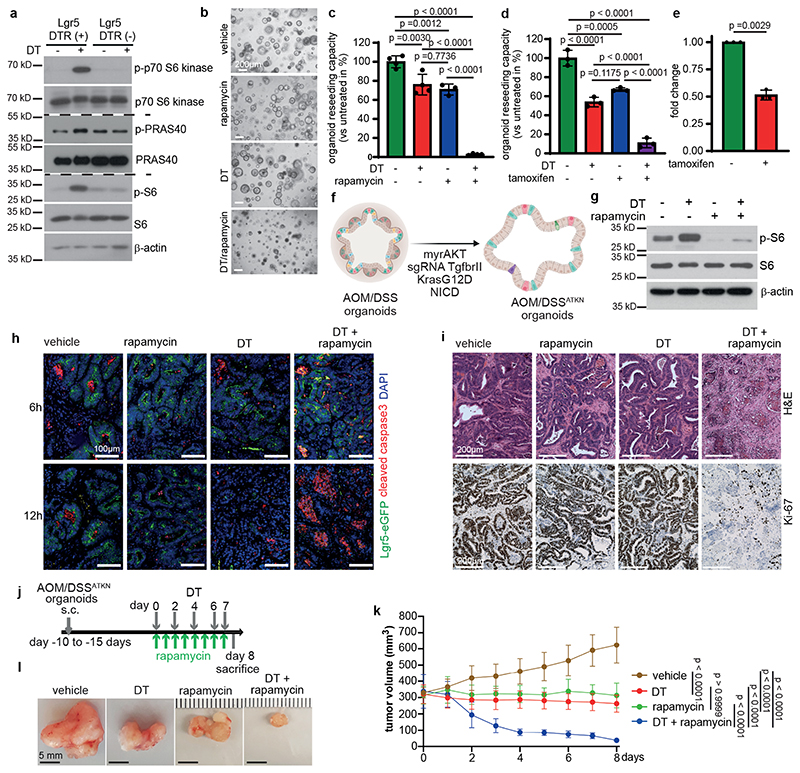
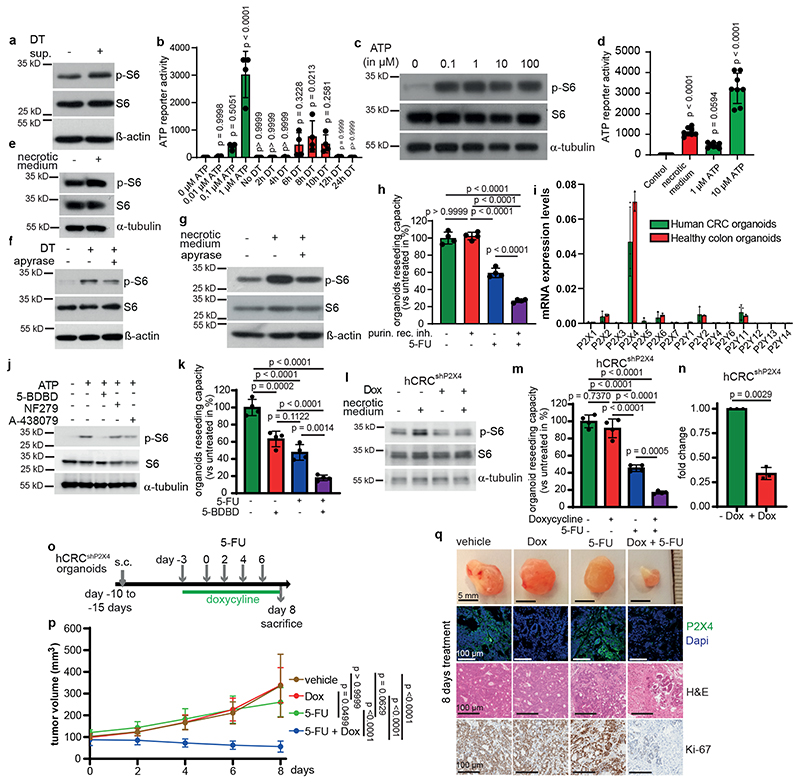
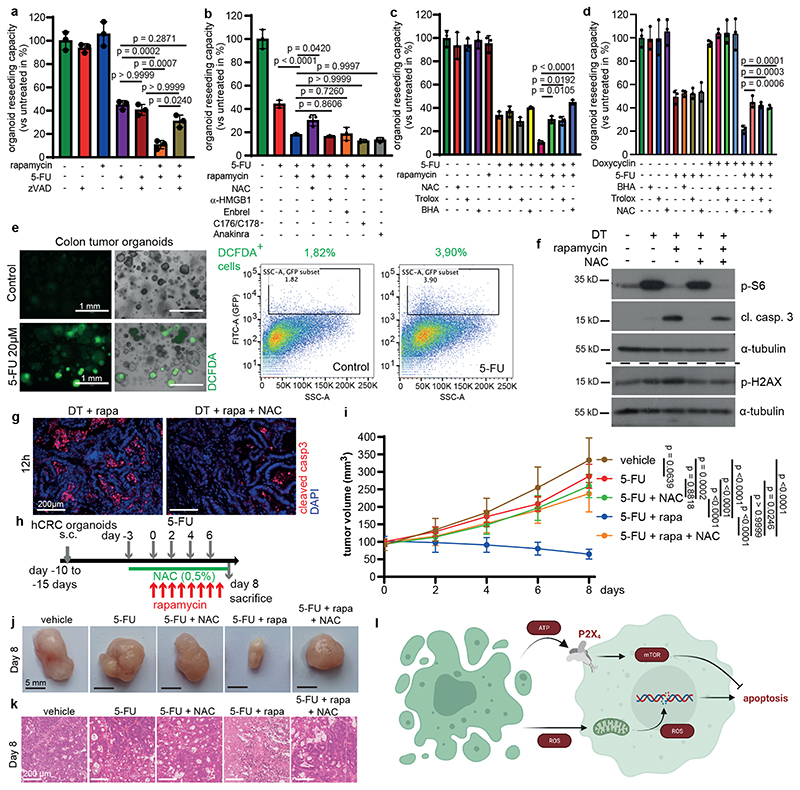
Solid cancers exhibit a dynamic balance between cell death and proliferation ensuring continuous tumour maintenance and growth1,2. Increasing evidence links enhanced cancer cell apoptosis to paracrine activation of cells in the tumour microenvironment initiating tissue repair programs that support tumour growth3,4, yet the direct effects of dying cancer cells on neighbouring tumour epithelia and how this paracrine effect potentially contributes to therapy resistance are unclear. Here we demonstrate that chemotherapy-induced tumour cell death in patient-derived colorectal tumour organoids causes ATP release triggering P2X4 (also known as P2RX4) to mediate an mTOR-dependent pro-survival program in neighbouring cancer cells, which renders surviving tumour epithelia sensitive to mTOR inhibition. The induced mTOR addiction in persisting epithelial cells is due to elevated production of reactive oxygen species and subsequent increased DNA damage in response to the death of neighbouring cells. Accordingly, inhibition of the P2X4 receptor or direct mTOR blockade prevents induction of S6 phosphorylation and synergizes with chemotherapy to cause massive cell death induced by reactive oxygen species and marked tumour regression that is not seen when individually applied. Conversely, scavenging of reactive oxygen species prevents cancer cells from becoming reliant on mTOR activation. Collectively, our findings show that dying cancer cells establish a new dependency on anti-apoptotic programs in their surviving neighbours, thereby creating an opportunity for combination therapy in P2X4-expressing epithelial tumours.


Conflict of interest statement

Competing interests

M.S., J.G. and F.R.G. filed a patent regarding the use of P2X4 inhibitors in combination with cytotoxic compounds. F.J.d.S is employee of Genentech and own Roche shares. F.R.G. is a consultant for Amazentis not related to this study. All other authors declare no competing financial interests.

Figures

Extended Data Fig. 1
Extended Data Fig. 1. (Related to Figure 1): CRC resistance to 5-FU depends on mTORC1 but not mTORC2.
a, Immunoblot analysis of two different human tumor organoid lines derived from sporadic CRC treated as indicated (n=3). b, Reseeding capacity of hCRC organoid lines treated with 5-FU, rapamycin or 5-FU/rapamycin (n=3, one of three biological replicates). c, Reseeding capacity of doxycycline-inducible hCRCshRAPTORr#2 tumor organoids treated as indicated (n=4, one of three biological replicates). d, Raptor qRT-PCR analysis of doxycycline treated hCRCshRAPTOR#2 tumor organoids (n=3 biological replicates). e, Reseeding capacity of doxycycline-inducible hCRCshRICTOR tumor organoids treated as indicated (n=4, one of three biological replicates). f, Rictor qRT-PCR analysis of doxycycline treated hCRCshRictor#1 tumor organoids (n=3 biological replicates). g, Reseeding capacity of doxycycline inducible hCRCshRICTOR#2 tumor organoids treated as indicated (n=4, one of three biological replicates). h, Rictor qRT-PCR analysis of doxycycline treated hCRCshRictor#2 tumor organoids (n=3 biological replicates). i, Immunoblot analysis of Lgr5 - tumor organoids treated as indicated (n=3). j) Profiles for Extracellular Acidification Rate (ECAR) of AOM/DSSATKN tumor organoids treated as indicated for 24h (n=4 for rapamycin treated organoids in all other conditions n=5 biological replicates of one experiment). k) Profiles for Oxygen Consumption Rate (OCR) of AOM/DSSATKN tumor organoids described in (j) (n=4 for rapamycin treated organoids in all other conditions n=5 biological replicates of one experiment). l) Percentage of metabolic potential over baseline in ECAR in organoids described in (j) (n=4 for rapamycin treated organoids in all other conditions n=5 biological replicates of one experiment). m) Percentage of metabolic potential over baseline in OCR in organoids treated described in (j) (n=4 for rapamycin treated organoids in all other conditions n=5 biological replicates of one experiment). All data are mean ±SD (except for j, k where data are mean ±SEM) and analysed by twotailed Student’s t-test (d, f, h) or 1-way ANOVA with Bonferroni’s multiple comparison (b, c, e, g, l, m).
Extended Data Fig. 2
Extended Data Fig. 2. (related to Figure 2): Dying tumor cells activate mTORC1 in surrounding tumor cells in vivo.
a, Immunofluorescence analysis of p-S6 (red) and EGFP (Lgr5, green) expression in tumor tissues of vehicle or DT treated AOM/DSS mice 24h after injection. Nuclei were counterstained with DAPI. Representative images are shown (n=3 biological replicates, scale bar = 50 μm). b, Immunoblot analysis of AOM/DSSATKN tumor organoids treated as indicated. For p-γH2AX and the corresponding α-tubulin loading samples were run on a separate gel (see SI). Representative results are shown (n=3).
Extended Data Fig. 3
Extended Data Fig. 3. (related to Figure 3): Dying tumor cells activate mTORC1 via ATP/P2X4 in human CRC and PDAC.
a, Relative mRNA expression levels of the indicated genes in the colon tumors from Lgr5EGFP-DTR(+) mice 24h after injection of DT injection or vehicle determined by qRT-PCR. (n=10 tumors for controls and n=9 tumors for DT). b, Relative mRNA expression levels of the indicated genes in Lgr5EGFP-DTR(+) tumor organoids at 24h after DT treatment determined by qRT-PCR. Expression of vehicle treated organoids was set to 100 arbitrary units (n=4 biological replicates). c, Immunoblot analysis of Lgr5EGFP-DTR(+) tumor organoids treated as indicated for 30 min (n=3). d, Immunoblot analysis of Lgr5EGFP-DTR(+) tumor organoids treated as indicated for 16h (n=3). e, Immunoblot analysis of Sting WT and Sting KO Lgr5EGFP-DTR(+) tumor organoids treated as indicated (n=4). f, Immunoblot analysis of murine (CMT93 and CT26, left panel) and human CRC cells (HCT116 and RKO, right panel) treated as indicated (n=2). g, Immunoblot analysis of Lgr5EGFP-DTR(+) tumor organoids treated as indicated for 12h (n=3). h, Left: Immunoblot analysis of ATP (100 μM) treated CT26 cells transfected with control or Rheb siRNA (n=3). Right: Relative mRNA expression levels of Rheb in siRNA transfected cells determined by qRT-PCR (n=3 biological replicates). i, Left: Immunoblot analysis of ATP (100 μM) treated CT26 cells transfected with control or a combination of RagA and RagB siRNA (n=3). Right: Relative mRNA expression levels RagA and RagB in siRNA transfected cells determined by qRT-PCR (n=3 biological replicates). j, Relative mRNA expression levels of P2x and P2y receptors in mouse colon tumor organoids tissues determined by qRT-PCR (n=3 biological replicates). k, Immunohistochemistry analysis of P2x4 expression in healthy murine colon or colon tumors of AOM/DSS treated mice. Images from one representative staining (n=3, scale bar = 300 μm). l, Reseeding capacity of hCRC tumor organoid line 2 treated as indicated (n=3, one of three biological replicates). m, Reseeding capacity of doxycycline-inducible hCRCshP2x4# tumor organoids treated as indicated (n=4, one of three biological replicates). n, P2x4 qRT-PCR analysis of doxycycline treated hCRCshP2x4# tumor organoids (n=3 biological replicates). o, Reseeding capacity of human pancreatic tumor organoids treated as indicated (n=3, one of three biological replicates). p, Reseeding capacity of human pancreatic tumor organoids treated as indicated (n=3, one of three biological replicates) All data are mean ±SD and analysed by two-tailed Student’s t-test (a, b, h, i, n, o, p) or by 1way ANOVA with Bonferroni’s multiple comparison (l, m).
Figure 1
Figure 1. Resistance of colorectal patient-derived tumor organoids to 5-FU depends on mTOR activation.
a, Propidium iodide (PI) staining of hCRC organoids treated with 5-FU for 4h (n = 3 biological replicates, scale bar = 1000 μm). b, Quantification of PI+ area of 5-FU treated hCRC organoids (1h and 8h DMSO: n=6, 4h DMSO: n=9, 20h DMSO: n=8h, 1h and 8h 5-FU: n=7, 4h and 20h 5-FU n=10, data were pooled from 3 biological replicates). c, Kinase activation assay of 20h 5-FU treated hCRC organoids. Results represent fold increase of pixel intensity (5-FU/DMSO, n=1). For corresponding dot blot see SI. d, Immunoblotting of hCRC organoids treated as indicated (n=2). e, Immunoblotting of hCRC organoids, treated with zVAD and Necrostatin-1 2h prior to 4h 5- FU treatment (n=2). f, Reseeding capacity of hCRC organoids treated as indicated (n=3, one of four biological replicates). g, Reseeding capacity of doxycycline-inducible hCRCshRAPTOR organoids treated as indicated (n=4, one of three biological replicates). h, Raptor qRT-PCR analysis of doxycycline treated hCRCshRAPTOR tumor organoids (n=3 biological replicates). i, Treatment regimen of subcutaneous hCRC tumors. j, Growth rate of tumors in response to the treatment indicated in (i). n=6 mice for each condition. One set of mice was analysed. k, Representative images of subcutaneous hCRC tumors (scale bar = 5mm) and H&E and Ki-67 staining (scale bar = 300 μm) of tumor tissues of mice treated with 5-FU +/- rapamycin as indicated in (j), (n=6, staining was performed on all tumors indicated in (j)). All data are mean ±SD and analysed by two-tailed Student’s t-test (h) or 1-way ANOVA (f, g) and 2-way ANOVA (b, j), with Bonferroni’s multiple comparison.
Figure 2
Figure 2. Dying tumor cells induce mTOR survival signaling in a paracrine manner.
a, Immunoblotting of DT treated Lgr5EGFP-DTR(+) and Lgr5EGFP-DTR(-) tumor organoids (n = 3). PRAS40 and phospo-PRAS40 were probed on a separate gel (see SI). b, Representative Lgr5EGFP-DTR(+) tumor organoids treated as indicated (n=3, scale bar = 200μm). c, Reseeding capacity of Lgr5EGFP-DTR(+) tumor organoids treated as indicated (n=4, one of three biological replicates). d, Reseeding capacity of Villin-CreER Raptor ;Lgr5EGFP-DTR(+) tumor organoids treated as indicated (n=3, one of three biological replicates). e, Raptor qRT-PCR analysis of tamoxifen-induced Villin-Cre ERT2;RaptorF/F;Lgr5EGFP-DTR(+) tumor organoids (n=3 biological replicates). f, Schematic representation of AOM/DSSATKN tumor organoid generation. g, Immunoblotting of AOM/DSSATKN tumor organoids treated as indicated (n=3). h, AOM/DSSATKN tumor organoids were injected subcutaneously. Once tumors reached 200 mm3, mice were treated as indicated and analysed after 6h or 12h for cleaved caspase-3 and Lgr5-GFP. Nuclei were counterstained with Dapi. Representative images from at least 2 mice/timepoints (scale bar = 100μm). i, AOM/DSSATKN tumor organoids were injected subcutaneously. Once tumors reached 200 mm3, mice were treated as indicated for 24h and analysed by H&E and Ki-67 staining. Representative images are shown (n=3 mice, scale bar = 200μm). j, Treatment regimen of subcutaneous AOM/DSSATKN tumors. k, Growth rate of subcutaneous AOM/DSSATKN tumors in response to treatment as indicated in (j) (n=5 mice for vehicle and rapamycin, n=6 mice for DT and DT + rapamycin). One set of mice was analysed. l, Representative images of subcutaneous AOM/DSSATKN tumors on day 8 treated as indicated in (k), (n= same as (k), scale bar = 5mm). All data are mean ±SD and analysed by two-tailed Student’s t-test (e) or by 1-way ANOVA (c, d) and 2-way ANOVA (k) with Bonferroni’s multiple comparison.
Figure 3
Figure 3. Dying tumor cells release ATP to trigger mTORC1 via P2X4
a) Immunoblotting of Lgr5EGFP-DTR(-) tumor organoids treated with supernatant from DT-treated Lgr5EGFP-DTR(+) tumor organoids for 2h (n=2). b, ATP content in supernatants of DT treated organoids (n=4 biological replicates). c, Immunoblotting of Lgr5EGFP-DTR(-) tumor organoids treated with ATP for 15 min (n=3). d, ATP content in control or necrotic medium (n=8 biological replicates). e-g, Immunoblotting of Lgr5EGFP-DTR(+) tumor organoids treated as indicated (e, g were treated 2h, f for 6h) (n=3 for all immunoblots). h, Reseeding capacity of Lgr5EGFP-DTR(+) tumor organoids treated as indicated (n=4, one of four biological replicates). i, qRT-PCR analysis of indicated genes in hCRC or healthy colon organoids (n=3, one of two biological replicates). j, Immunoblotting of hCRC organoids treated as indicated for 15 min. Inhibitors were added 15 min prior to treatment with 100 μM ATP (n=3). k, Reseeding capacity of hCRC organoids treated as indicated (n=4, one of three biological replicates). l, Immunoblotting of P2x4 knockdown hCRC organoids (hCRCshP2X4) treated as indicated for 2h (n=3). m, Reseeding capacity of doxycycline-inducible hCRCshP2X4 tumor organoids treated as indicated (n=4, one of three biological replicates). n, P2X4 qRT-PCR analysis of doxycycline treated hCRCshP2X4 tumor organoids (n=3 biological replicates). o, Treatment regimen of subcutaneous hCRCshP2x4 tumors. p, Growth rate of subcutaneous hCRCshP2X4 tumors in response to 5-FU +/- doxycycline treatment as indicated in (o). (n=6 mice for each condition). One set of mice was analysed. q, Representative images of tumors and P2x4, Ki67 and H&E staining on tumor sections of mice indicated in (p), (n=6, scale bar = 100μm). Staining was performed on all tumors described in (p). All data are mean ±SD and analysed by two-tailed Student’s t-test (n) or 1-way ANOVA (b, d, h, k, m) and 2-way ANOVA (p) with Bonferroni’s multiple comparison.
Figure 4
Figure 4. ROS scavenging prevents induced mTOR addiction
a, Reseeding capacity of AOM/DSSATKN tumor organoids treated as indicated (n=3, one of three biological replicates). b, Reseeding capacity of AOM/DSSATKN tumor organoids treated as indicated (n=3, one of three biological replicates). c, Reseeding capacity of AOM/DSSATKN tumor organoids treated as indicated (n=3, one of four biological replicates). d, Reseeding capacity of hCRCshP2X4 tumor organoids treated as indicated (n=3, one of four biological replicates). e, Fluorescence microscopic and flow cytometric ROS analysis using DCFDA in 5-FU (20h) treated colon tumor organoids. One representative of four biological replicates (scale bar = 1mm). f, Immunoblot analysis of AOM/DSSATKN tumor organoids treated as indicated. p-γH2AX and the corresponding α-tubulin loading were probed on a separate gel (see SI) (n=3). g, AOM/DSSATKN tumor organoids were injected subcutaneously. Once tumor reached 200 mm, mice were treated as indicated for 12h and analysed for cleaved caspase 3. Nuclei were counterstained with DAPI. (n=3 mice, scale bar = 200 μm). h, Treatment regimen of subcutaneous hCRC tumors. i, Growth rate of subcutaneous hCRC tumors in response to treatment as indicated in (h) (n=6 mice for vehicle treatment, n=7 mice for all other treatments. One set of mice was analysed. j, Representative images of subcutaneous hCRC tumors on day 8 treated as indicated in (i), (n=6 for vehicle, n=7 for all other treatments, scale bar = 5 mm). k, Representative H&E staining of subcutaneous hCRC tumors described in (i) (n=6 for vehicle, n=7 for all other treatments, scale bar = 200 μm). Staining was performed on all tumors indicated in (i). l, Schematic representation of how dying cells activate mTOR in adjacent cells to counteract apoptosis induction by increased ROS levels. All data are mean ±SD and analysed by 1-way ANOVA (a-d) or 2-way ANOVA (i) with Bonferroni’s multiple comparison.

Comment in

References

    1. Endo H, Inoue M. Dormancy in cancer. Cancer Sci. 2019;110:474–480. - PMC - PubMed
    1. Gudipaty SA, Conner CM, Rosenblatt J, Montell DJ. Unconventional Ways to Live and Die: Cell Death and Survival in Development, Homeostasis, and Disease. Annu Rev Cell Dev Biol. 2018;34:311–332. - PMC - PubMed
    1. van Schaik TA, Chen KS, Shah K. Therapy-Induced Tumor Cell Death: Friend or Foe of Immunotherapy? Front Oncol. 2021;11:678562. - PMC - PubMed
    1. Diwanji N, Bergmann A. Two Sides of the Same Coin-Compensatory Proliferation in Regeneration and Cancer. Adv Exp Med Biol. 2019;1167:65–85. - PubMed
    1. Fonseca BD, Smith EM, Lee VH, MacKintosh C, Proud CG. PRAS40 is a target for mammalian target of rapamycin complex 1 and is required for signaling downstream of this complex. J Biol Chem. 2007;282:24514–24524. - PubMed

Publication types

Substances