. 2022 Nov;611(7937):769-779.
doi: 10.1038/s41586-022-05439-w. Epub 2022 Nov 16.

APOE4 impairs myelination via cholesterol dysregulation in oligodendrocytes

Affiliations

APOE4 impairs myelination via cholesterol dysregulation in oligodendrocytes

Joel W Blanchard et al. Nature. 2022 Nov.

Erratum in

  • Author Correction: APOE4 impairs myelination via cholesterol dysregulation in oligodendrocytes.
    Blanchard JW, Akay LA, Davila-Velderrain J, von Maydell D, Mathys H, Davidson SM, Effenberger A, Chen CY, Maner-Smith K, Hajjar I, Ortlund EA, Bula M, Agbas E, Ng A, Jiang X, Kahn M, Blanco-Duque C, Lavoie N, Liu L, Reyes R, Lin YT, Ko T, R'Bibo L, Ralvenius WT, Bennett DA, Cam HP, Kellis M, Tsai LH. Blanchard JW, et al. Nature. 2024 Dec;636(8043):E9. doi: 10.1038/s41586-024-08434-5. Nature. 2024. PMID: 39633058 No abstract available.

Abstract

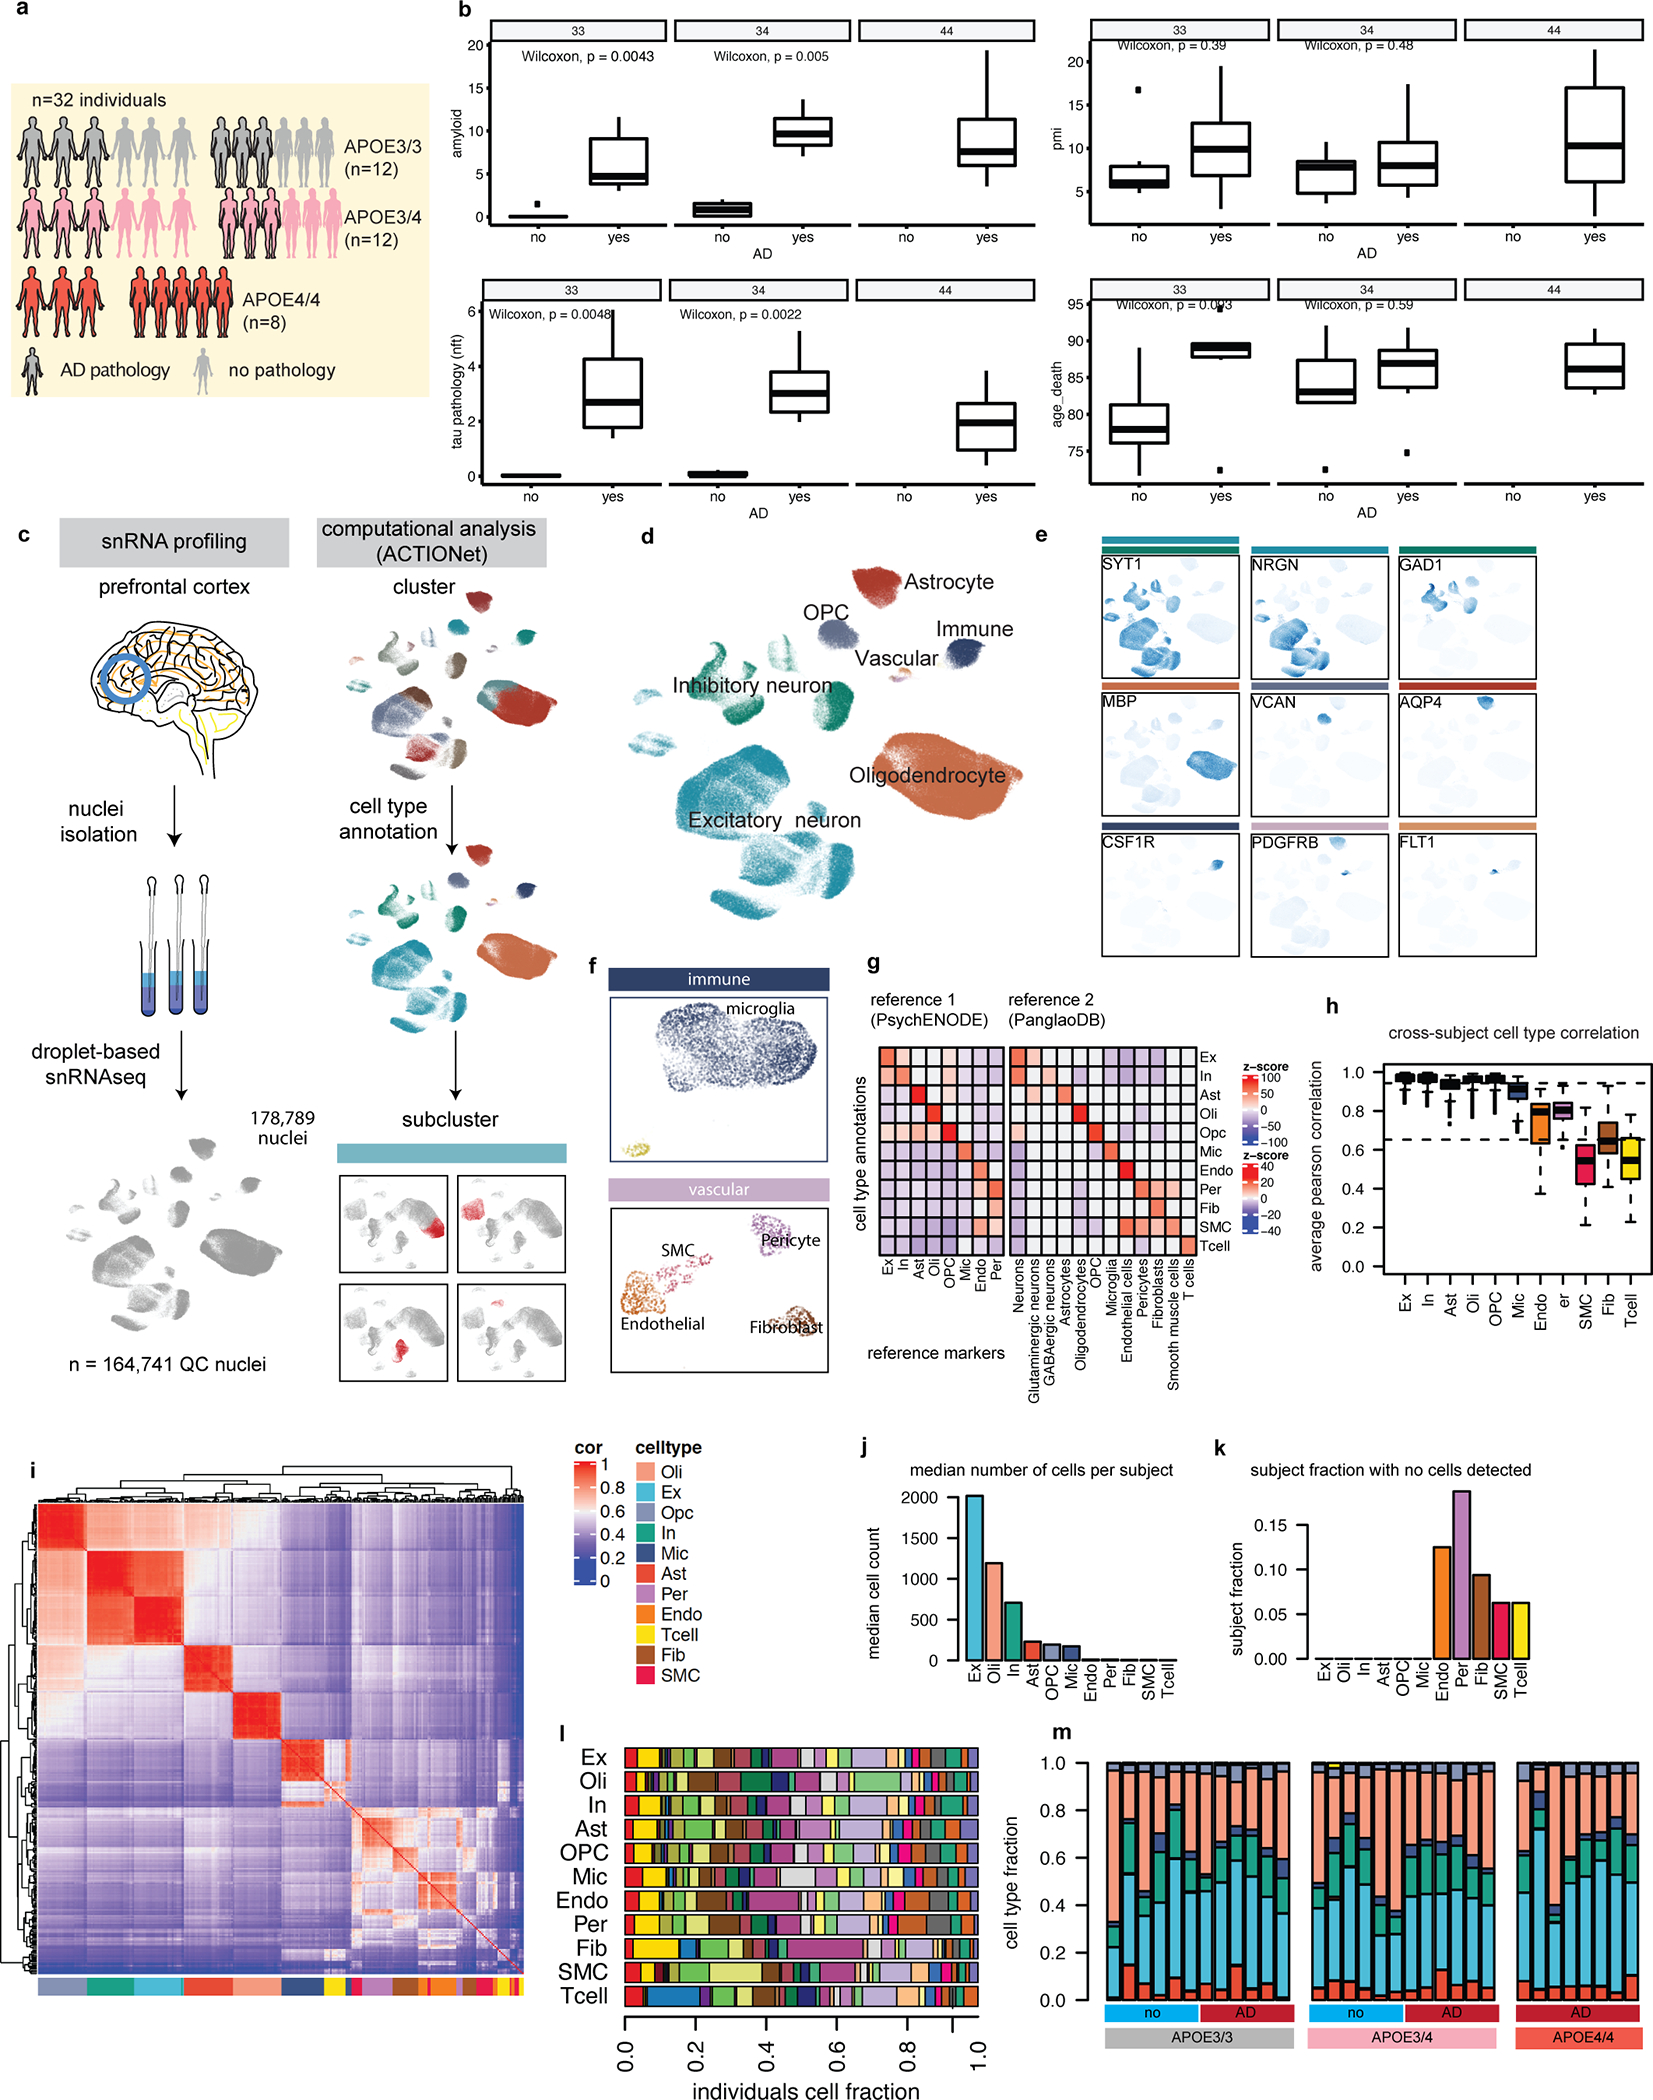
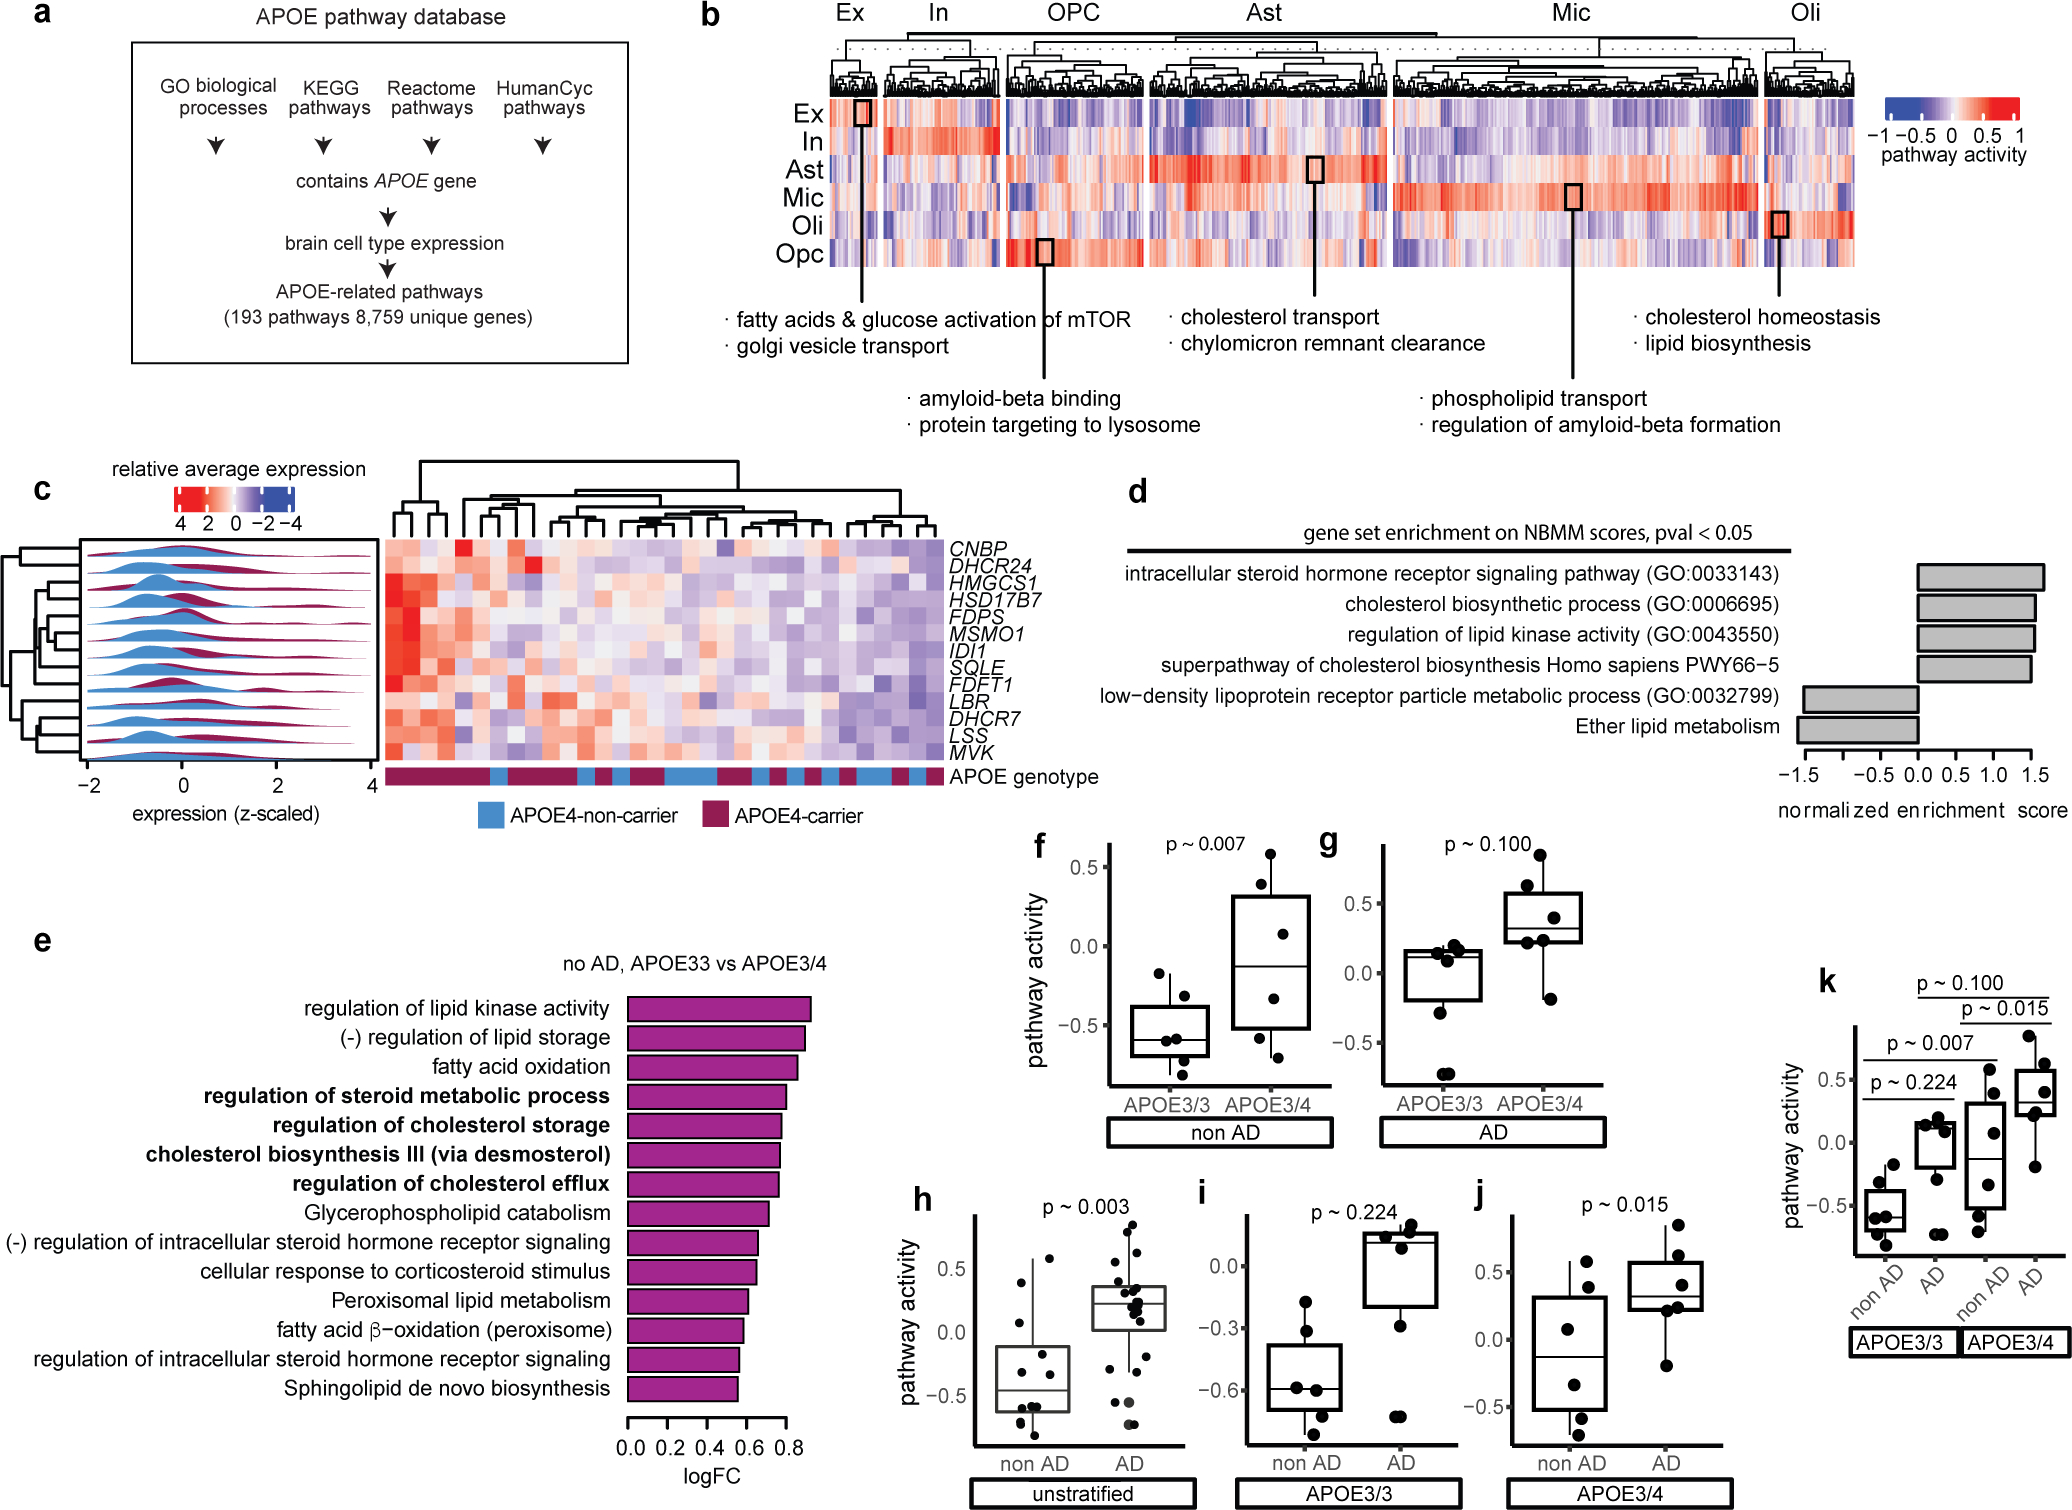
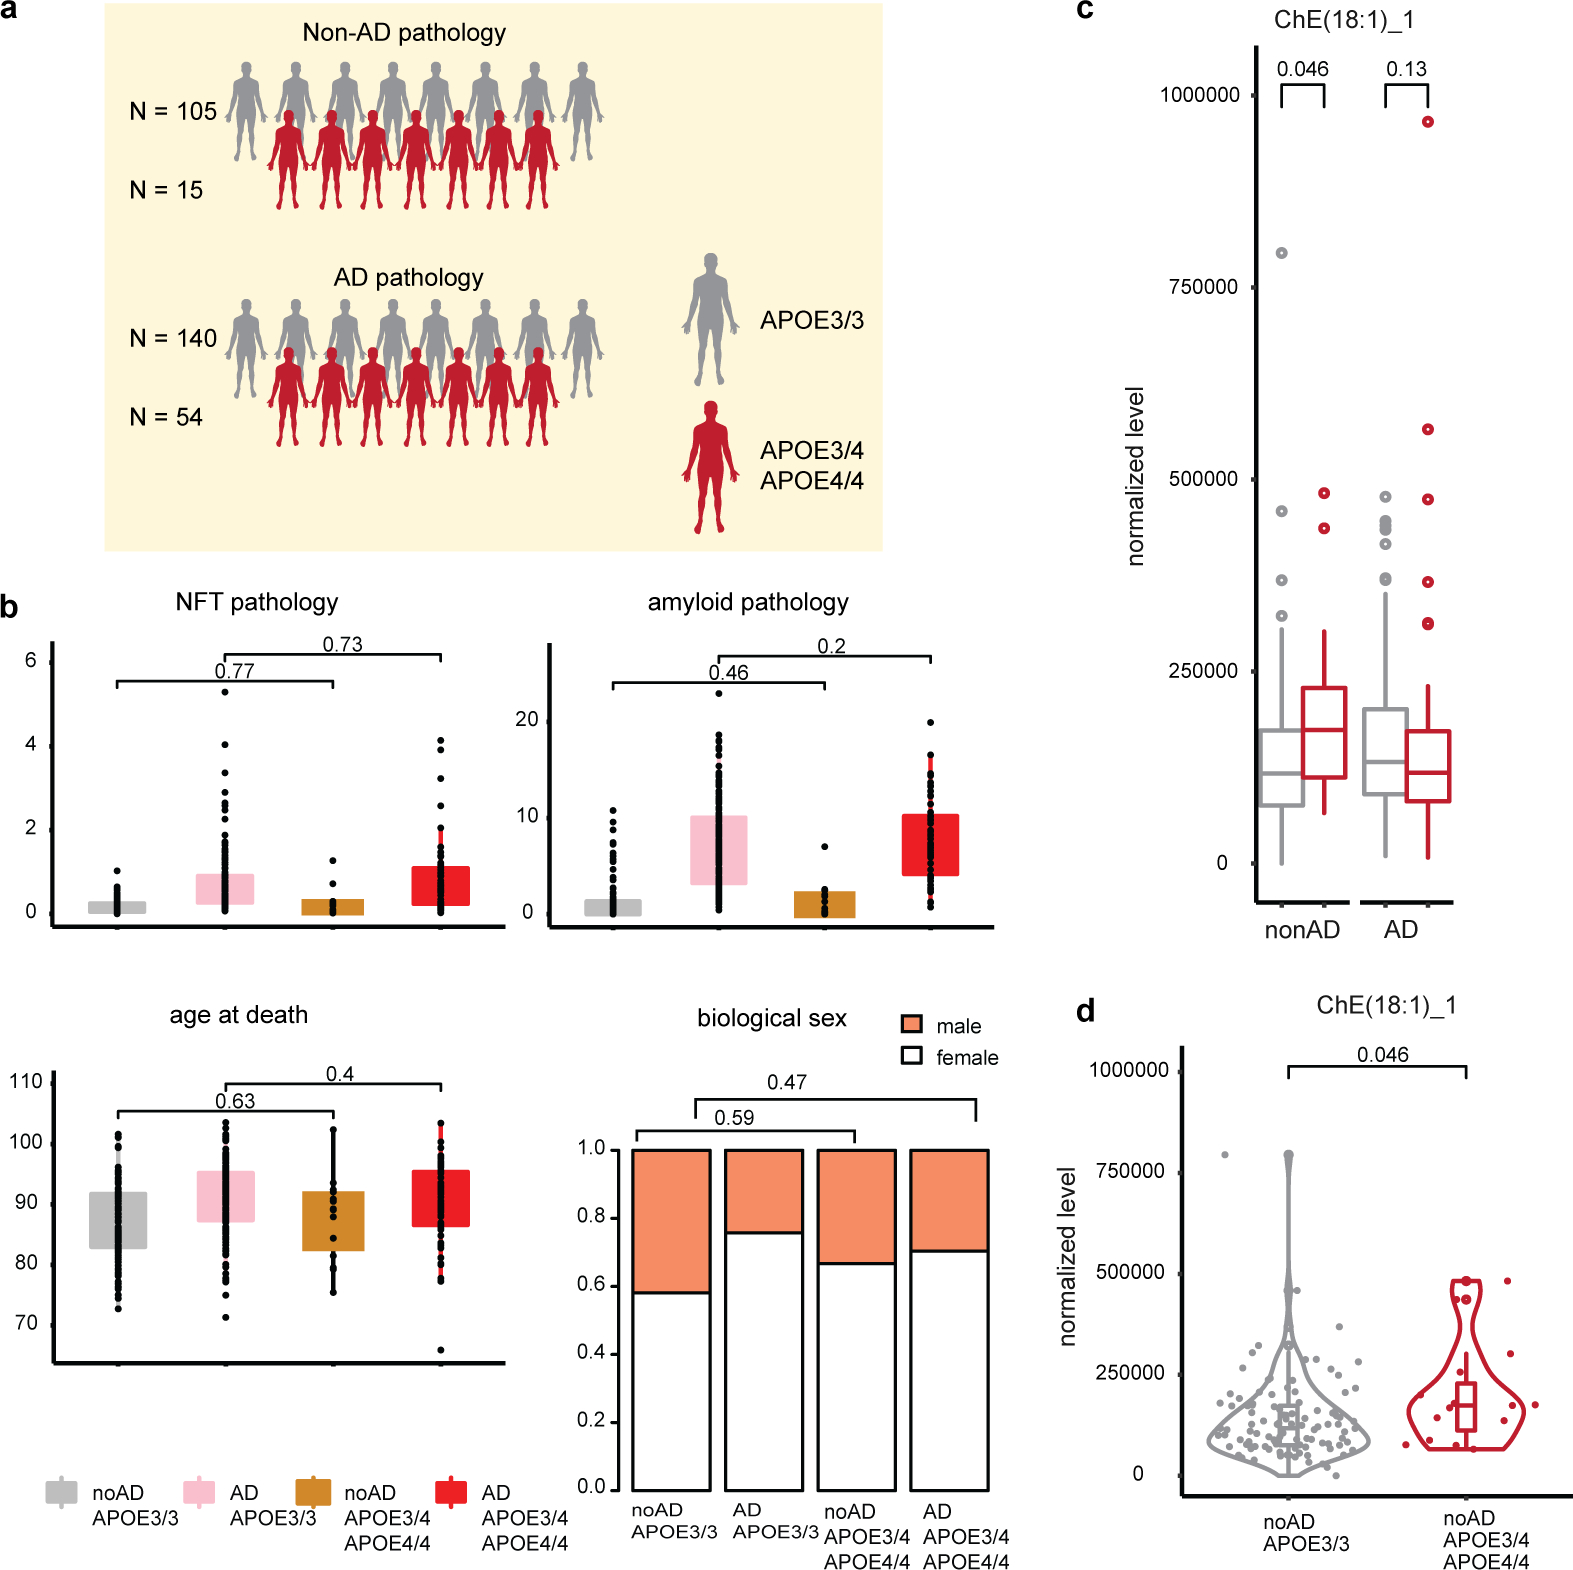
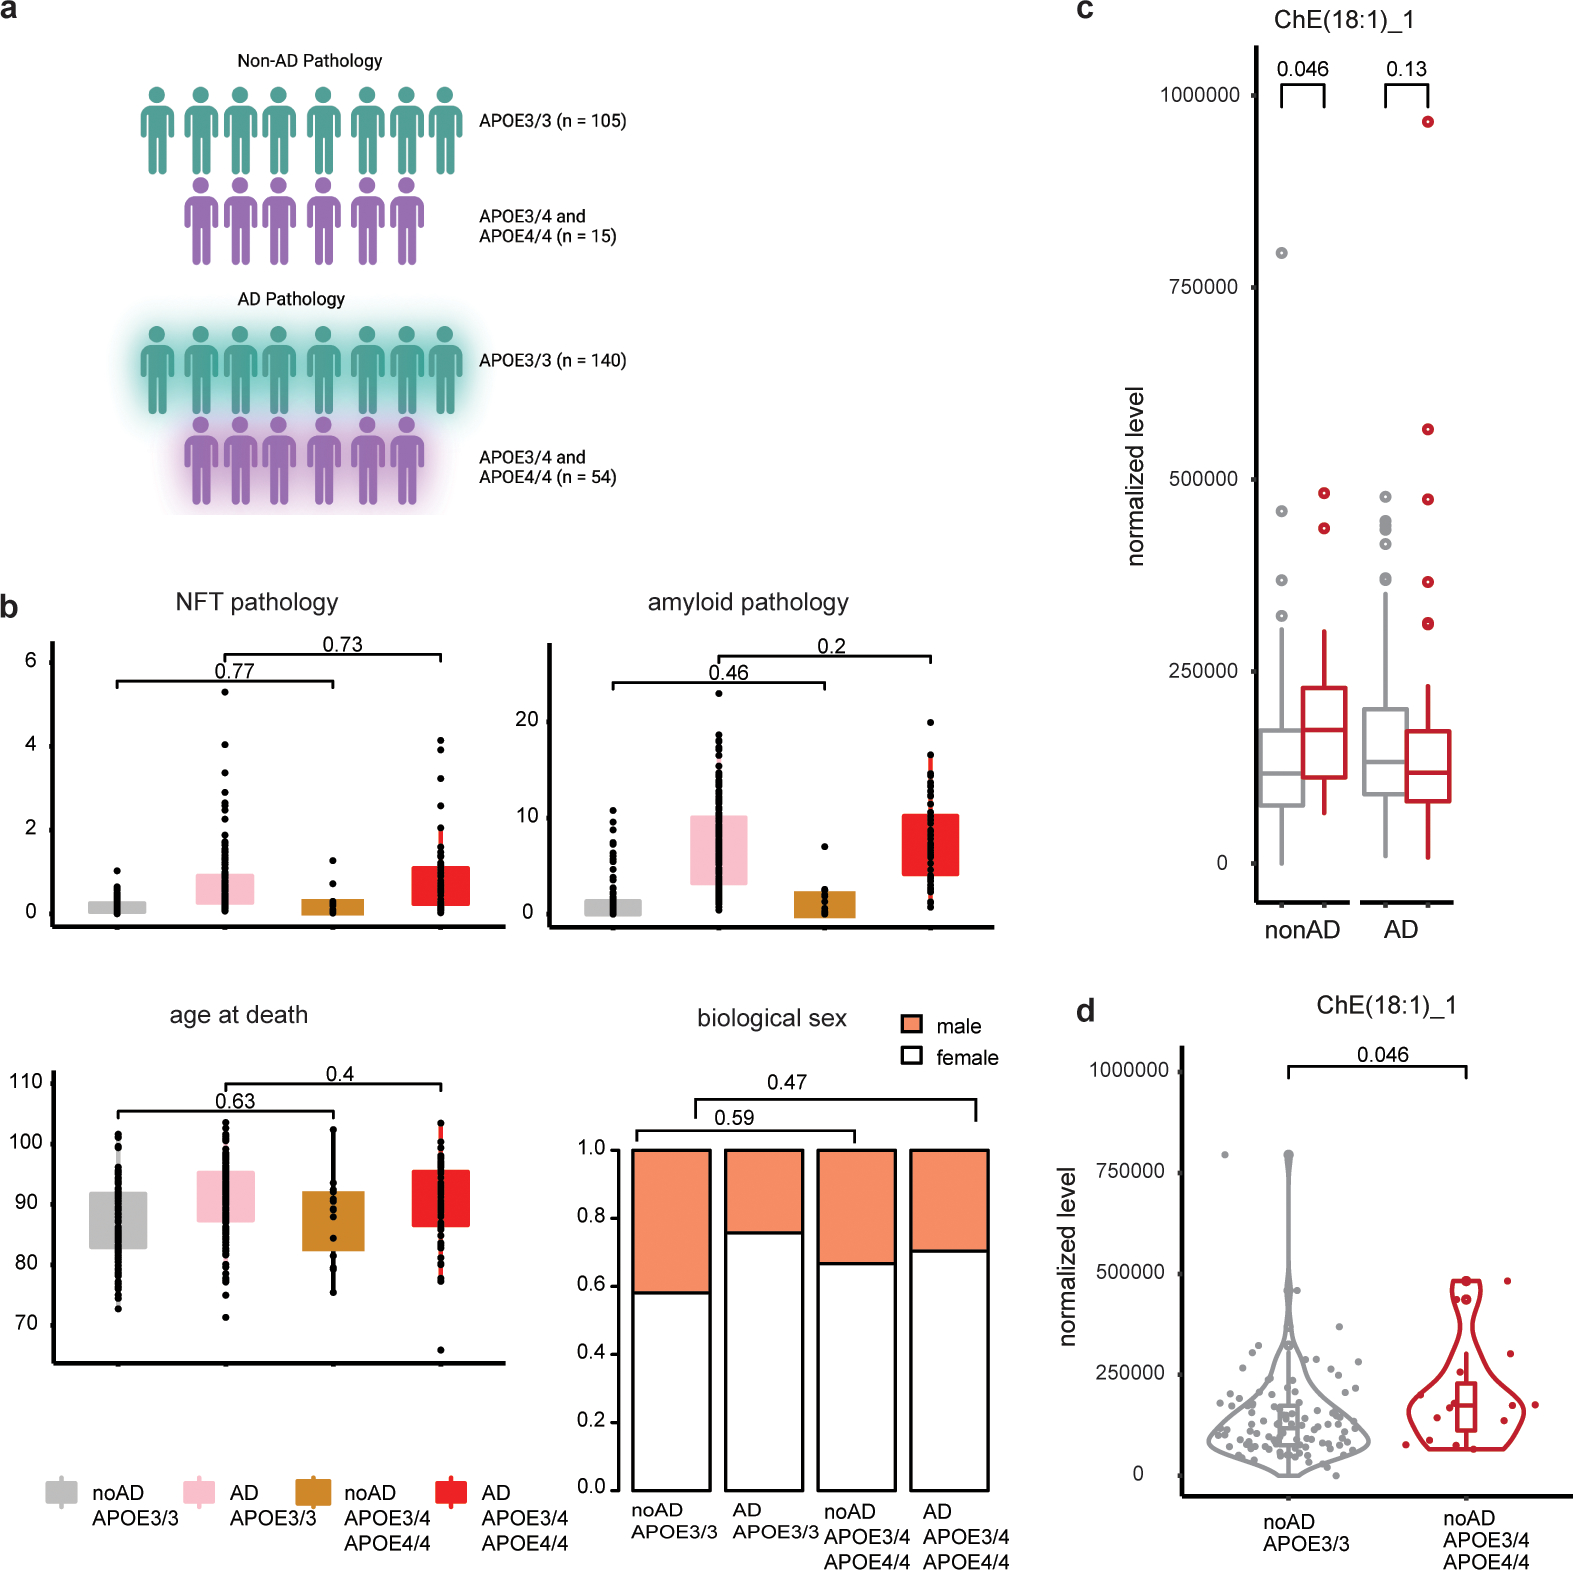
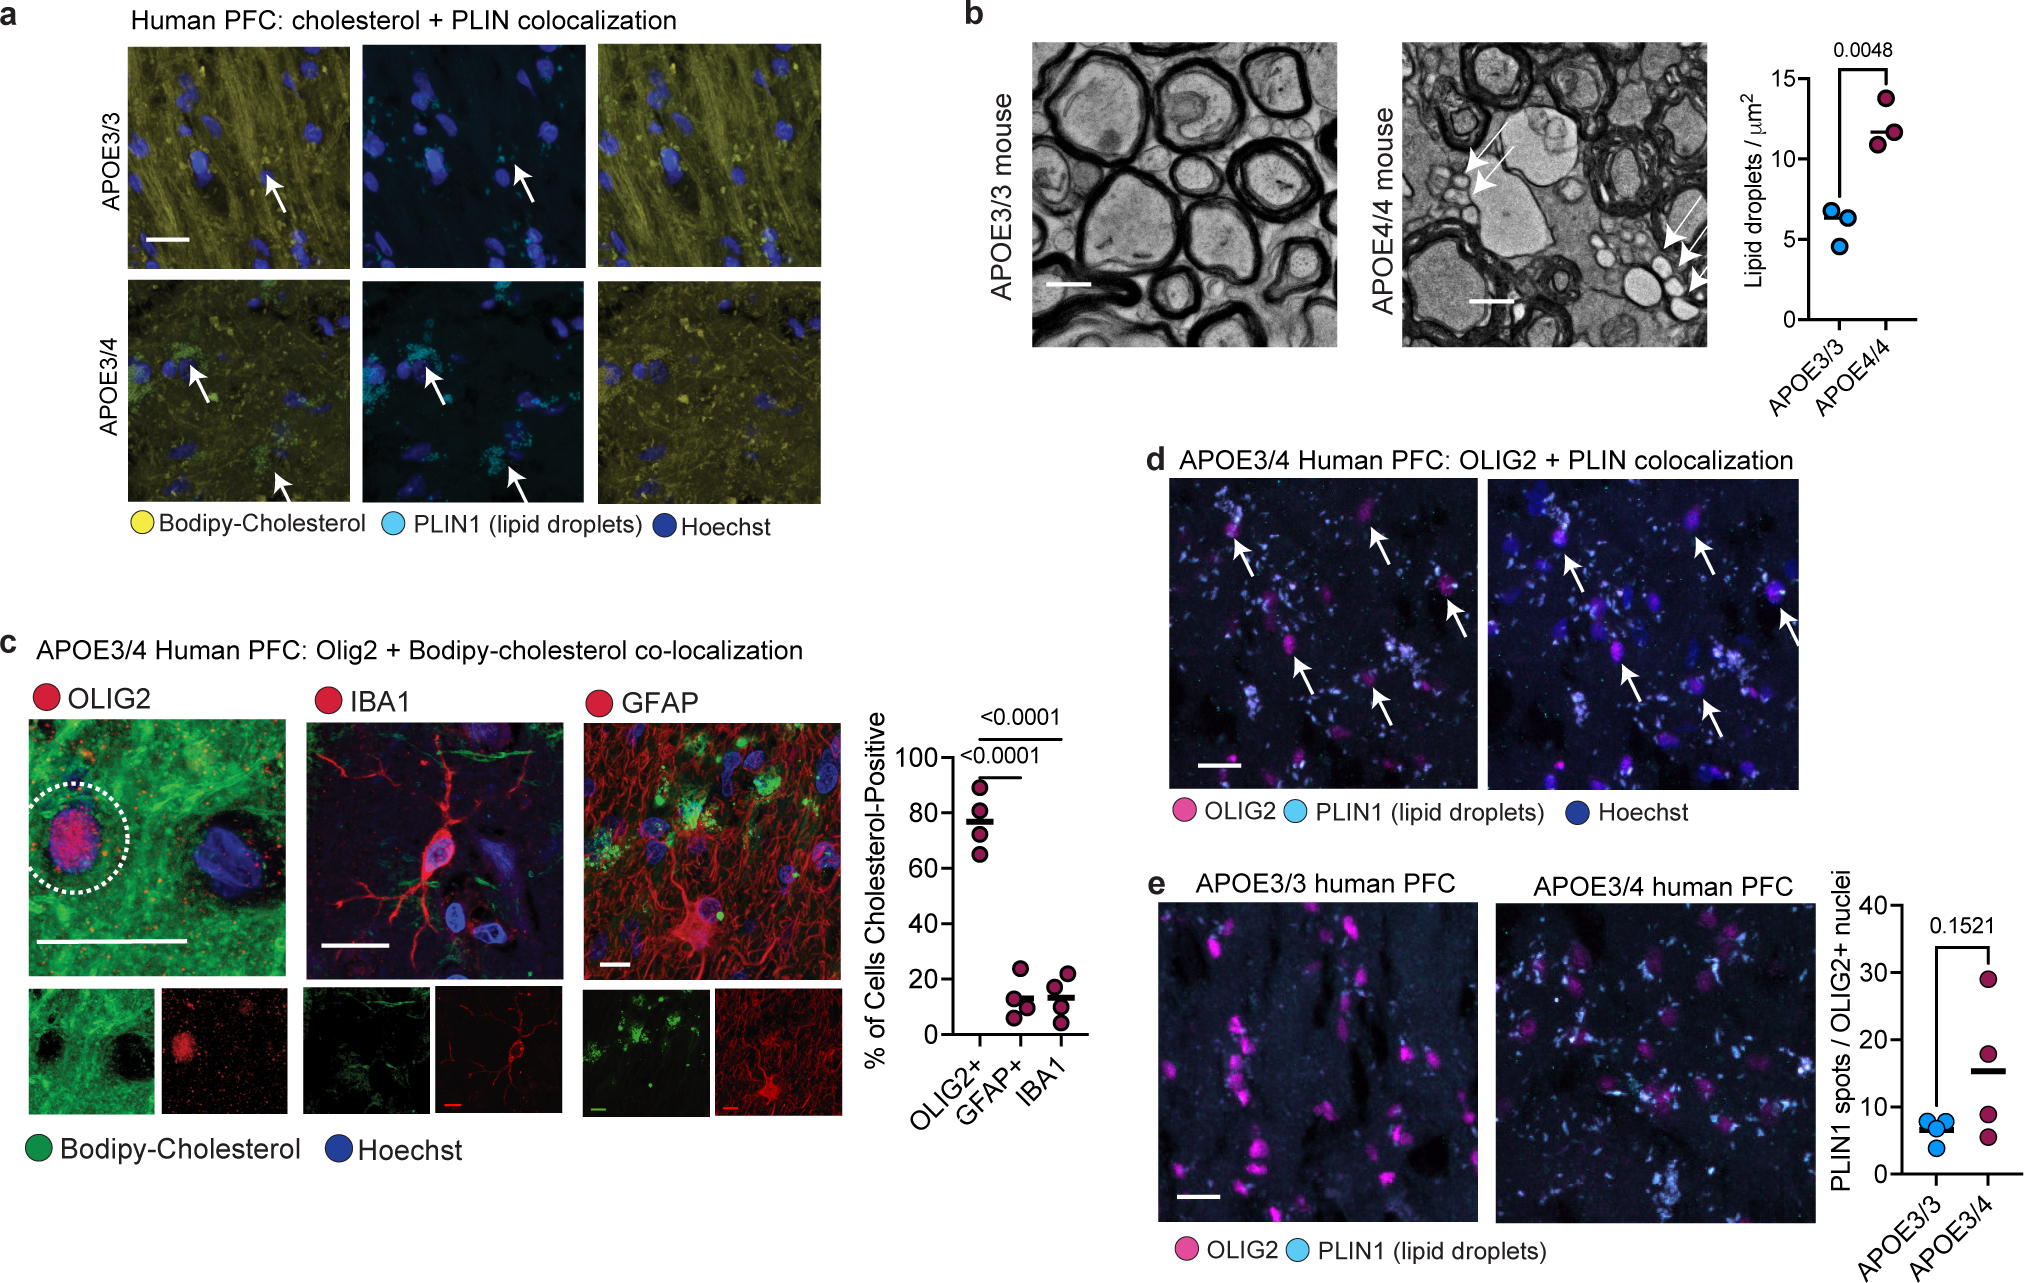
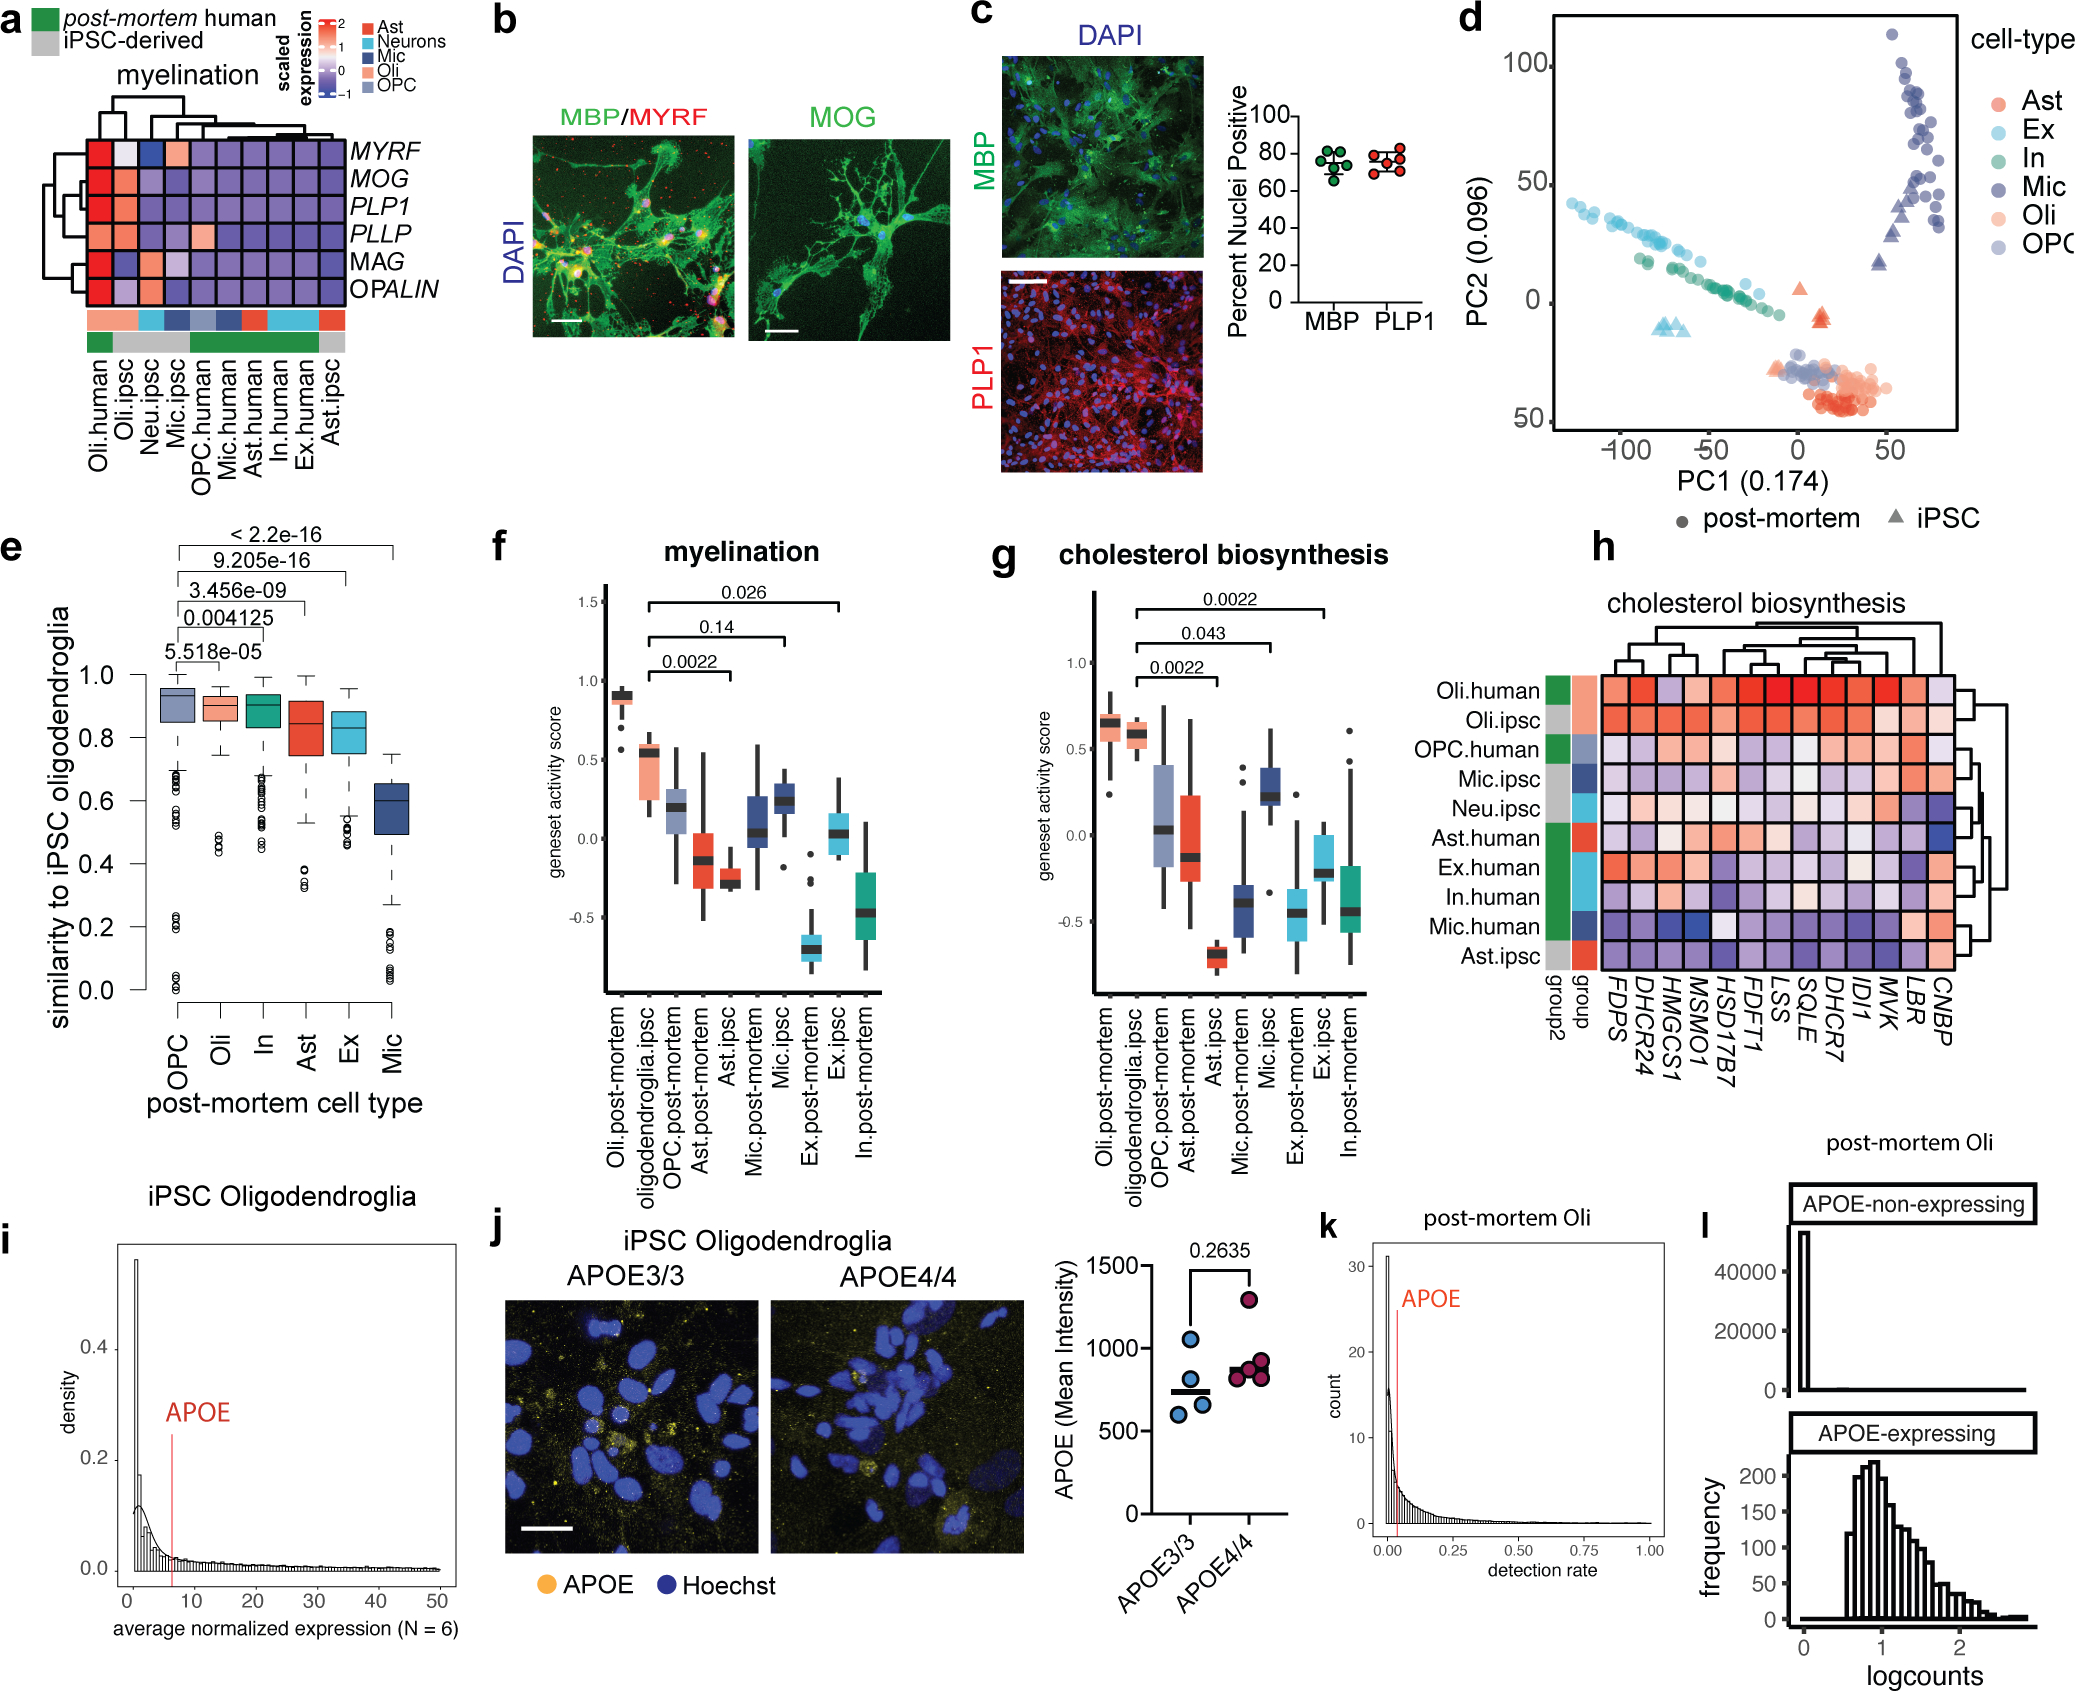
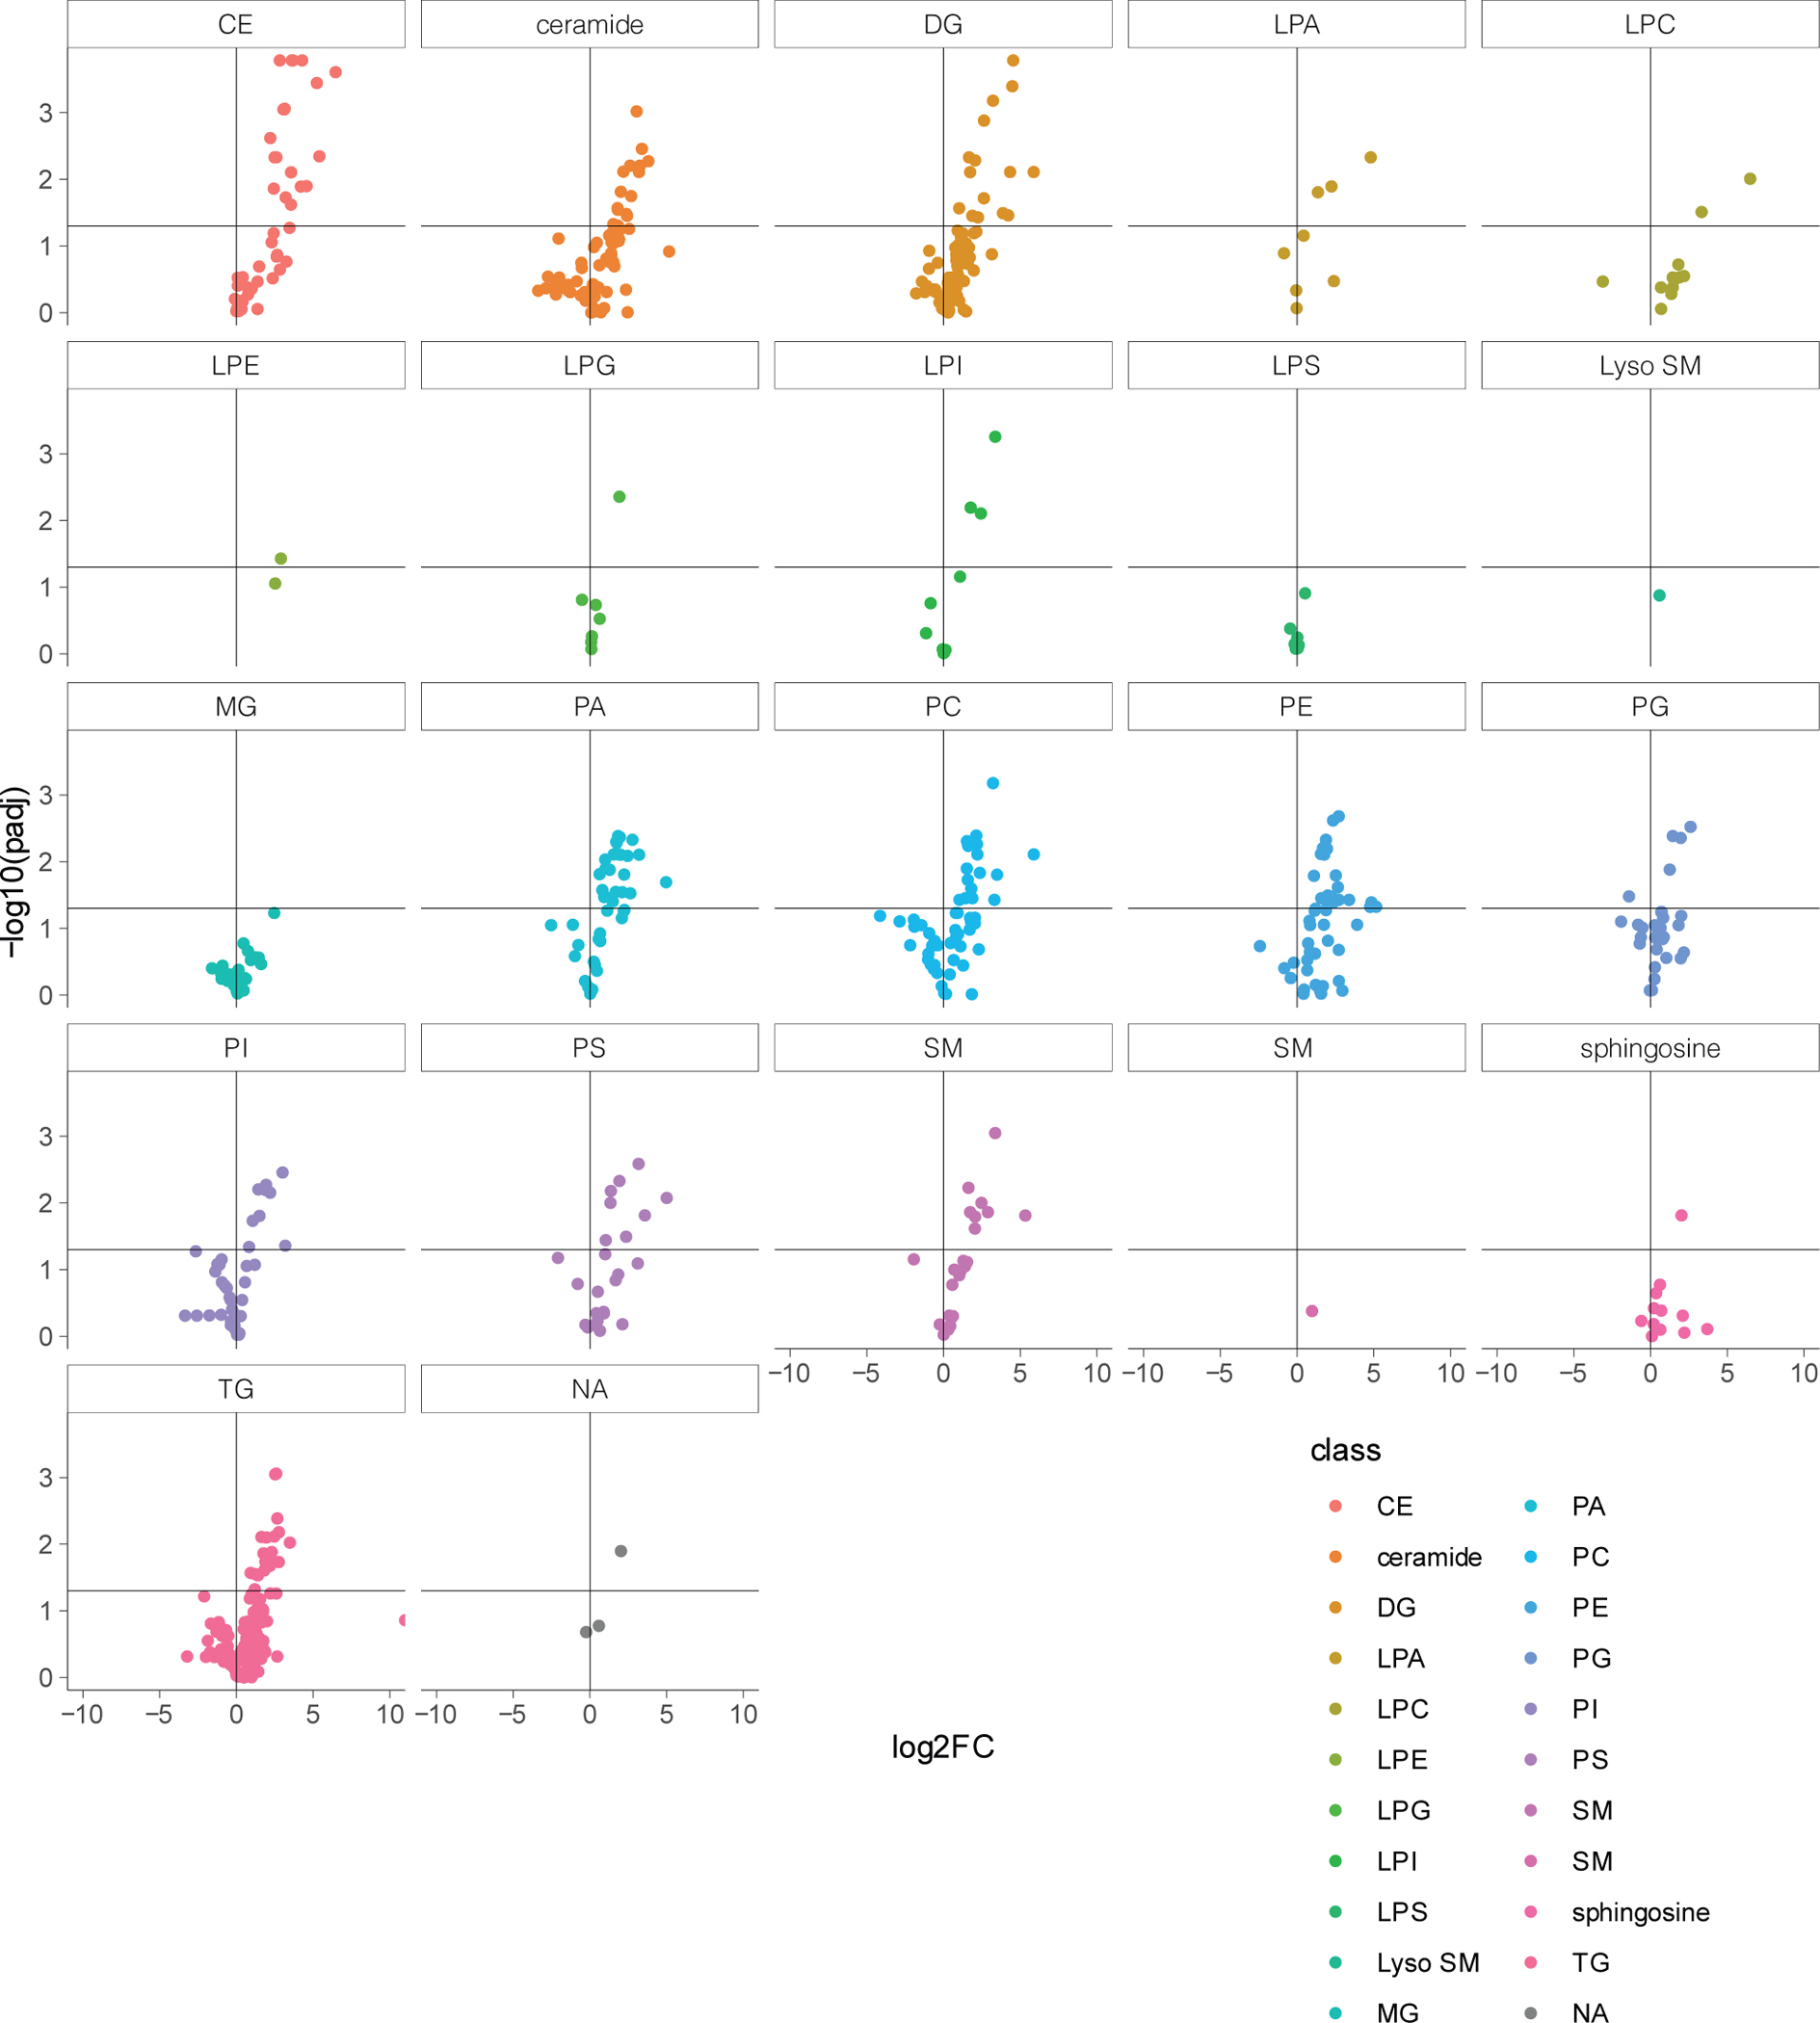
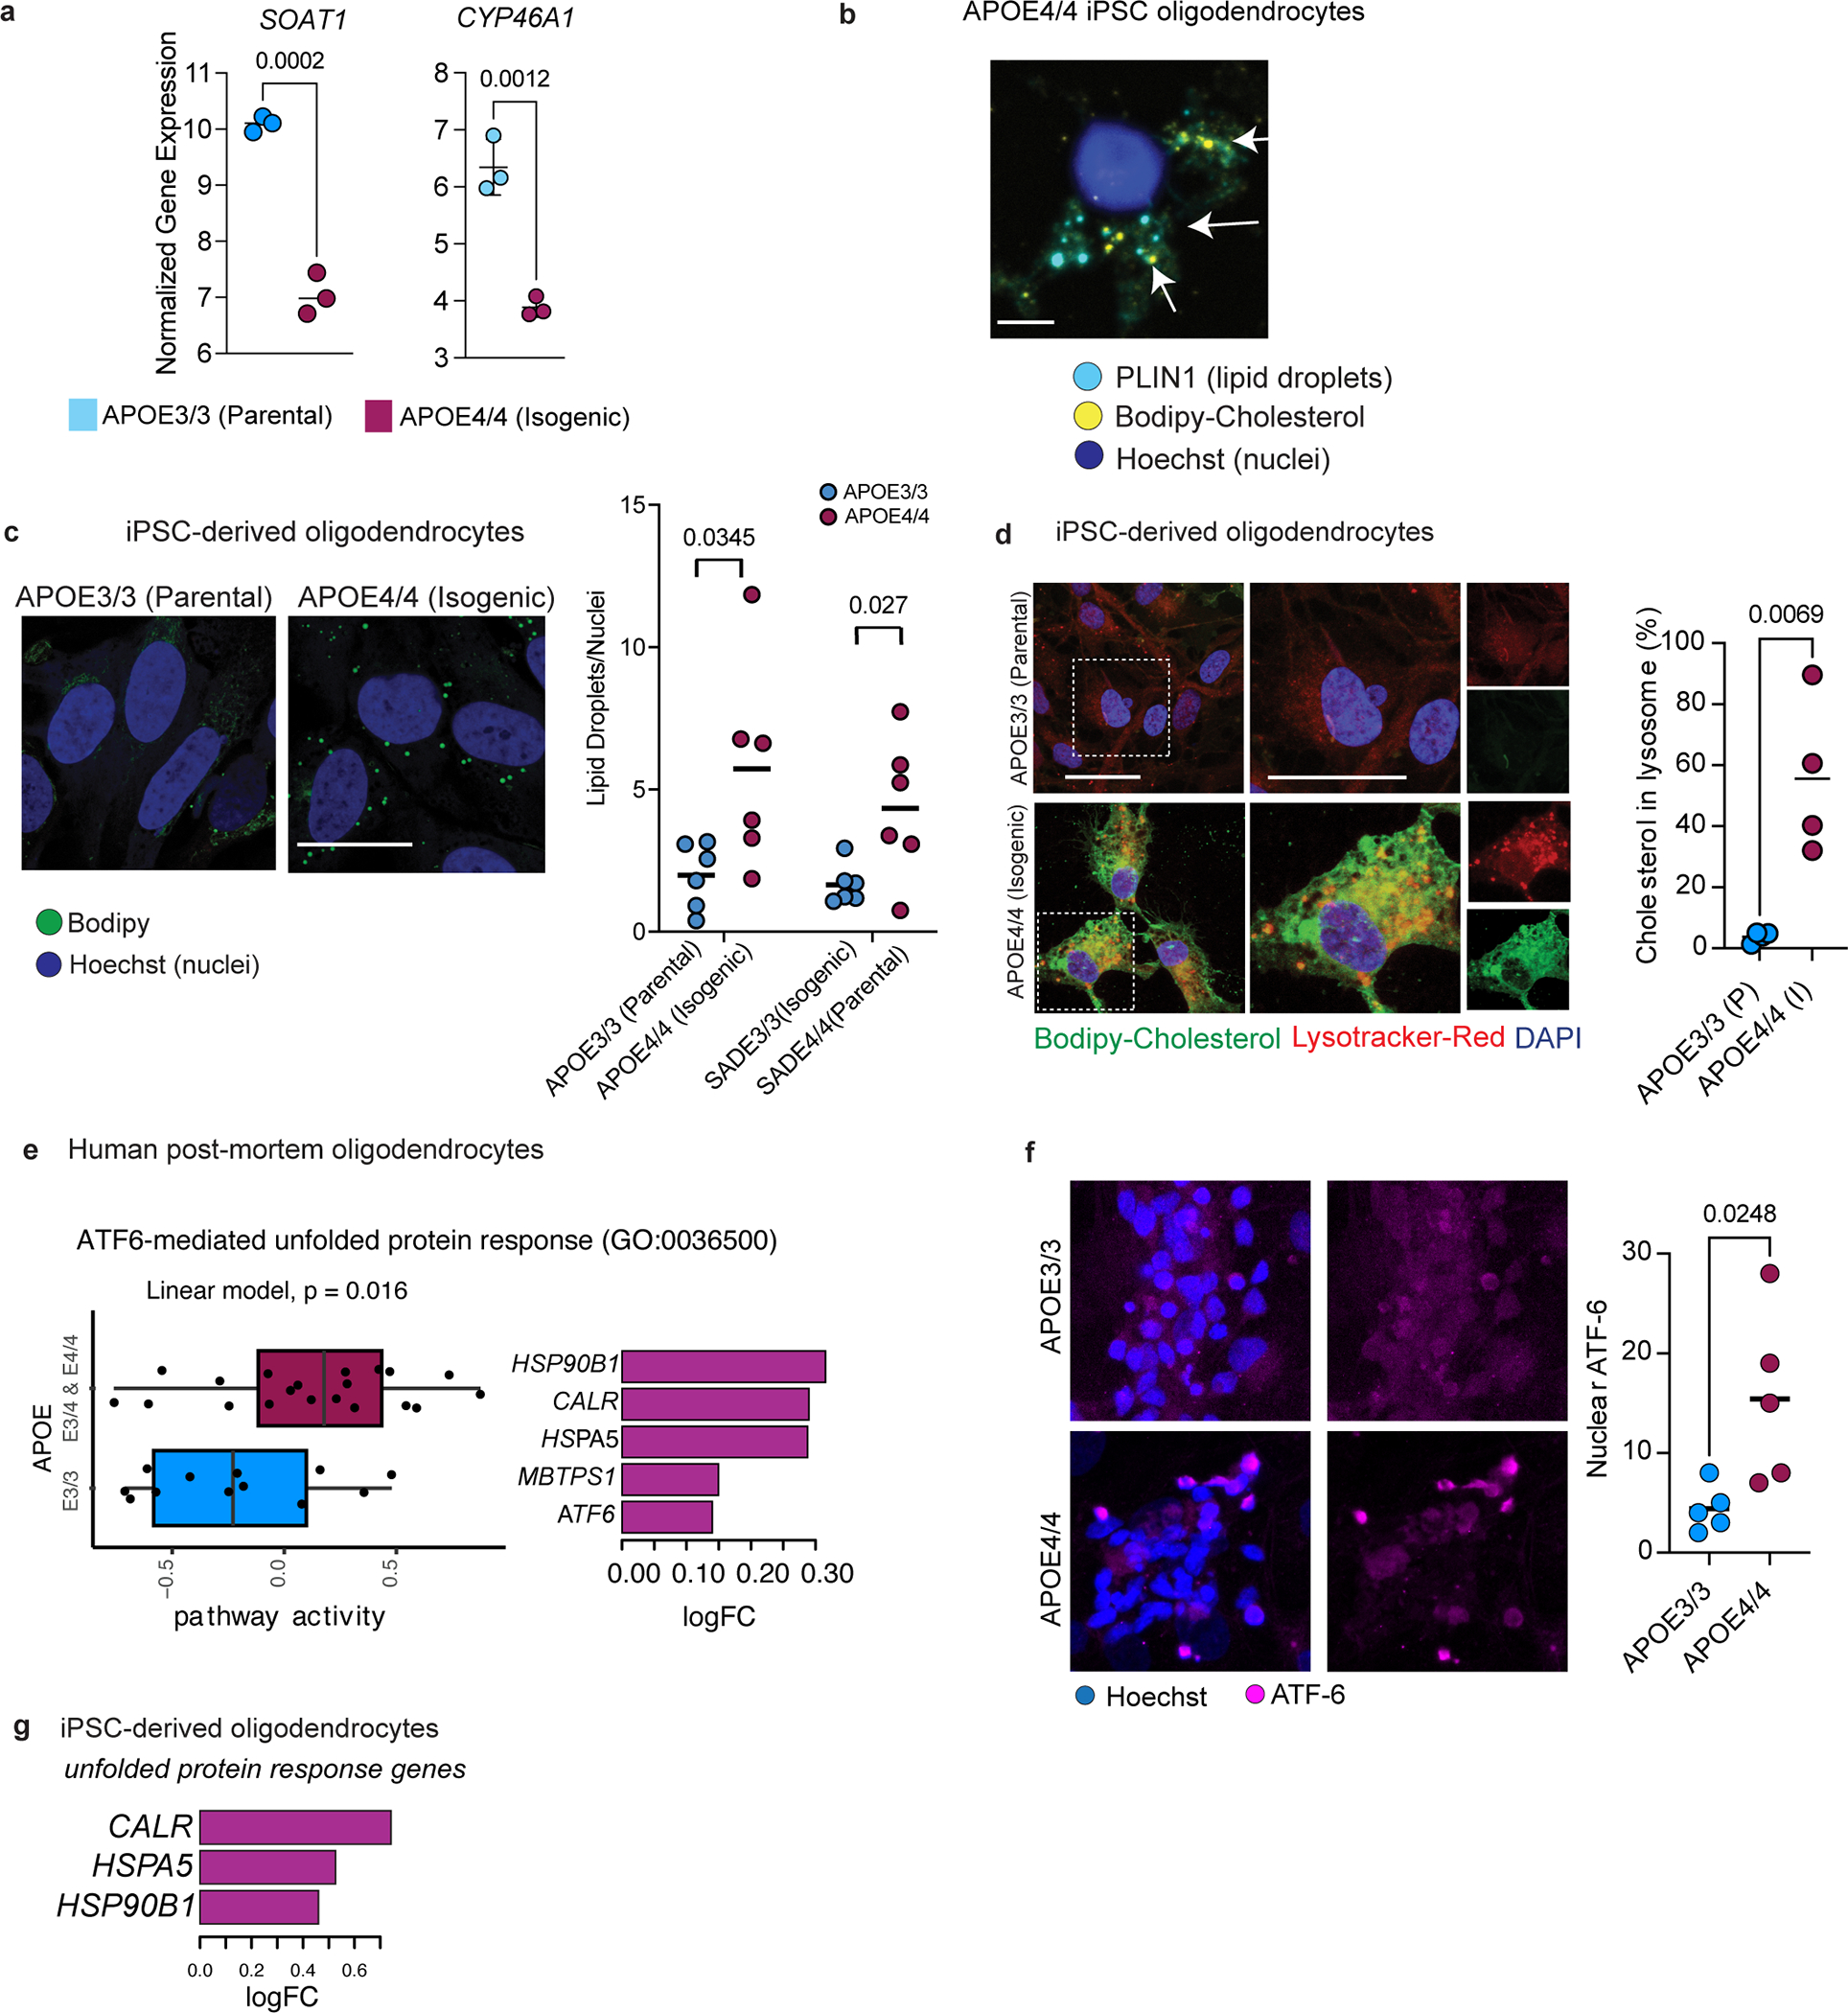
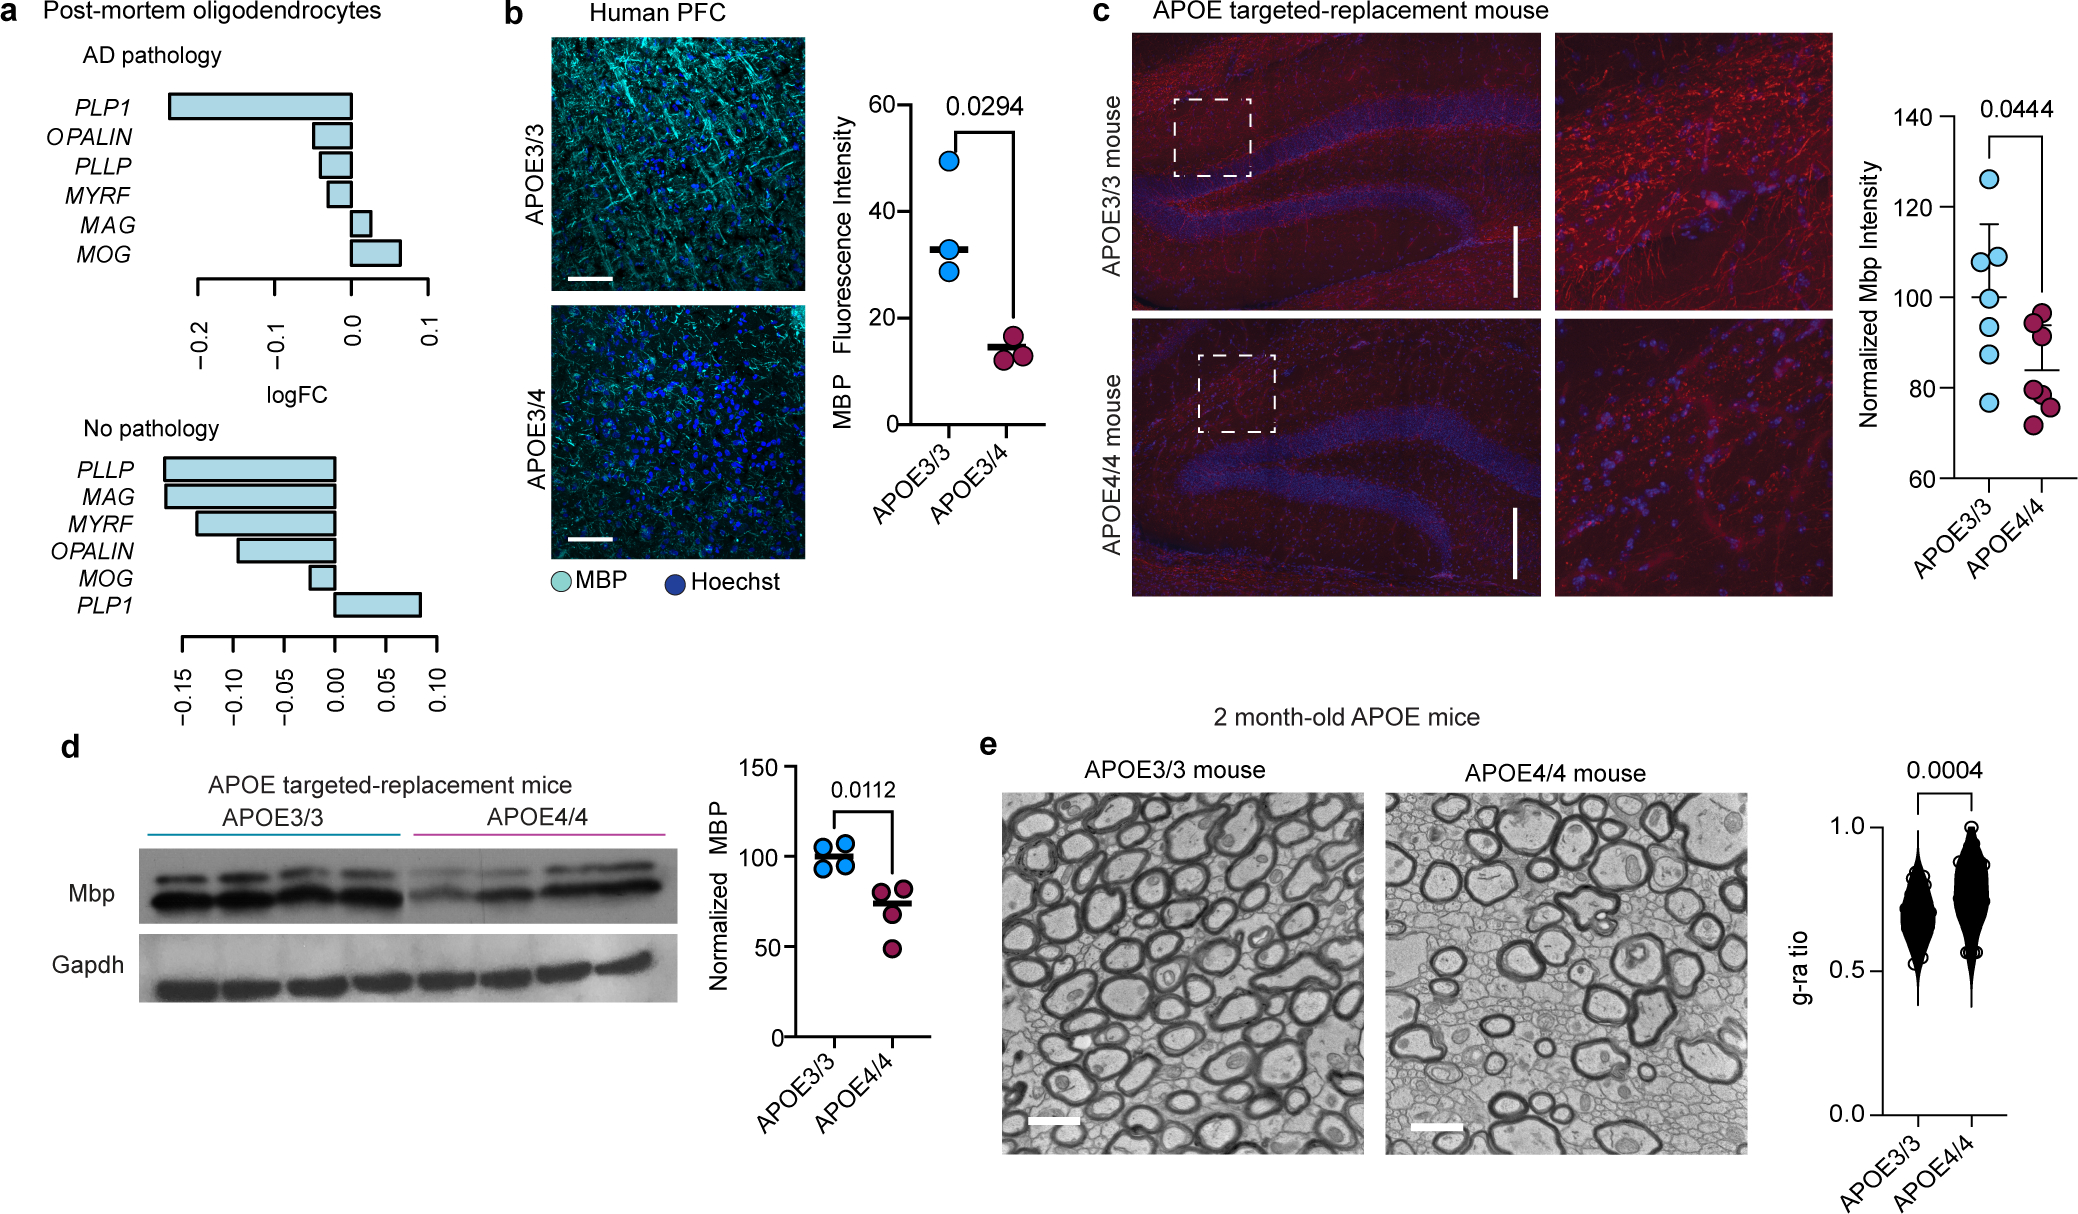
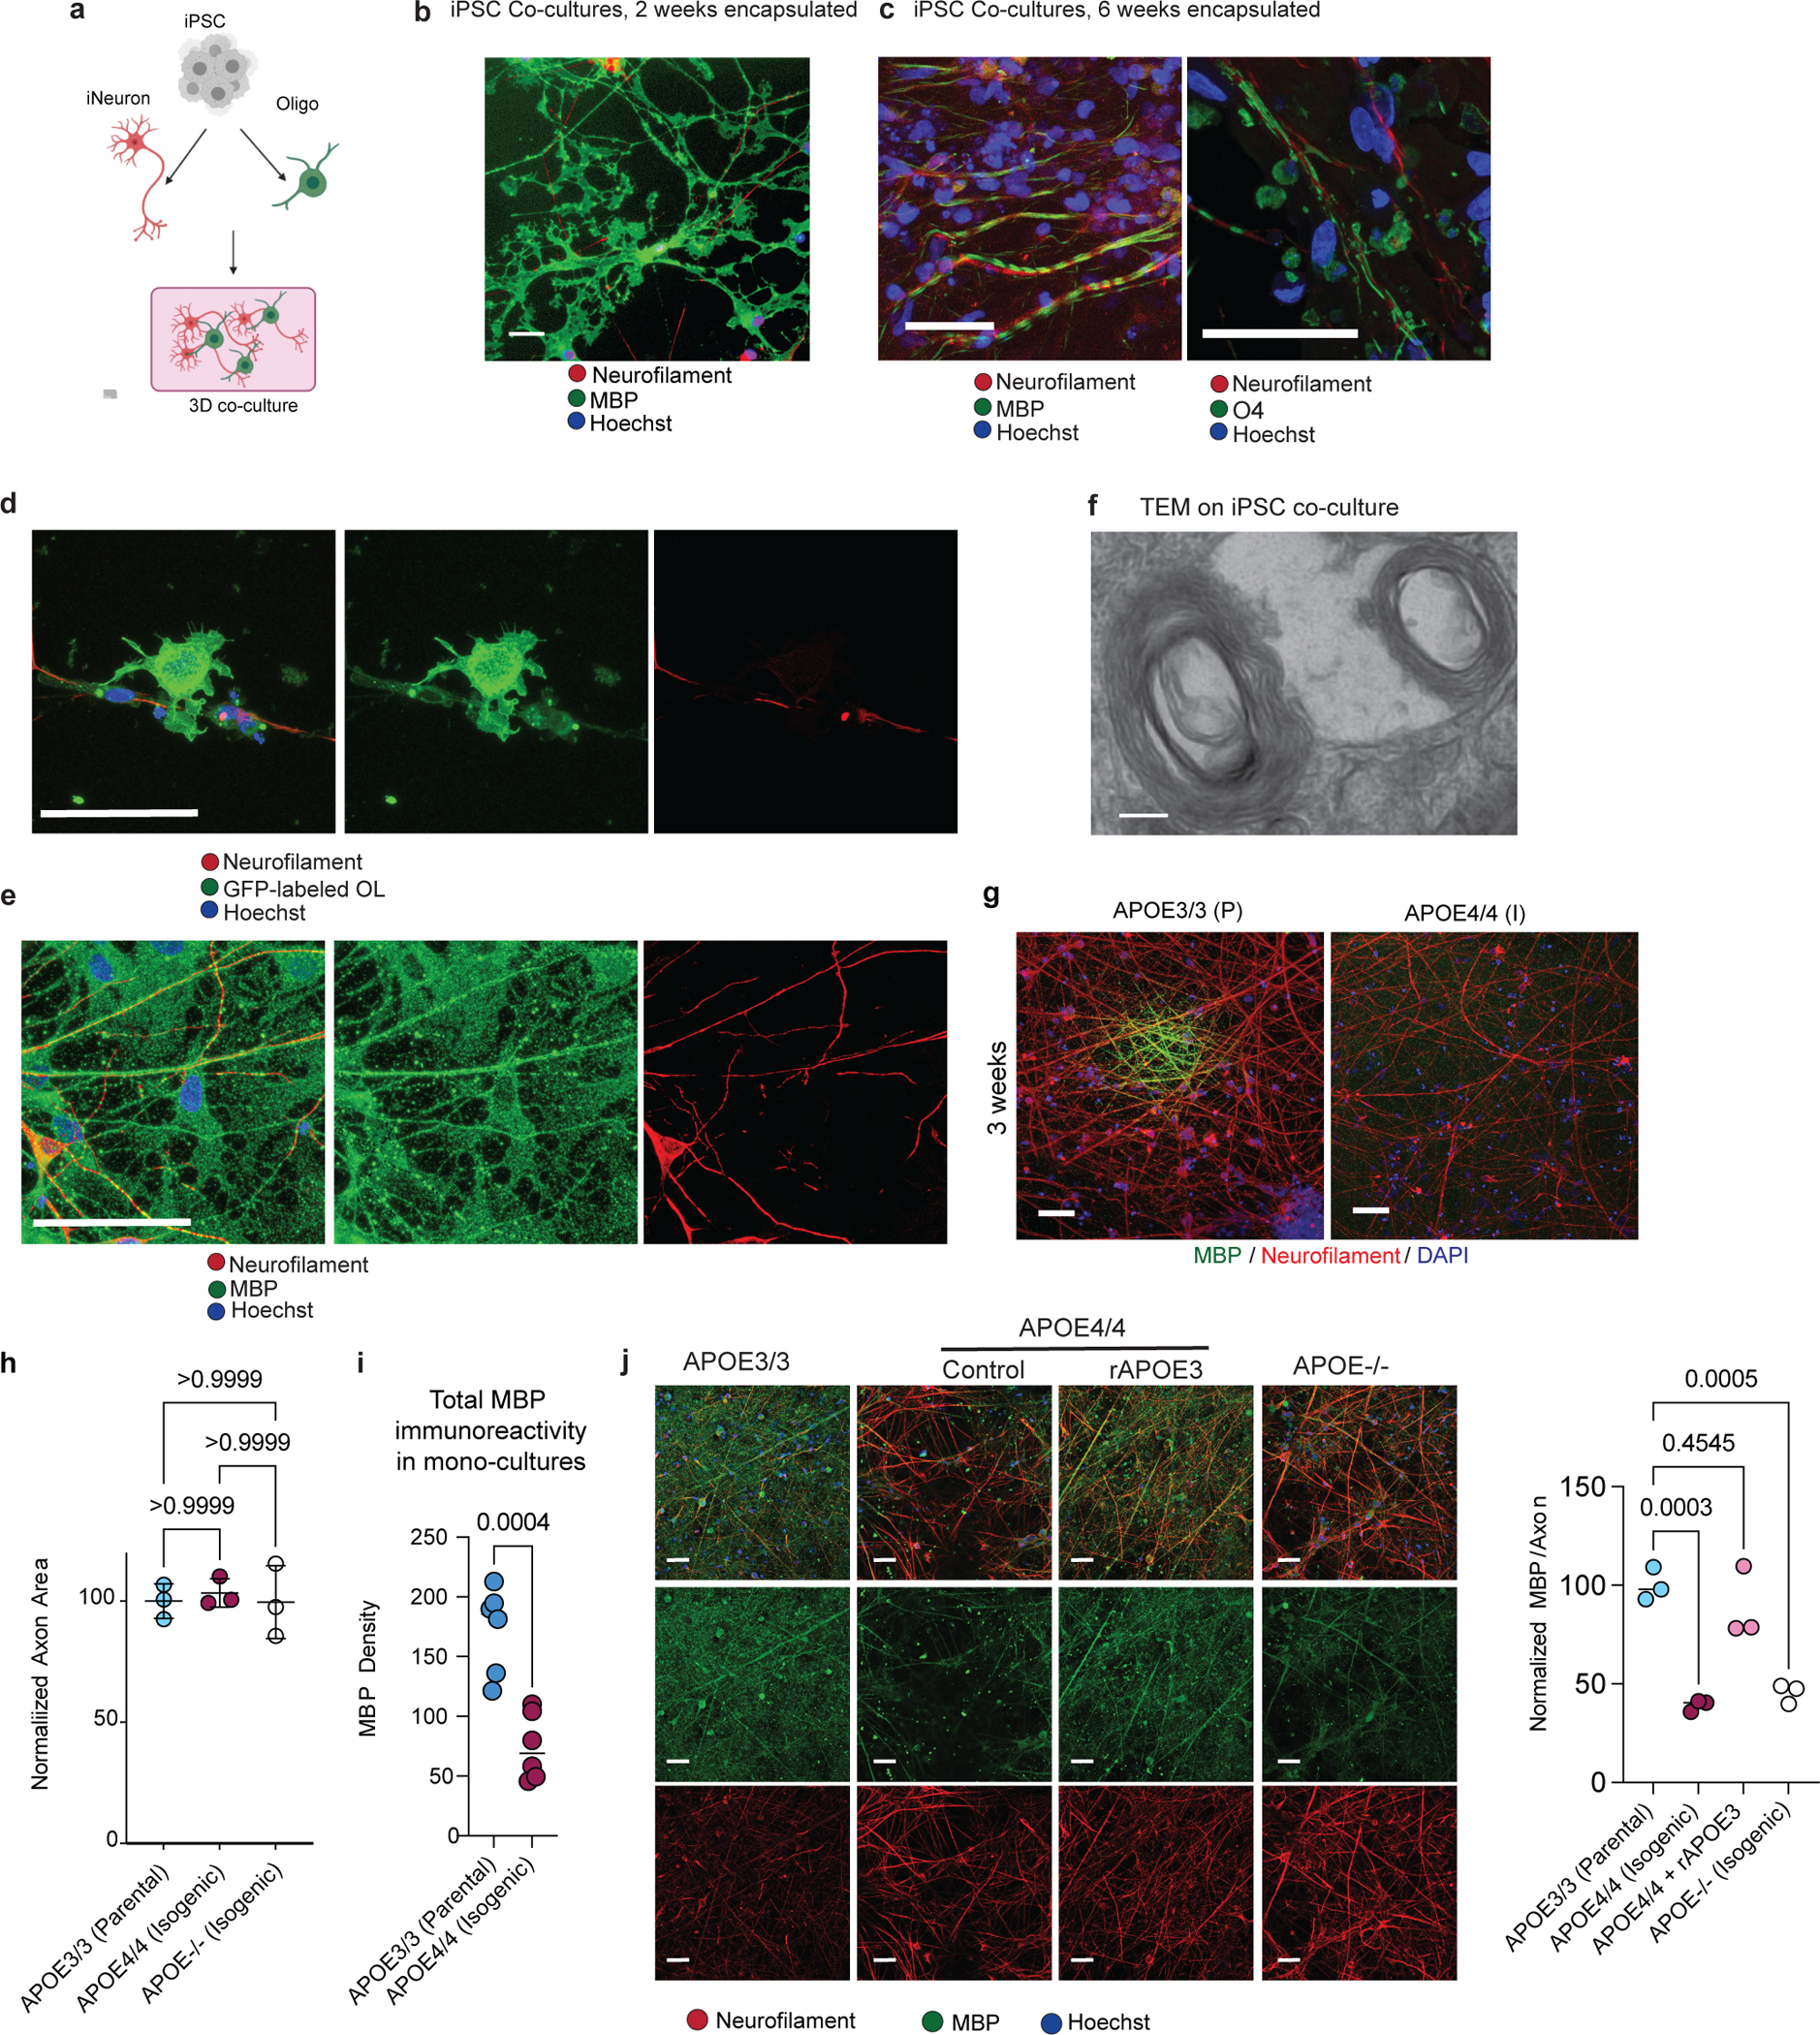
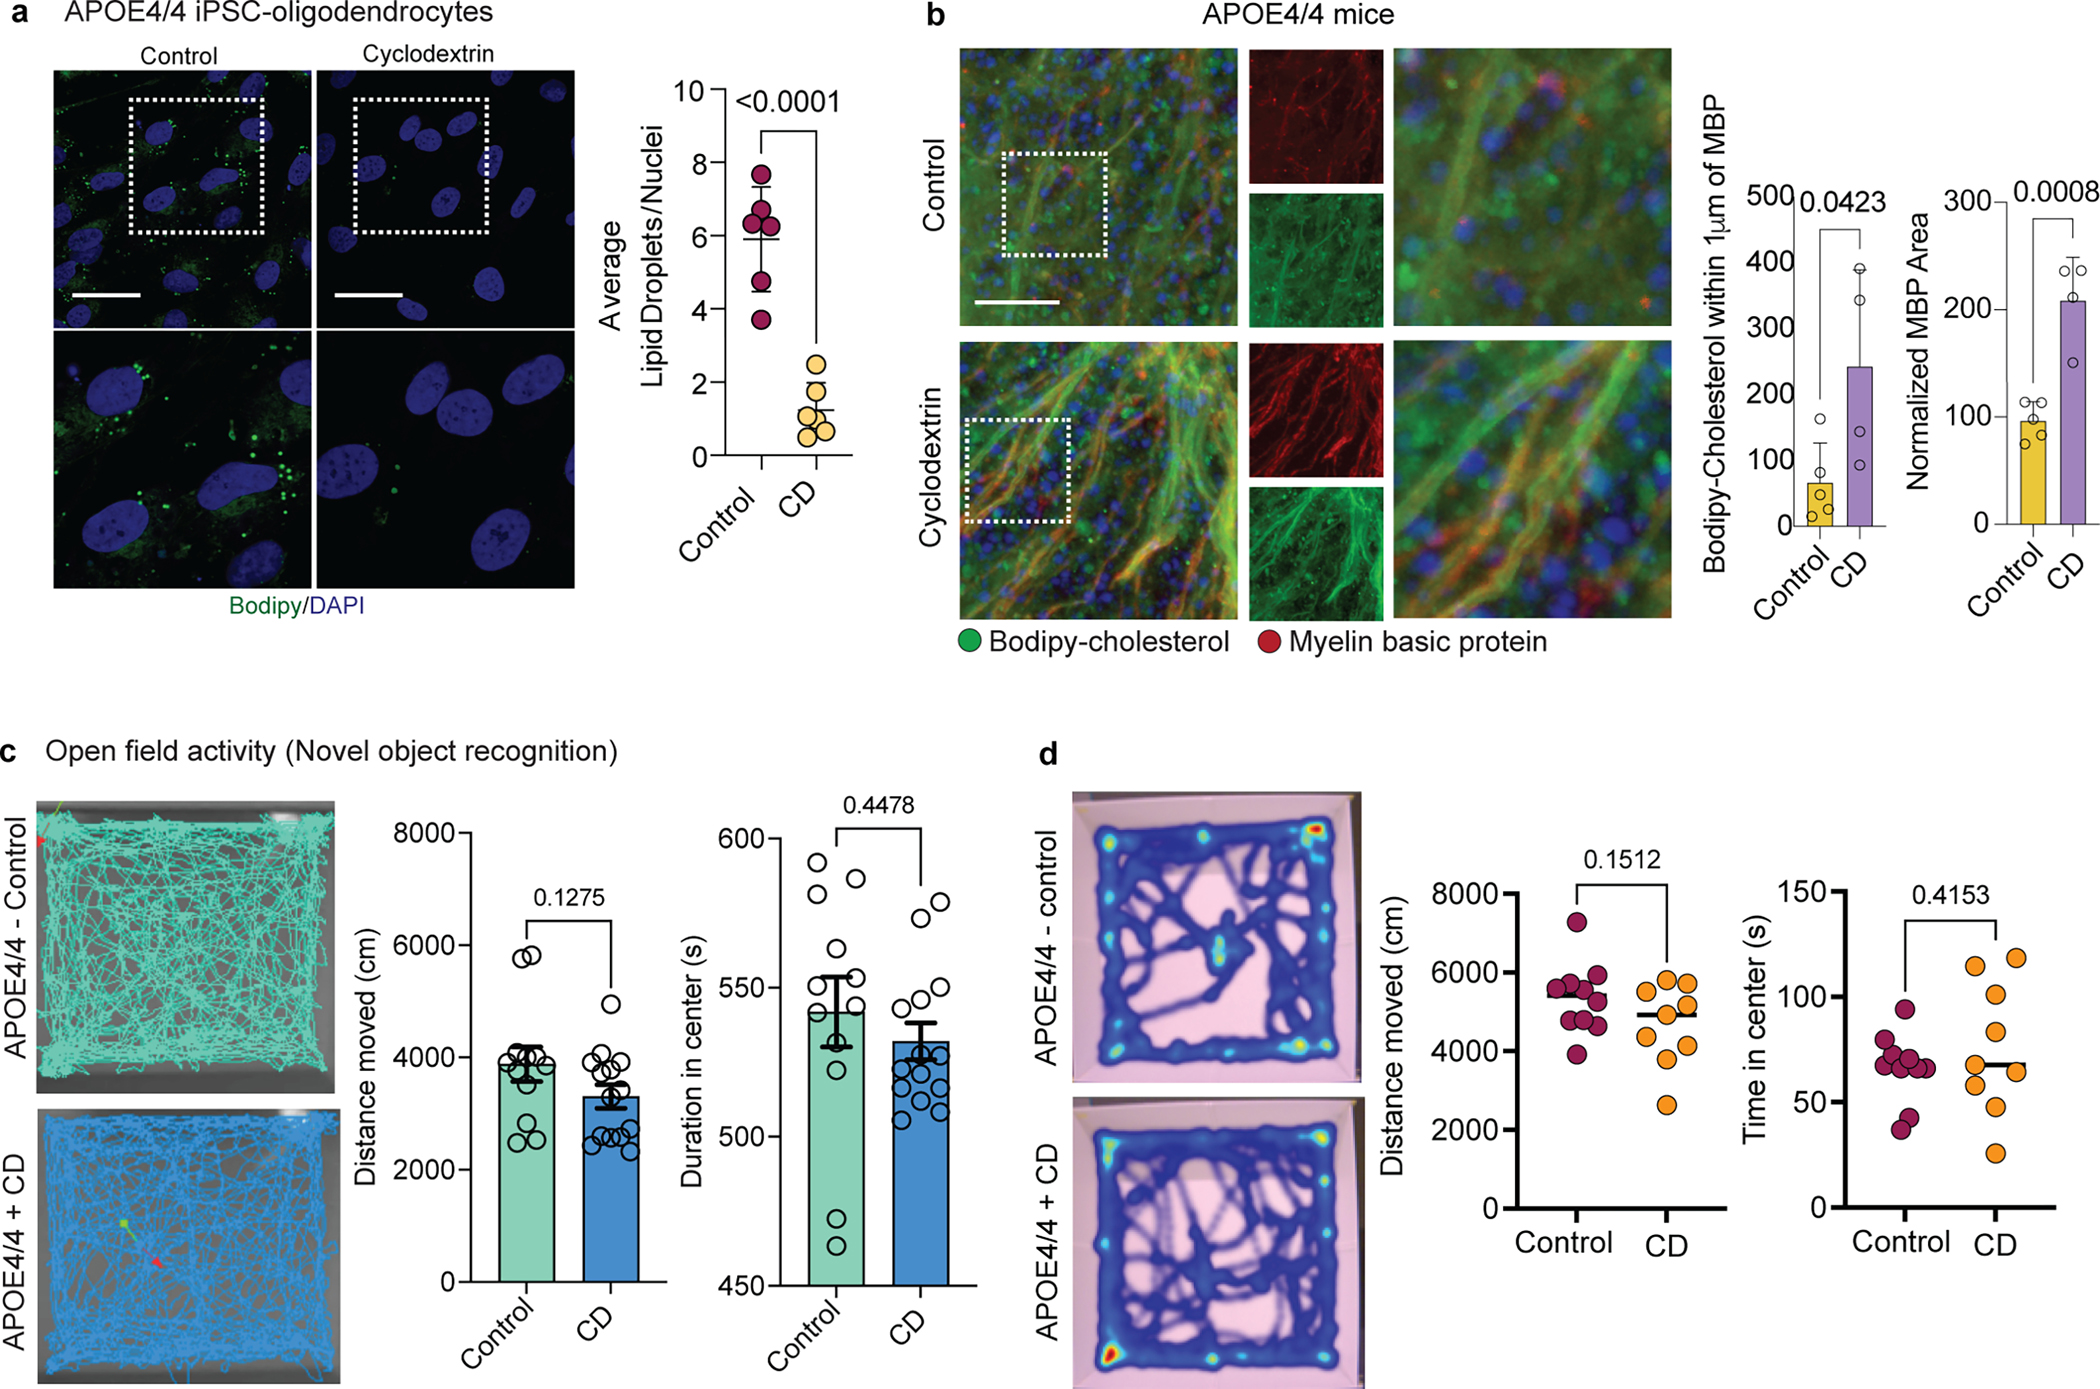
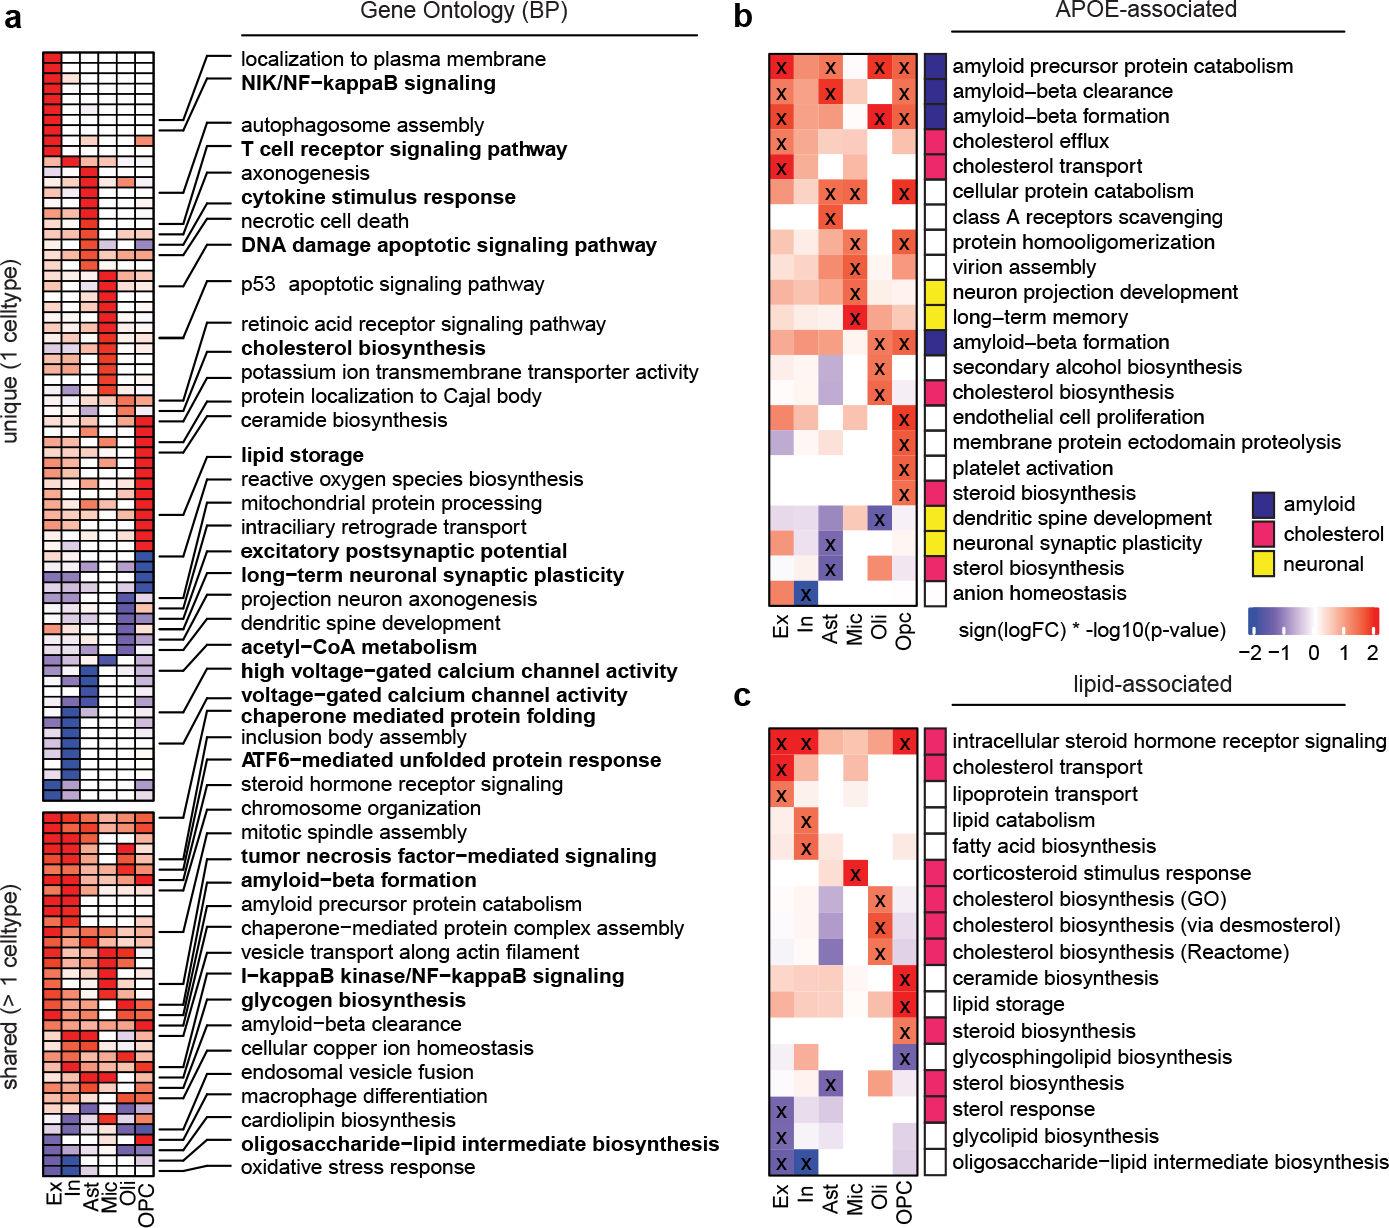
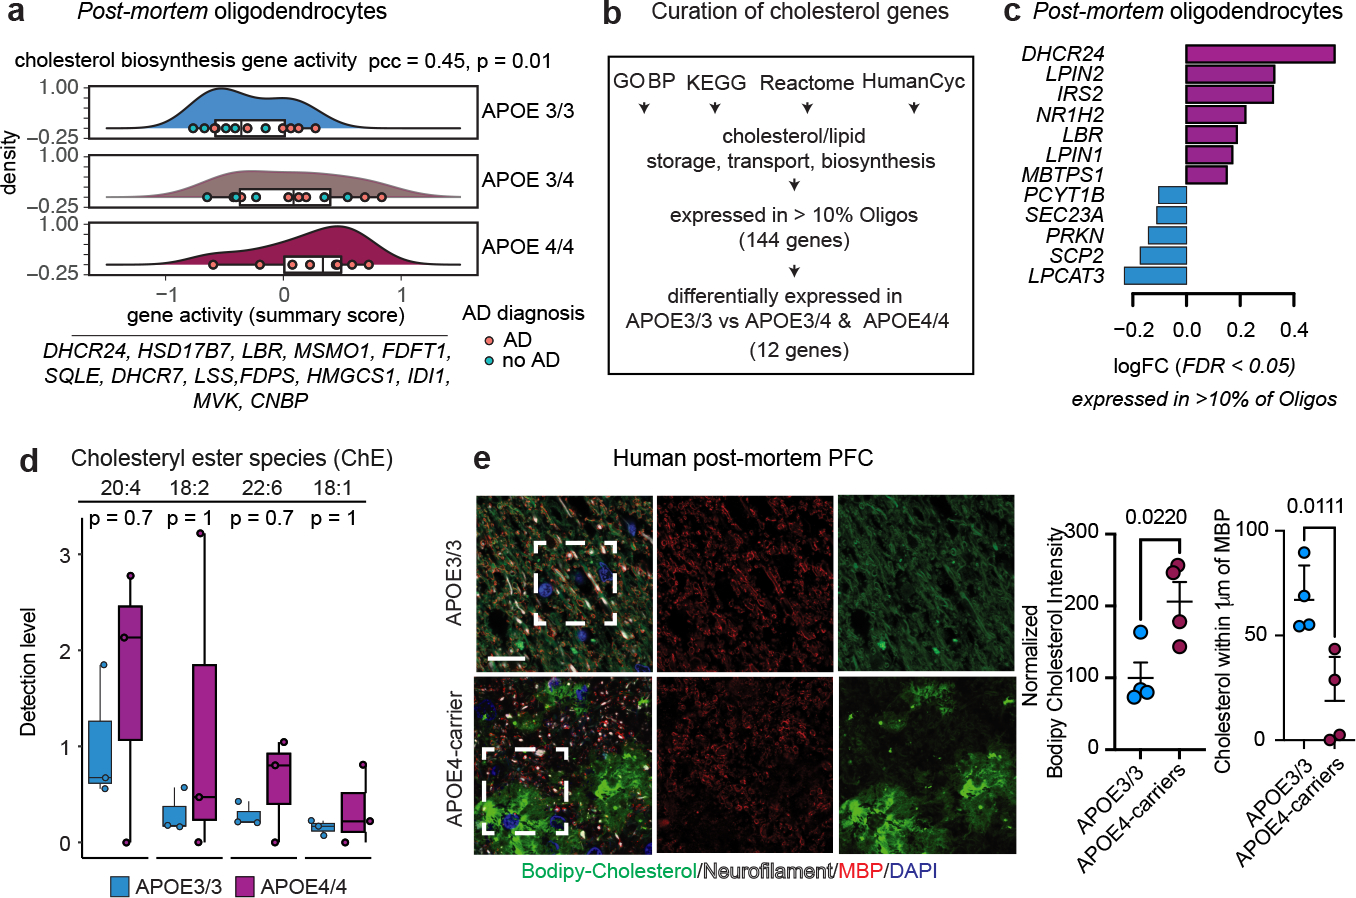
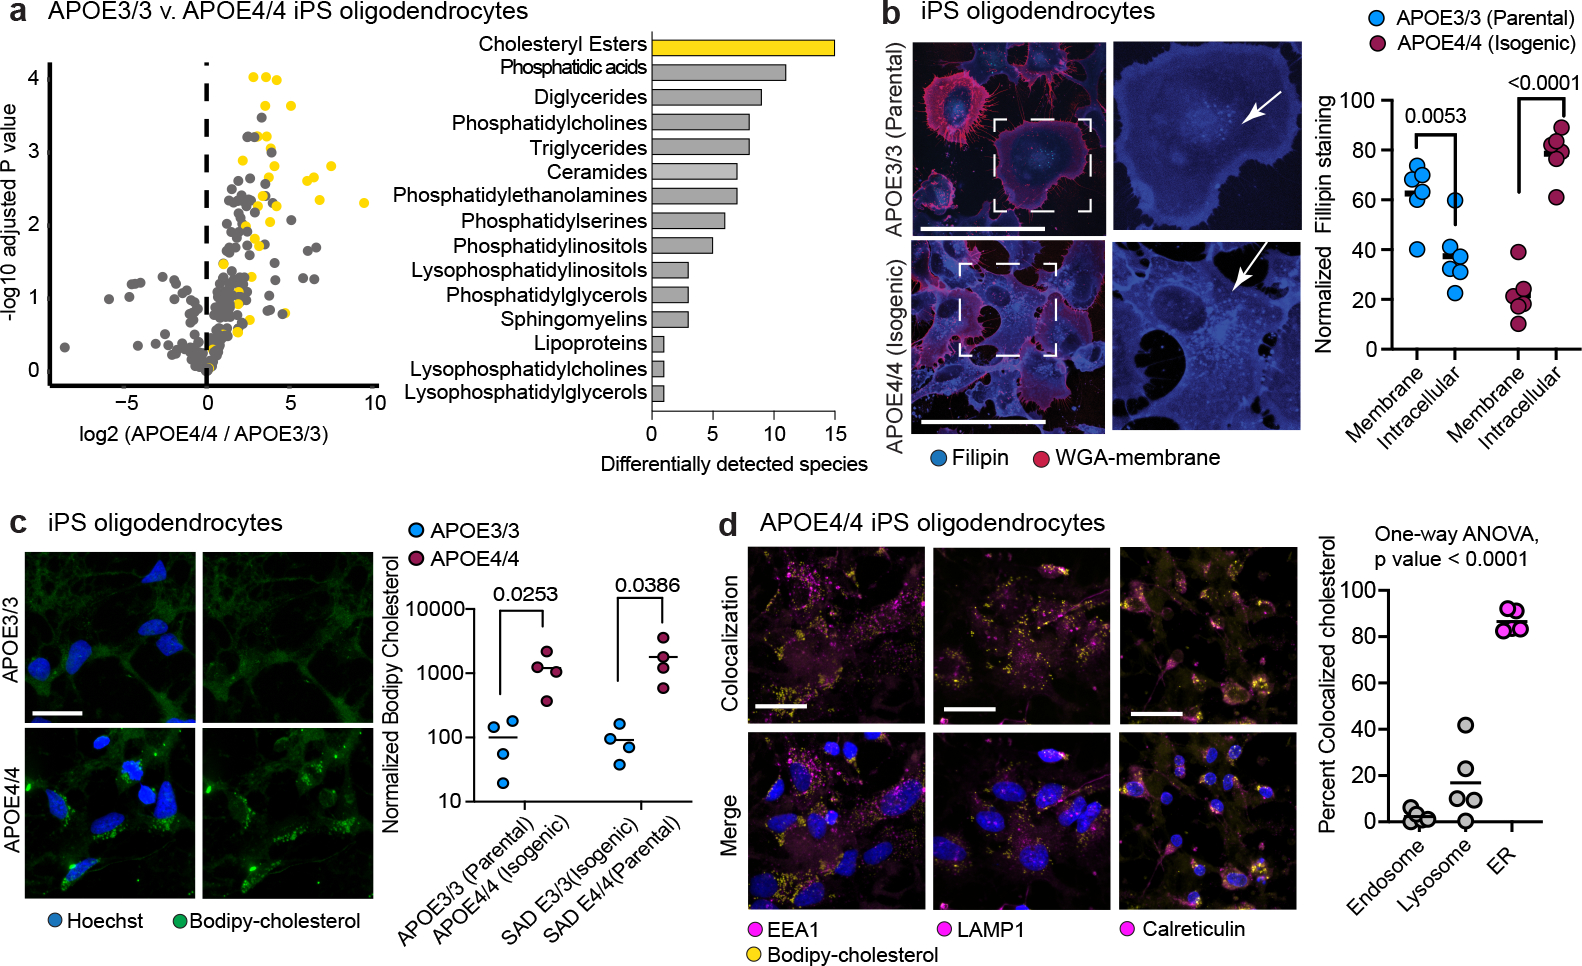
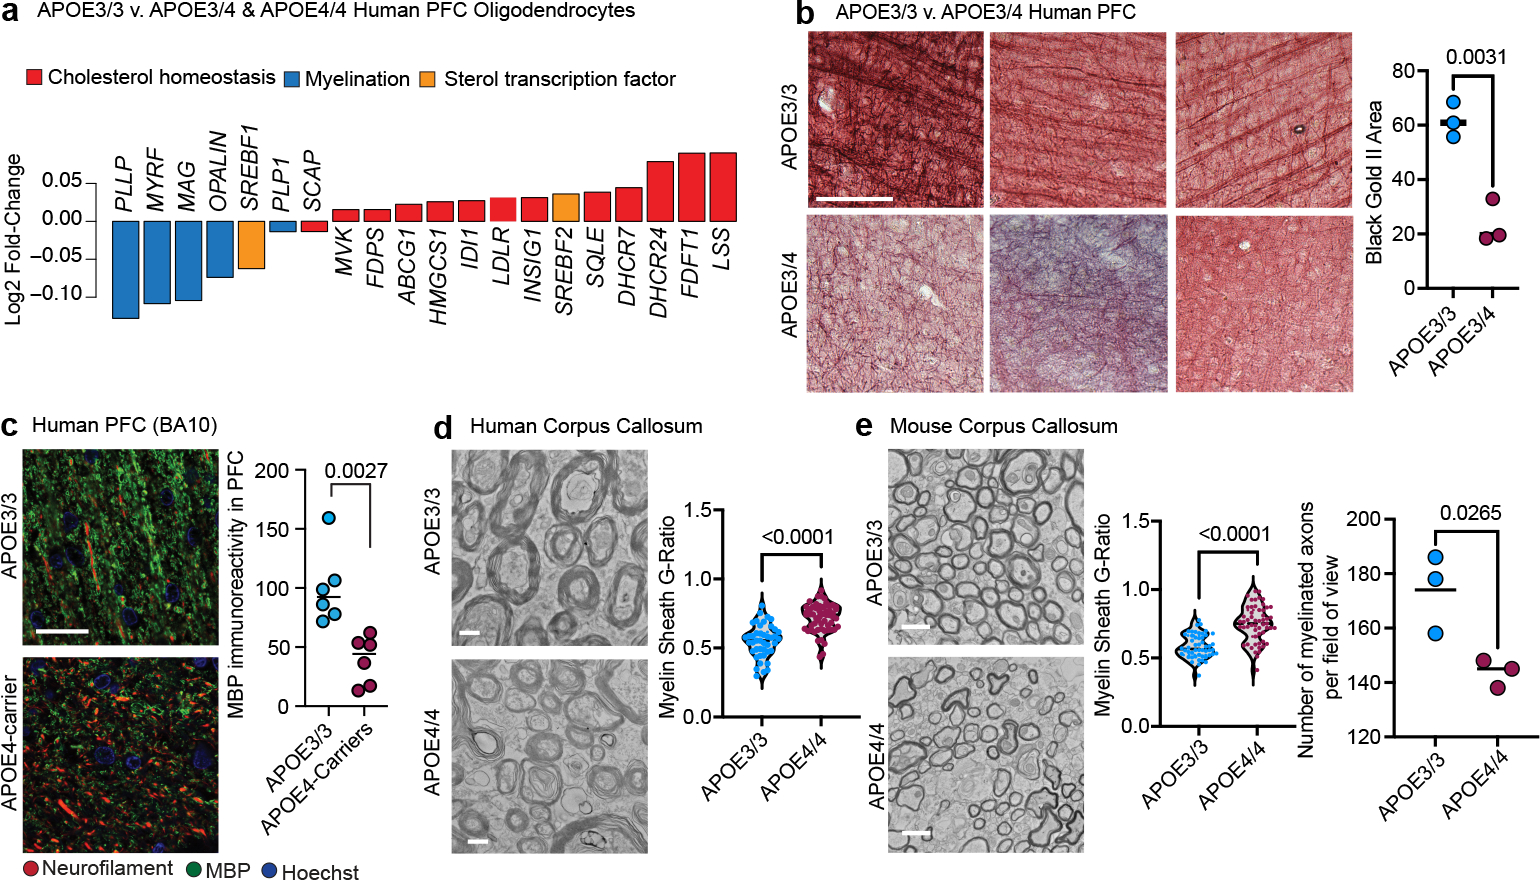
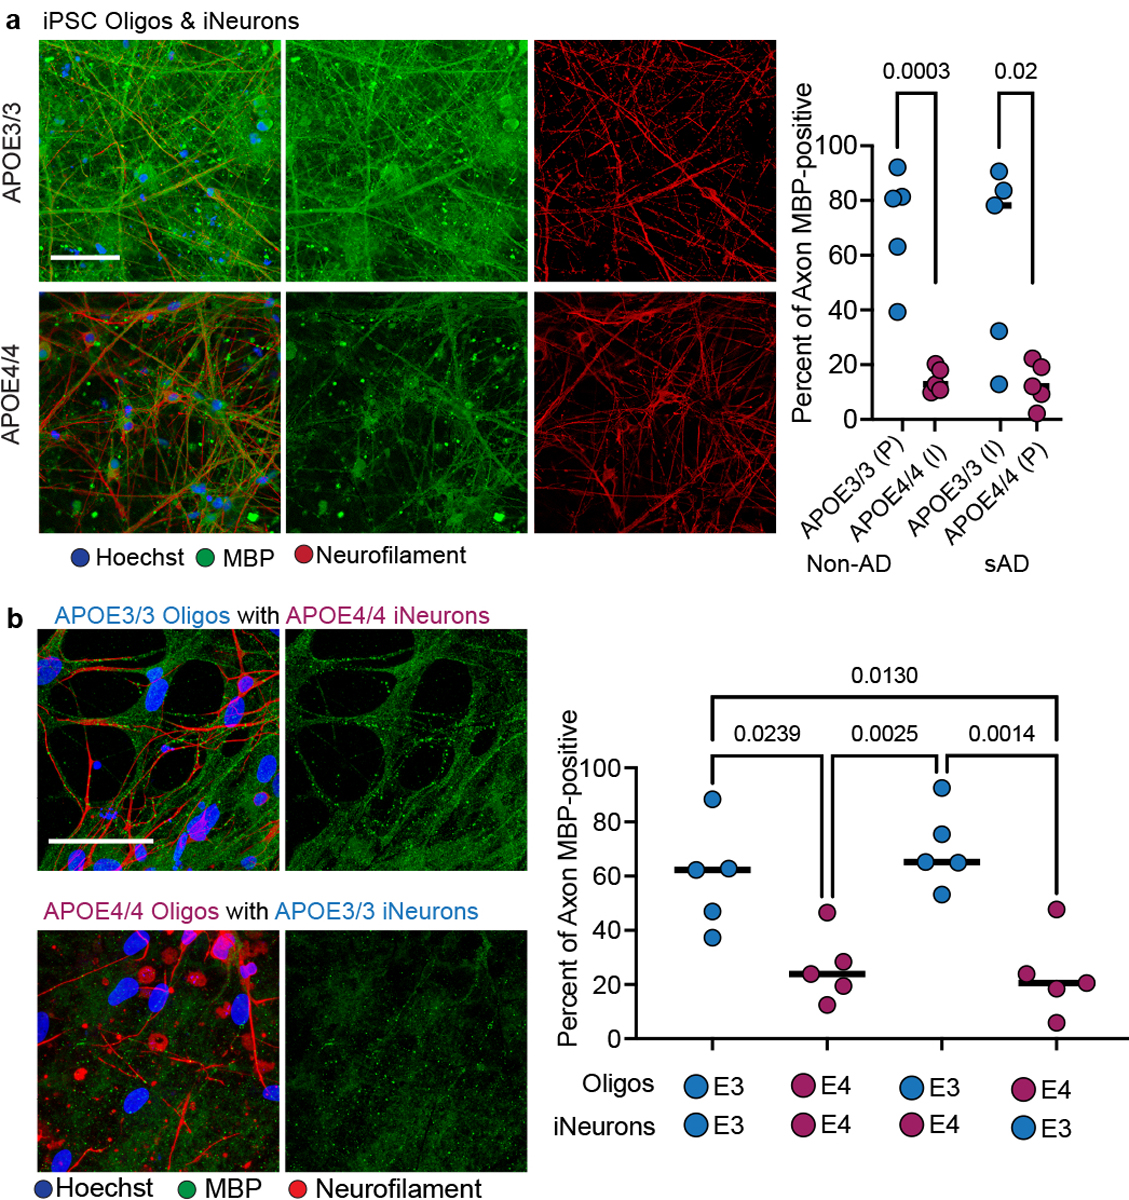
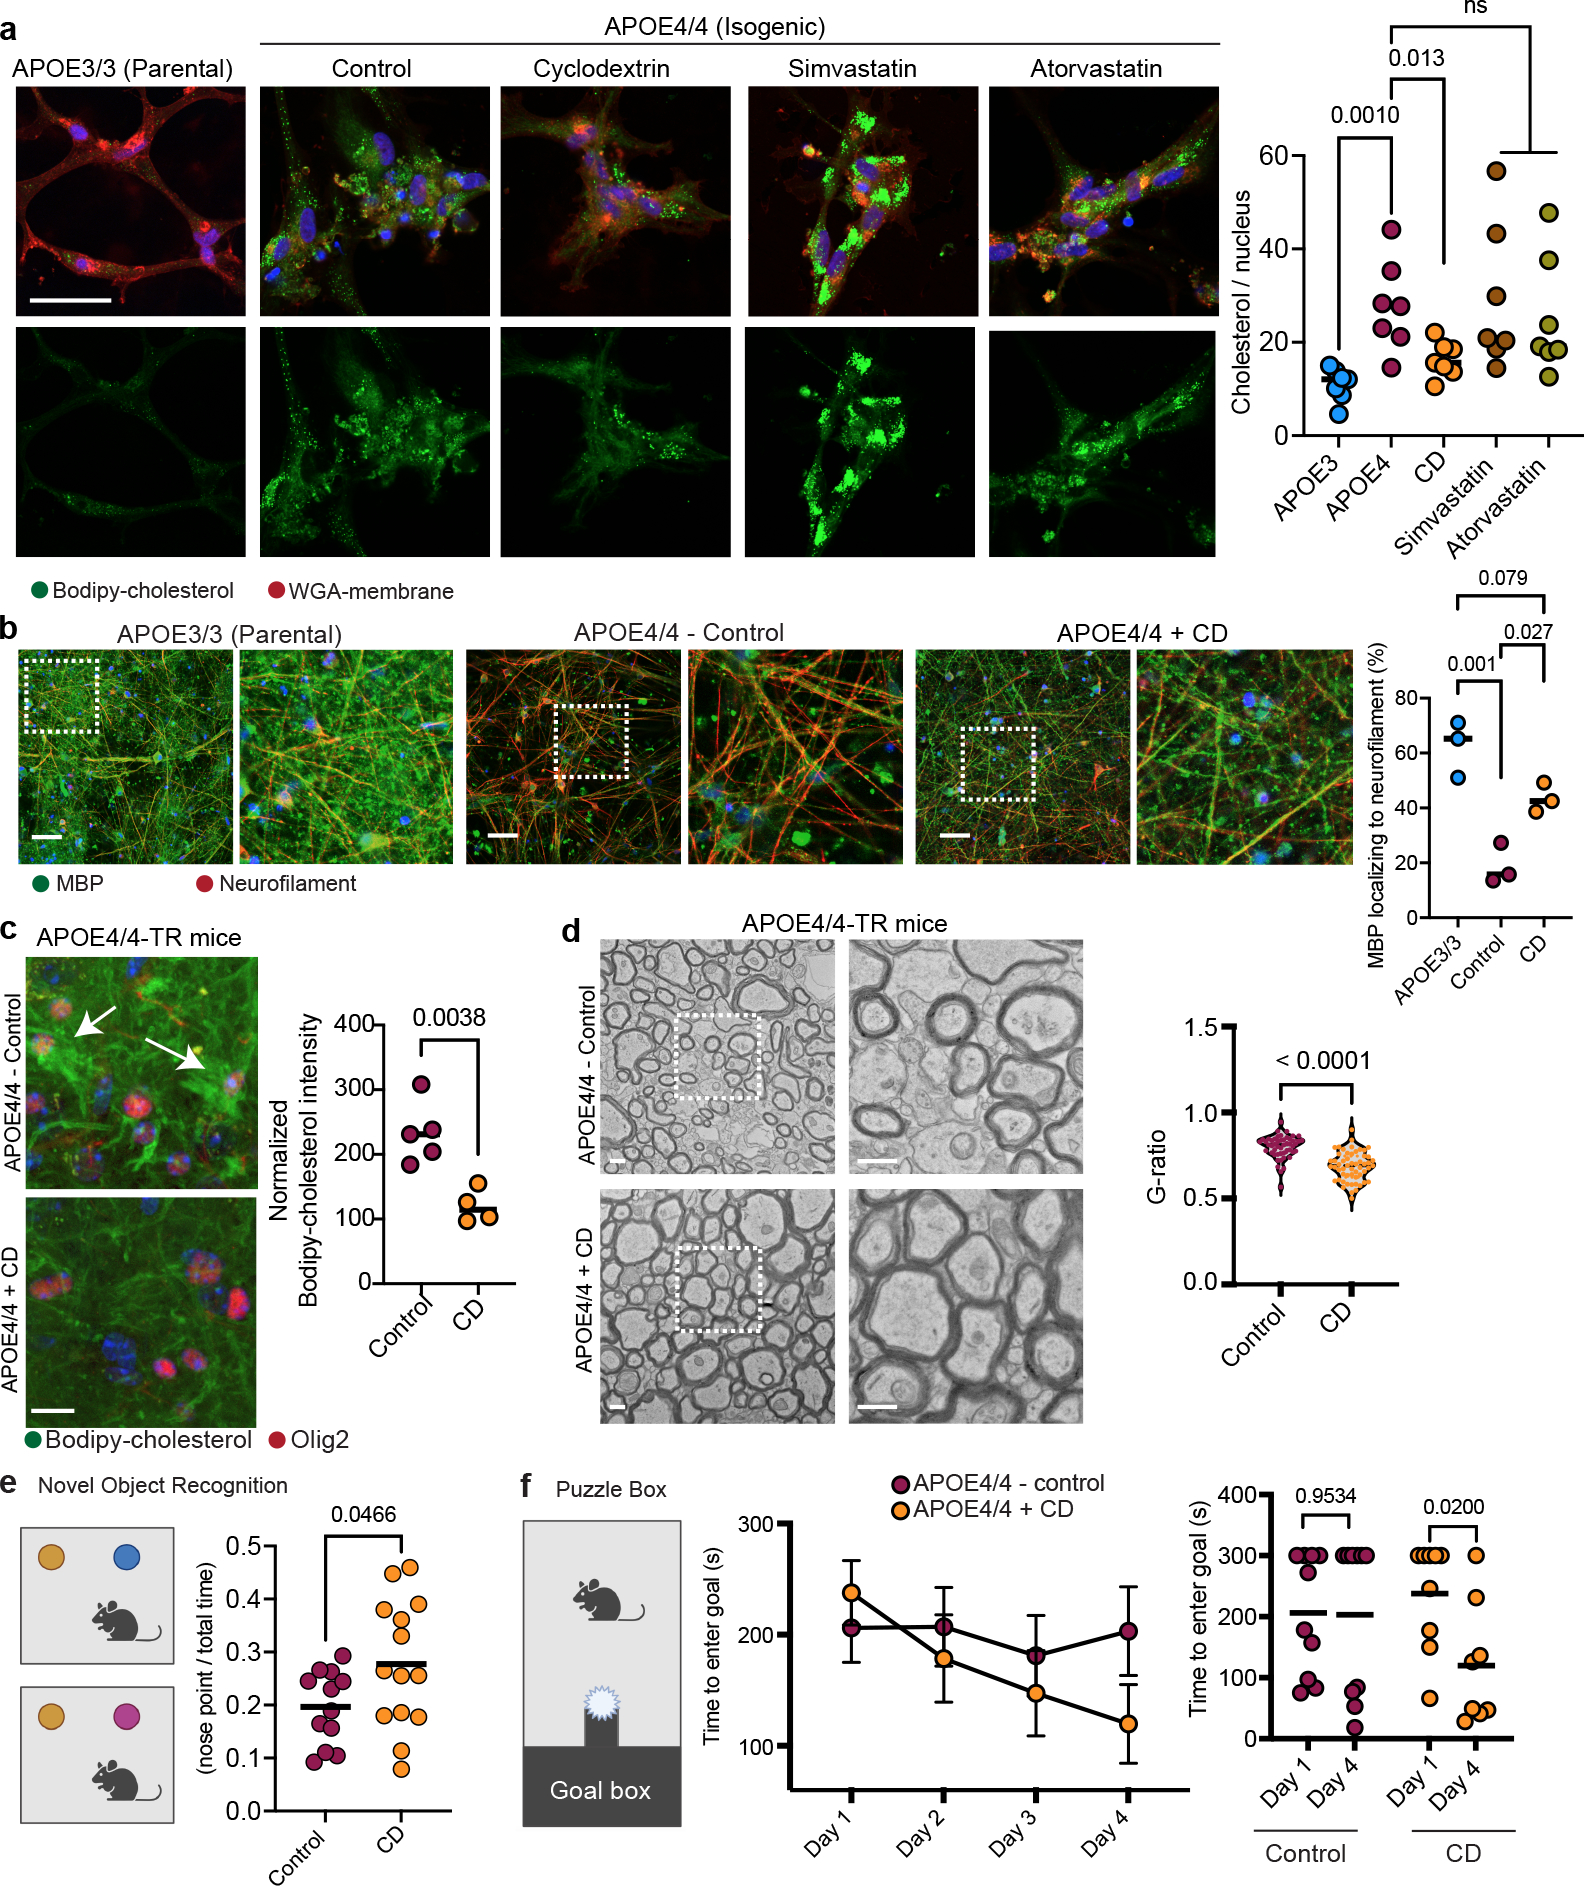
APOE4 is the strongest genetic risk factor for Alzheimer's disease1-3. However, the effects of APOE4 on the human brain are not fully understood, limiting opportunities to develop targeted therapeutics for individuals carrying APOE4 and other risk factors for Alzheimer's disease4-8. Here, to gain more comprehensive insights into the impact of APOE4 on the human brain, we performed single-cell transcriptomics profiling of post-mortem human brains from APOE4 carriers compared with non-carriers. This revealed that APOE4 is associated with widespread gene expression changes across all cell types of the human brain. Consistent with the biological function of APOE2-6, APOE4 significantly altered signalling pathways associated with cholesterol homeostasis and transport. Confirming these findings with histological and lipidomic analysis of the post-mortem human brain, induced pluripotent stem-cell-derived cells and targeted-replacement mice, we show that cholesterol is aberrantly deposited in oligodendrocytes-myelinating cells that are responsible for insulating and promoting the electrical activity of neurons. We show that altered cholesterol localization in the APOE4 brain coincides with reduced myelination. Pharmacologically facilitating cholesterol transport increases axonal myelination and improves learning and memory in APOE4 mice. We provide a single-cell atlas describing the transcriptional effects of APOE4 on the aging human brain and establish a functional link between APOE4, cholesterol, myelination and memory, offering therapeutic opportunities for Alzheimer's disease.


Conflict of interest statement

Competing interests

The authors filed a patent application based on the findings.

Figures

Extended Data Fig. 1
Extended Data Fig. 1. Subject-level metadata and single-cell annotation quality control.
a, Study cohort description by APOE genotype groups: APOE3/3-carriers (gray), APOE3/4-carriers (pink), APOE4/4-carriers (red); balanced according to positive (glow) or negative pathological diagnosis (no glow) Cartoons generated with BioRender. APOE4/4 group comprised 3 male and 5 female subjects, all with an AD diagnosis. AD status is defined based on pathological (high amyloid and tau pathology) and cognitive diagnosis of Alzheimer’s dementia (final consensus cognitive diagnosis, cogdx=4). b, Distribution of pathology variables, PMI, and age at death in cohort. Unadjusted wilcoxon test p-values shown, two-sided (N = 6 per group, except for APOE4/4, where N = 8). Boxplots indicate median, 25th and 75th percentiles. c, Experimental and computational workflow of the single-cell analysis involves single nuclei isolation and sequencing, followed by computational analysis for sub-clustering and cell type annotation. Cartoons generated with BioRender d, Two-dimensional representation of all high-quality cells included in downstream analysis labeled by major cell types. e, Cell-type-specific marker gene expression projected onto two-dimensional representation of cell space. Colored bars indicate the cell type for which a given gene was considered a marker. See panel i for legend. f, Expanded view of immune and vascular cell types within cell space. g, Enrichment of markers from two independent datasets (columns) within genes with preferential gene expression across annotated cell groups (rows). h, Distribution of inter-subject correlation values by cell type. Boxplots indicate median, 25th and 75th percentiles. i, Pairwise correlations of cell-type-specific individual-level transcriptomic profiles (average expression values across cells of a given type, N = 32 profiles per cell type). j, Median number of cells per subject by cell type. k, Fraction of subjects lacking cells of a given type. l, Individual distributions across cell types. m, Individual cell-type fractions organized by pathological diagnosis and APOE genotype.
Extended Data Fig. 2:
Extended Data Fig. 2:. APOE-associated and lipid pathway changes in APOE4 and AD
a, Curation process for APOE-associated pathway database. Brain cell type expression was defined as nonzero detection of a gene in >10% of cells of that cell type. b, Transcriptional activity scores of APOE-associated pathways that show cell-type-specific patterns. c, Individual-level average expression of cholesterol biosynthesis genes from Fig. 2a in oligodendrocytes. d, Overrepresentation of lipid-related pathways (database from Fig. 1c) within genes differentially expressed in APOE4 relative to APOE3 in human post-mortem oligodendrocytes as estimated by a negative binomial mixed model (NBMM). e, Altered lipid-associated pathways (see methods) in APOE3/3 vs APOE3/4-carriers, in no AD background (control) (nominal p-value < 0.05, linear model, unadjusted, N = 6 per group). Pathways of special interest are highlighted in bold. (−) indicates negative regulation. f-k, Pathway activity scores for ‘Cholesterol biosynthesis III (via desmosterol) stratified by APOE genotype and/or AD pathology (p-values, linear model, unadjusted, n = 6 per group). Boxplots indicate median, 25th and 75th percentiles.
Extended Data Fig. 3:
Extended Data Fig. 3:. Large-scale lipidomic analysis of human prefrontal cortex.
a, Overview of ROSMAP cohorts on which lipidomic analysis was performed. Cartoons generated with BioRender b, Cohort clinicopathological characteristics. NFT = neurofibrillary tangles (p values calculated with Wilcoxon rank-sum test, two-sided). c, A single cholesterol ester (ChE) species passed quality control (see Methods) and showed significant (p<0.05, Wilcoxon rank-sum test, two-sided) differential concentration when comparing APOE3/3 vs APOE3/4 and APOE4/4-carriers stratified by pathology. ChE(18:1) indicates a ChE with carboxylate position 18 and one unsaturated fatty acid bond. d, Distribution of the concentration of ChE species from c) (p-value = 0.046, Wilcoxon rank-sum test, two-sided). Boxplots indicate median, 25th and 75th percentiles.
Extended Data Fig. 4:
Extended Data Fig. 4:. Lipid droplets in human and mouse brain.
a, Co-localization of immunohistochemistry against lipid-droplet associated protein perilipin-1 (PLIN1) with Bodipy-cholesterol staining in the human prefrontal cortex from APOE3/3 and APOE3/4 individuals (n=3 imaged per genotype). Cell nuclei stained with Hoechst dye. b, Transmission electron microscopy (TEM) on corpus callosum from six-month-old APOE3-TR and APOE4-TR mice (males, n=3 per genotype). The number of lipid droplets was quantified in four 1 μm2 areas per image from three images per mouse. Right panel, dots represent mean value per mouse and bar represents mean value for group, p value was calculated using unpaired, two-tailed student’s t-test. c, Representative images of Bodipy-cholesterol staining, with markers for microglia (IBA1), astrocytes (GFAP) and oligodendrocytes (OLIG2) in the prefrontal cortex of APOE4-carriers (n = four individuals). Dotted outline in the OLIG2 panel depicts the 2 μm radius around the nucleus that was quantified for the presence of Bodipy-cholesterol. Scale bar 10 μm. Bodipy-cholesterol staining was quantified for cell type based on localization with cell type-specific markers. Bars depict means from different biological replicates. P values calculated using unpaired, two-tailed student’s t-test. The dotted outline in the OLIG2 panel depicts the 2 μm radius around the nucleus that was quantified for the presence of Bodipy-cholesterol. d, Co-localization of perilipin-1 (PLIN1) immunoreactivity around OLIG2-positive nuclei in prefrontal cortex from an APOE3/4 individual. e, Quantification of the number of perilipin-1 punctae around representative OLIG2-positive nuclei in APOE3/3 and APOE3/4 individuals (n=4 per genotype). The number of Perilipin-1 punctae was determined using Imaris software. P-value was calculated using unpaired, two-tailed student’s t-test.
Extended Data Fig. 5
Extended Data Fig. 5. Comparison of post-mortem oligodendrocytes and iPSC-derived oligodendroglia.
a, Comparison of the relative expression of myelination genes (MYRF, MOG, PLP1, PLLP, MAG, OPALIN) in iPSC-derived brain cell types and aggregated cell type gene expression profiles from post-mortem human brain single-nucleus data. b, Staining of MBP, MYRF, and MOG in iPSC-derived oligodendroglia. Scale bar 10 μm. c, Representative images of cultures of iPSC-derived oligodendroglia stained for PLP1 and MBP. Dots represent the percentage of nuclei positive for each marker across independent wells subjected to the same conditions (n = 5 biological replicates). Bars represent mean across all wells, error bars represent standard deviation. d, Principal component analysis of relative gene expression for post-mortem human brain cells and iPSC-derived counterparts. e, Transcriptional similarity between post-mortem human cell types and iPSC-derived oligodendroglia, p values calculated with Wilcoxon test, two-sided. Distributions represent distances between each post-mortem cell type (x-axis) and iPSC oligodendroglia in scaled gene space (N = 32 per post-mortem cell type, N = 6–8 for iPSC cell types). f-g, Gene set activity scores by GSVA on scaled expression values using genes shown in a or h, p value calculated by Wilcoxon test, two-sided. Boxplots indicate median, 25th and 75th percentiles. h, Relative expression of cholesterol-associated genes across iPSC-derived oligodendroglia, post-mortem human brain oligodendrocytes, and additional brain cell types. i, Gene expression distribution in iPSC-derived oligodendroglia. j, APOE immunoreactivity in APOE3/3 (n = 4 biological replicates) and APOE4/4 (n = 5 biological replicates) iPSC-derived oligodendroglia. Dots in right panel plots represent mean from independent images, p values were calculated with an unpaired, two-tailed student’s t-test. k, Distribution of gene nonzero detection rates in human post-mortem oligodendrocytes (snRNAseq). The nonzero APOE detection-rate is circa 4%, corresponding to circa 53rd percentile of genes. l, Distribution of expression levels for APOE-non-expressing (n = 53,095) and APOE-expressing (n = 1,882) post-mortem oligodendrocytes (snRNAseq). Groups were identified by K-means clustering on the non-zero detection rate.
Extended Data Fig. 6:
Extended Data Fig. 6:. Lipidomics on iPSC-derived oligodendroglia.
a, Volcano plots depicting differentially (adjusted p value < 0.05) detected lipid species in APOE4/4 oligodendroglia, compared to isogenic APOE3/3 controls. Each detected lipid species is organized according to lipid class, with cholesteryl esters having the highest number (15) of differentially expressed species.
Extended Data Fig. 7:
Extended Data Fig. 7:. Cell stress in APOE4 oligodendrocytes.
a, mRNA expression levels of SOAT1 (ACAT1) and CYP46A1 from bulk sequencing of isogenic iPSC-derived APOE3/3 and APOE4/4 oligodendroglia (n=3 biological replicates per genotype, adjusted p values shown, computed by linear model). b, Perilipin-1 (PLIN1) immunoreactivity in APOE4/4 iPSC-derived oligodendroglia, and PLIN1 co-localization with Bodipy-cholesterol staining in APOE4/4 iPSC-derived oligodendroglia. c, Representative Bodipy staining for lipid droplets (n = 6 biological replicates). Scale bar represents 10 μm. Lipid droplets were quantified in two different isogenic sets of APOE3/3 and APOE4/4 oligodendroglia, that were generated from different individuals. Data points represent biological replicates and bars show means. p values were calculated using an unpaired, two-tailed student’s t-test. d, Percent of Bodipy-cholesterol staining in lysosome. Quantification was performed using ImageJ software with the same threshold setting for all images and conditions. Data points represent the mean of four images from one biological replicate. Bars represent means from four biological replicates. p value was calculated using unpaired, two-tailed student’s t-test. e, (left) Box plot of ATF-6 mediated unfolded protein response gene set activity (computed by GSVA) in human post-mortem oligodendrocytes. unadjusted p-value = 0.016, linear model. Boxplots indicate median, 25th and 75th percentiles. (right) Pathway gene members that are differentially expressed (FDR < 0.05, negative binomial mixed model) f, Representative images of immunohistochemistry against ATF-6 protein in APOE3/3 and APOE4/4 iPSC-derived oligodendrocytes, and quantification of number of cells with nuclear ATF-6 immunoreactivity (n = 5 biological replicates). Dots represent technical replicates, and bars represent mean per genotype. p value was calculated using an unpaired, two-tailed student’s t-test. g, Fold change for unfolded protein response genes in APOE4/4 vs APOE3/3 oligodendroglia (N = 3 per genotype) from panel e (adjusted p-value < 0.05, negative binomial distribution).
Extended Data Fig. 8:
Extended Data Fig. 8:. Myelin expression in humans and mice.
a, Myelin-associated gene expression changes in APOE3/3 vs APOE3/4 post-mortem oligodendrocytes for individuals with and without AD pathology (logFC<0 indicates down in APOE3/4; Wilcoxon test by wilcoxauc(), adjusted p value < 0.05). b, Immunohistochemistry for Myelin Basic Protein (MBP) in APOE3/3 and APOE3/4 individuals with AD diagnosis (n=3 per genotype), and quantification. Mean fluorescence intensity quantified using FIJI ImageJ software. Dots represent mean value calculated from four images from one individual, and bars represent mean value from three separate individuals for each genotype. p value was calculated using an unpaired, two-tailed student’s t-test. c, Immunohistochemistry for myelin basic protein (MBP) in hippocampal slices of APOE3/3-TR (n = 7 mice) and APOE4/4-TR (n = 7 mice) at nine months of age, quantified according to mean fluorescence intensity. Quantification was performed using ImageJ. Bars represent mean intensity from all mice for each genotype, and error bars represent standard deviation. p values were calculated using unpaired, two-tailed student’s t-test. Scale bar represent 200 μm. d, Western Blot for Myelin Basic Protein (MBP) in APOE3/3-TR (n=4) and APOE4/4-TR (n=4) mouse cortex at six months of age. Each lane is a brain lysate prepared from a different mouse. Total area and intensity of bands normalized to GAPDH was quantified via ImageJ using mean intensity for each band. Bars represent means. p value was calculated using an unpaired, two-tailed student’s t-test. e, TEM on corpus callosum from APOE3/3-TR (n=3) and APOE4/4-TR (n=3) knock-in mice at 2 months of age. G-ratio was quantified using ImageJ software as stated in Main Figure 4d). Scale bar represents 500 μm. Data points representing g-ratios for axons from each genotype, p value was calculated using an unpaired Wilcoxon test.
Extended Data Fig. 9:
Extended Data Fig. 9:. Myelin expression in iPSC-derived oligodendrocyte cultures.
a, Schematic of iPSC-derived NGN2-induced neuron (iNeuron) and oligodendrocyte encapsulation in Matrigel. Cartoons generated with BioRender b, Representative image of Neurofilament (red), Myelin Basic Protein (green), and Hoechst (blue) immunoreactivity in iPSC-derived neuron and oligodendrocyte co-culture, after two weeks encapsulated. Scale bar represents 50 μm. c, Representative images of (left) Neurofilament (red), MBP (green), and Hoechst (blue), and (right) Neurofilament (red), O4 (green), and Hoechst (blue) immunoreactivity in iPSC-derived neuron and oligodendrocyte co-culture, after six weeks encapsulated. Scale bar represents 50 μm. d, iPSC-derived oligodendroglia were labeled with GFP to visualize cellular localization after six weeks of co-culture with NGN2-induced neurons. Scale bar represents 50 μm. e, Representative image of Neurofilament (red), MBP (green), and Hoechst (blue), and Neurofilament (red), and Hoechst (blue) immunoreactivity in iPSC-derived oligodendroglia and NGN2-induced neuron after six weeks of co-culture. Scale bar represents 50 μm. f, TEM on myelinated axon from iPSC-derived neuron and oligodendrocyte co-culture, suggesting presence of myelin rings. g, Representative images showing Neurofilament (red), MBP (green) immunoreactivity in APOE3/3 parental and APOE4/4 isogenic co-cultures after three weeks encapsulated. Scale bar represents 10 μm. h, Axonal area per co-culture, comparing APOE3/3 (parental), APOE4/4 (isogenic) and APOE−/− (isogenic) co-cultures (n = 3 biological replicates). Axonal area was calculated by measuring the area immunoreactive to neurofilament, and normalized to APOE3/3. Bars represent means, error bars represent standard deviation, and p values were calculated using one-way ANOVA with Bonferroni correction. i, MBP density between APOE3/3 (parental) and APOE4/4 (isogenic) mono-cultures (n = 6 biological replicates) P value represents unpaired, two-tailed student’s t-test. j, Representative images showing Neurofilament (red), and MBP (green) immunoreactivity in APOE3/3 (parental), APOE4/4 (isogenic), APOE4/4 (isogenic) with recombinant human APOE3 protein, and APOE knock-out (isogenic) co-culture conditions (n = 3 biological replicates). The area of neuronal axon (immunoreactive against Neurofilament) positive for MBP was calculated using Imaris, and each experimental condition was compared to the APOE3/3 control condition. P values were calculated using one-way ANOVA with Bonferroni correction.
Extended Data Fig. 10:
Extended Data Fig. 10:. (2-Hydroxypropyl)-beta-cyclodextrin treatment in APOE4 knock-in mice
a, Bodipy (neutral lipid) staining in control and (2-Hydroxypropyl)-beta-cyclodextrin (cyclodextrin) treated iPSC-derived APOE4/4 oligodendrocytes (n = 6 biological replicates). The number of lipid droplets was normalized by the total number of cell nuclei for each image. Bars represent the mean number of droplets per cell for each condition, error bars represent standard deviation. P value was calculated using unpaired, two-tailed student’s t-test. b, MBP and Bodipy-cholesterol staining in control (n = 5 mice) and cyclodextrin-treated (n = 4 mice) APOE4/4-TR mouse brain. Scale bar represents 50 μm. Quantification of cholesterol-myelin colocalization, and MBP signal, in cyclodextrin-treated APOE4/4-TR mice. MBP-cholesterol colocalization was quantified using Imaris. MBP staining was quantified using Image J. Bars represent mean, error bars represent standard deviation, and p-value was calculated using an unpaired two-tailed student’s t-test. c, Representative activity traces for open field assay on APOE4/4-TR control- (n = 14 mice) and cyclodextrin-treated (n = 15 mice) used for Novel Object Recognition task. Distance moved (centimeters) and duration in the center (seconds) were measured and quantified using Noldus EthoVision software, with the same parameters for each animal. Dots represent individual mice, error bars are standard error of the mean, and p values were calculated using an unpaired, two-tailed student’s t-test. d, Representative activity traces for open field assay on APOE4/4-TR control- (n = 10 mice) and cyclodextrin-treated (n = 9 mice) used for the Puzzle Box task. Distance moved (centimeters) and duration in the center (seconds) were measured and quantified using Noldus EthoVision software, with the same parameters for each animal. Dots represent individual mice, error bars represent standard error of the mean, and p values were calculated using an unpaired, two-tailed student’s t-test.
Fig. 1.
Fig. 1.. Cell-type specific APOE4-associated pathway alterations.
a, Top gene ontology biological processes (BP) with expression changes associated with APOE4 (nominal p-value < 0.05, linear model, APOE3/3 vs APOE3/4 and APOE4/4). Red indicates APOE4 up-regulation and blue down-regulated relative to APOE3. Top 20 pathways in order of p-value. Unique alterations indicate evidence (p-value < 0.05) of pathway alteration in a single cell type. Shared alterations indicate evidence in multiple cell types. b, APOE-associated pathways with expression changes associated with APOE4 (nominal p-value < 0.05, linear model, APOE3/3 vs APOE3/4 and APOE4/4). ‘X’ indicates evidence of alteration (p-value < 0.05). Pathways were manually classified into three categories (color box, right). c, Brain-specific lipid-associated pathways (see Methods) with APOE4-associated expression changes (nominal p-value < 0.05, linear model, APOE3/3 vs APOE3/4 and APOE4/4).
Fig. 2:
Fig. 2:. APOE4 alters cholesterol homeostasis and localization in human post-mortem oligodendrocytes.
a, Dose-dependent association between APOE4 and cholesterol biosynthesis genes aggregated expression in oligodendrocytes (APOE 4/4 > 3/4 > 3/3, Pearson correlation coefficient (pcc) = 0.45, p-value = 0.01, two-sided). b, Curation process of cholesterol-related genes. Pathway databases were filtered using the terms cholesterol/lipid storage, transport, or synthesis. c, Cholesterol-related genes differentially expressed in APOE3/3 vs APOE3/4 and APOE4/4 post-mortem oligodendrocytes (snRNA-seq data, FDR-adjusted p-value < 0.05, negative binomial mixed model). d, Detection levels of four cholesteryl esters quantified by mass-spectrometry of post-mortem human corpus callosum from APOE3 (APOE3/3, females, n=3) and APOE4-carriers (APOE4/4, females, n=3). Data points represent relative abundance per individual (n=3 individuals per genotype). Numbers in the top label cholesteryl ester species. First number specifies the carboxylate position connecting the fatty acid to the cholesterol hydroxyl group. Second number specifies the frequency of unsaturated fatty acid bonds. Two-sided unadjusted wilcoxon test p-values are shown. Boxplots indicate median, 25th and 75th percentiles. e, Representative images of Bodipy-cholesterol staining and anti-myelin basic protein (MBP) immunoreactivity in prefrontal cortex (BA10) from APOE4-carriers compared to APOE3/3 individuals. Scale bar 10 μm. Cholesterol localization was analyzed across 4 individuals for each APOE genotype. Right panels show total Bodipy-cholesterol signal and percent of Bodipy-cholesterol signal within 1 μm of an MBP-positive axon quantified using Imaris software. Data points represent individuals. Bars depict means, error bars represent standard error of the mean, and p values were calculated with an unpaired two-tailed student’s t-test.
Fig. 3:
Fig. 3:. APOE4 alters cholesterol homeostasis and localization in iPSC-derived oligodendrocytes.
a, Detected lipid-species concentrations from mass spectrometry-based lipidomic profiling of iPSC-derived APOE3/3 and APOE4/4 oligodendroglia. Cholesteryl ester species are highlighted in yellow. Barplot depicts the number of differentially (adjusted p value < 0.05) detected lipid species for each lipid class. Cholesteryl esters are the most frequently differentially detected class, with 15 species upregulated in APOE4 oligodendroglia. b, Representative images of Filipin (cholesterol) and WGA-membrane staining in APOE3/3 and APOE4/4 iPSC-derived oligodendroglia. Arrows highlight altered cholesterol localization in APOE4/4 iPSC-derived oligodendroglia. Filipin intensity was quantified for the cell membrane (localized with WGA) and intracellular compartment (between membrane and nucleus; n=6 replicates from independent experiments), scale bar represents 50 μm. Bars represent means from independent biological replicates, p values were calculated with an unpaired two-tailed student’s t-test. c, Representative images of APOE3/3 and APOE4/4 iPSC-derived oligodendroglia. Bodipy-cholesterol stained oligodendroglia. Bars represent means from independent biological replicates (n=4 per genotype), and p values were calculated with an unpaired two-tailed student’s t-test, scale bar represents 24 μm. d, Representative images of APOE4/4 iPSC-oligodendroglia following addition of 1 μg/ml Bodipy-cholesterol to cell culture media of live cells, for two hours. Cells were counterstained for markers of the endosome (EEA1), lysosome (LAMP1), and endoplasmic reticulum (Calreticulin). The percentage of Bodipy-cholesterol particles overlapping with EEA1, (n = 5), LAMP1 (n = 5), or Calreticulin (n = 4) immunoreactivity was quantified using Imaris software. Scale bar represents 24 μm. Bars represent means, data points represent independent biological replicates, P-values were calculated with a one-way ANOVA.
Figure 4:
Figure 4:. APOE4 leads to impaired myelination in mice and humans.
a, Log2(mean gene expression in APOE3/4 & APOE4/4 / mean gene expression in APOE3/3) for differentially expressed (p-adj < 0.05, Wilcoxon test computed by wilcoxauc(); see methods) myelin-associated or cholesterol-associated genes in human post-mortem oligodendrocytes. b, Black Gold II staining of myelinated axons in the PFC (BA10) of APOE3/3 and APOE3/4 individuals (n=3 individuals/genotype). Area positive for Black Gold II staining was quantified using ImageJ, with same intensity thresholds for each image and group. Scale bar represents 250 μm. Data points represent individuals, bars represent mean per genotype, p values were calculated with an unpaired two-tailed student’s t-test. c, MBP and neurofilament (SMI311) immunoreactivity in prefrontal cortex (BA10) from APOE4-carriers and non-carriers (n=6 individuals/genotype). Area positive for MBP and Neurofilament were quantified using FIJI ImageJ with same intensity thresholds for each image and group. Three images were quantified for each individual. Data points represent individuals mean values, bars represent means per genotype, p values were calculated with an unpaired two-tailed student’s t-test. d, TEM on sections from human corpus callosum of APOE4-carriers (n=3 individuals, n= 58 axons) and APOE3/3 (n=3 individuals, n = 44 axons). Scale bar represents 500 μm. G-ratio was calculated with ImageJ, measuring inner axonal diameter divided by the diameter of outer myelin band. Data points represent axons, p values were calculated with an Wilcoxon test. e, TEM on corpus callosum from APOE3/3 (n=3) and APOE4/4 (n=3) TR mice at 6 months of age. G-ratio was quantified using ImageJ as stated in d). Scale bar represents 500 μm. Data points represent axons, p values were calculated with a Wilcoxon test. Number of myelinated axons per image was counted with Cell Counter tool (ImageJ). Data points represent average per animal, bars represent mean per genotype, p values were calculated with an unpaired two-tailed student’s t-test.
Figure 5:
Figure 5:. iPSC-derived APOE4 oligodendroglia exhibit myelination deficits in neuronal co-cultures.
a, Representative co-culture images of isogenic iPSC-derived APOE4/4 and APOE3/3 oligodendroglia and NGN2-induced neurons after six weeks of culture (n = 5 biological replicates). Scale bar represents 50 μm. Co-cultures were prepared using two different isogenic iPSC sets created with reciprocal editing strategies from different individuals. MBP immunoreactivity localized within 1 μm of Neurofilament immunoreactivity was quantified using Imaris. Data points represent mean values (n = 4 images, independent biological replicates). Bars represent group mean values, p values were calculated with an unpaired two-tailed student’s t-test. b, Genetic “mix and match” experiment where oligodendrocytes and neurons were co-cultured under four permutations (Oligodendroglia with iNeuron): APOE3/3 with APOE3/3, APOE3/3 with APOE4/4, APOE4/4 with APOE4/4, and APOE4/4 with APOE3/3 (n=5 biological replicates). Percent of MBP immunoreactivity localized within 1 μm of neurofilament staining was quantified using Imaris. Representative MBP, neurofilament, and Hoechst staining images. Scale bar represents 50 μm. Data points represent the mean (n=4 four images, independent experiments). Axonal MBP quantified using ImageJ, same thresholding settings for each image and group (p values were calculated using a one-way ANOVA, Bonferroni correction).
Figure 6:
Figure 6:. Cyclodextrin improves myelination and learning and memory in aged APOE4 mice.
a, Representative Bodipy-cholesterol images of APOE4/4 iPSC-derived oligodendroglia treated with cyclodextrin (1 mM), simvastatin (1 μM), or atorvastatin (1μM). Scale bar represents 50 μm. Bodipy-cholesterol positive punctae normalized to the number of nuclei. Bars represent means (n=7 biological replicates; p values were calculated using a one-way ANOVA, Bonferroni correction). b, MBP and neurofilament staining of cyclodextrin-treated co-cultures of iPSC-derived APOE4/4 oligodendroglia and neurons versus APOE3/3 co-cultures. Scale bar represents 10 μm. Axonal MBP expression was quantified using Imaris. Bars represent means (n= 3 biological replicates; p values were calculated using a one-way ANOVA, Bonferroni correction). c, Bodipy-cholesterol and Olig2 staining in control (n = 5) or cyclodextrin-treated (n = 4) APOE4/4-TR mouse brain. Arrows highlight Bodipy-cholesterol accumulations around Olig2-positive nuclei. Datapoints represent individual mice, bars represent means of treatment group, p values were calculated with an unpaired two-tailed student’s t-test. Scale bar represents 50 μm. d, Representative corpus callosum TEM images from APOE4/4-TR mice treated with saline (n = 5 mice, n = 51 axons ) cyclodextrin (n = 4 mice, n = 56 axons) for 8 weeks. Scale bar represents 500 nm. G-ratio calculated as described in 4d), p values were calculated with an unpaired two-tailed student’s t-test. e, Schematic of novel object recognition task with control (n = 12) and cyclodextrin-treated (n = 14) APOE4/4-TR female mice. Preference calculated by dividing time the animal explored the novel object with the nose by total time interacting with either object (measured with Noldus EthoVision) Cartoons generated with BioRender. Data points represent individual mice. Bars represent means), p values were calculated with an unpaired two-tailed student’s t-test with Welch correction. f, Puzzle box test, control n = 9 and cyclodextrin-treated n = 10 APOE4/4-TR mice. Task performance was recorded with Noldus EthoVision. Data points represent means per treatment group and bars represent standard error of the mean, p values were calculated with an unpaired two-tailed student’s t-test Cartoons generated with BioRender.

Comment in

References

    1. Lambert JC et al. Meta-analysis of 74,046 individuals identifies 11 new susceptibility loci for Alzheimer’s disease. Nat. Genet. 45, 1452–1458 (2013). - PMC - PubMed
    1. Corder EH et al. Gene dose of apolipoprotein E type 4 allele and the risk of Alzheimer’s disease in late onset families. Science 261, 921–923 (1993). - PubMed
    1. Strittmatter WJ et al. Apolipoprotein E: high-avidity binding to beta-amyloid and increased frequency of type 4 allele in late-onset familial Alzheimer disease. Proc. Natl. Acad. Sci. U. S. A. 90, 1977–1981 (1993). - PMC - PubMed
    1. Liu C-C et al. ApoE4 accelerates early seeding of amyloid pathology. Neuron 96, 1024–1032.e3 (2017). - PMC - PubMed
    1. Shi Y et al. ApoE4 markedly exacerbates tau-mediated neurodegeneration in a mouse model of tauopathy. Nature 549, 523–527 (2017). - PMC - PubMed

Publication types

MeSH terms