. 2022 Nov;611(7937):780-786.
doi: 10.1038/s41586-022-05438-x. Epub 2022 Nov 16.

Enterococci enhance Clostridioides difficile pathogenesis

Affiliations

Enterococci enhance Clostridioides difficile pathogenesis

Alexander B Smith et al. Nature. 2022 Nov.

Abstract

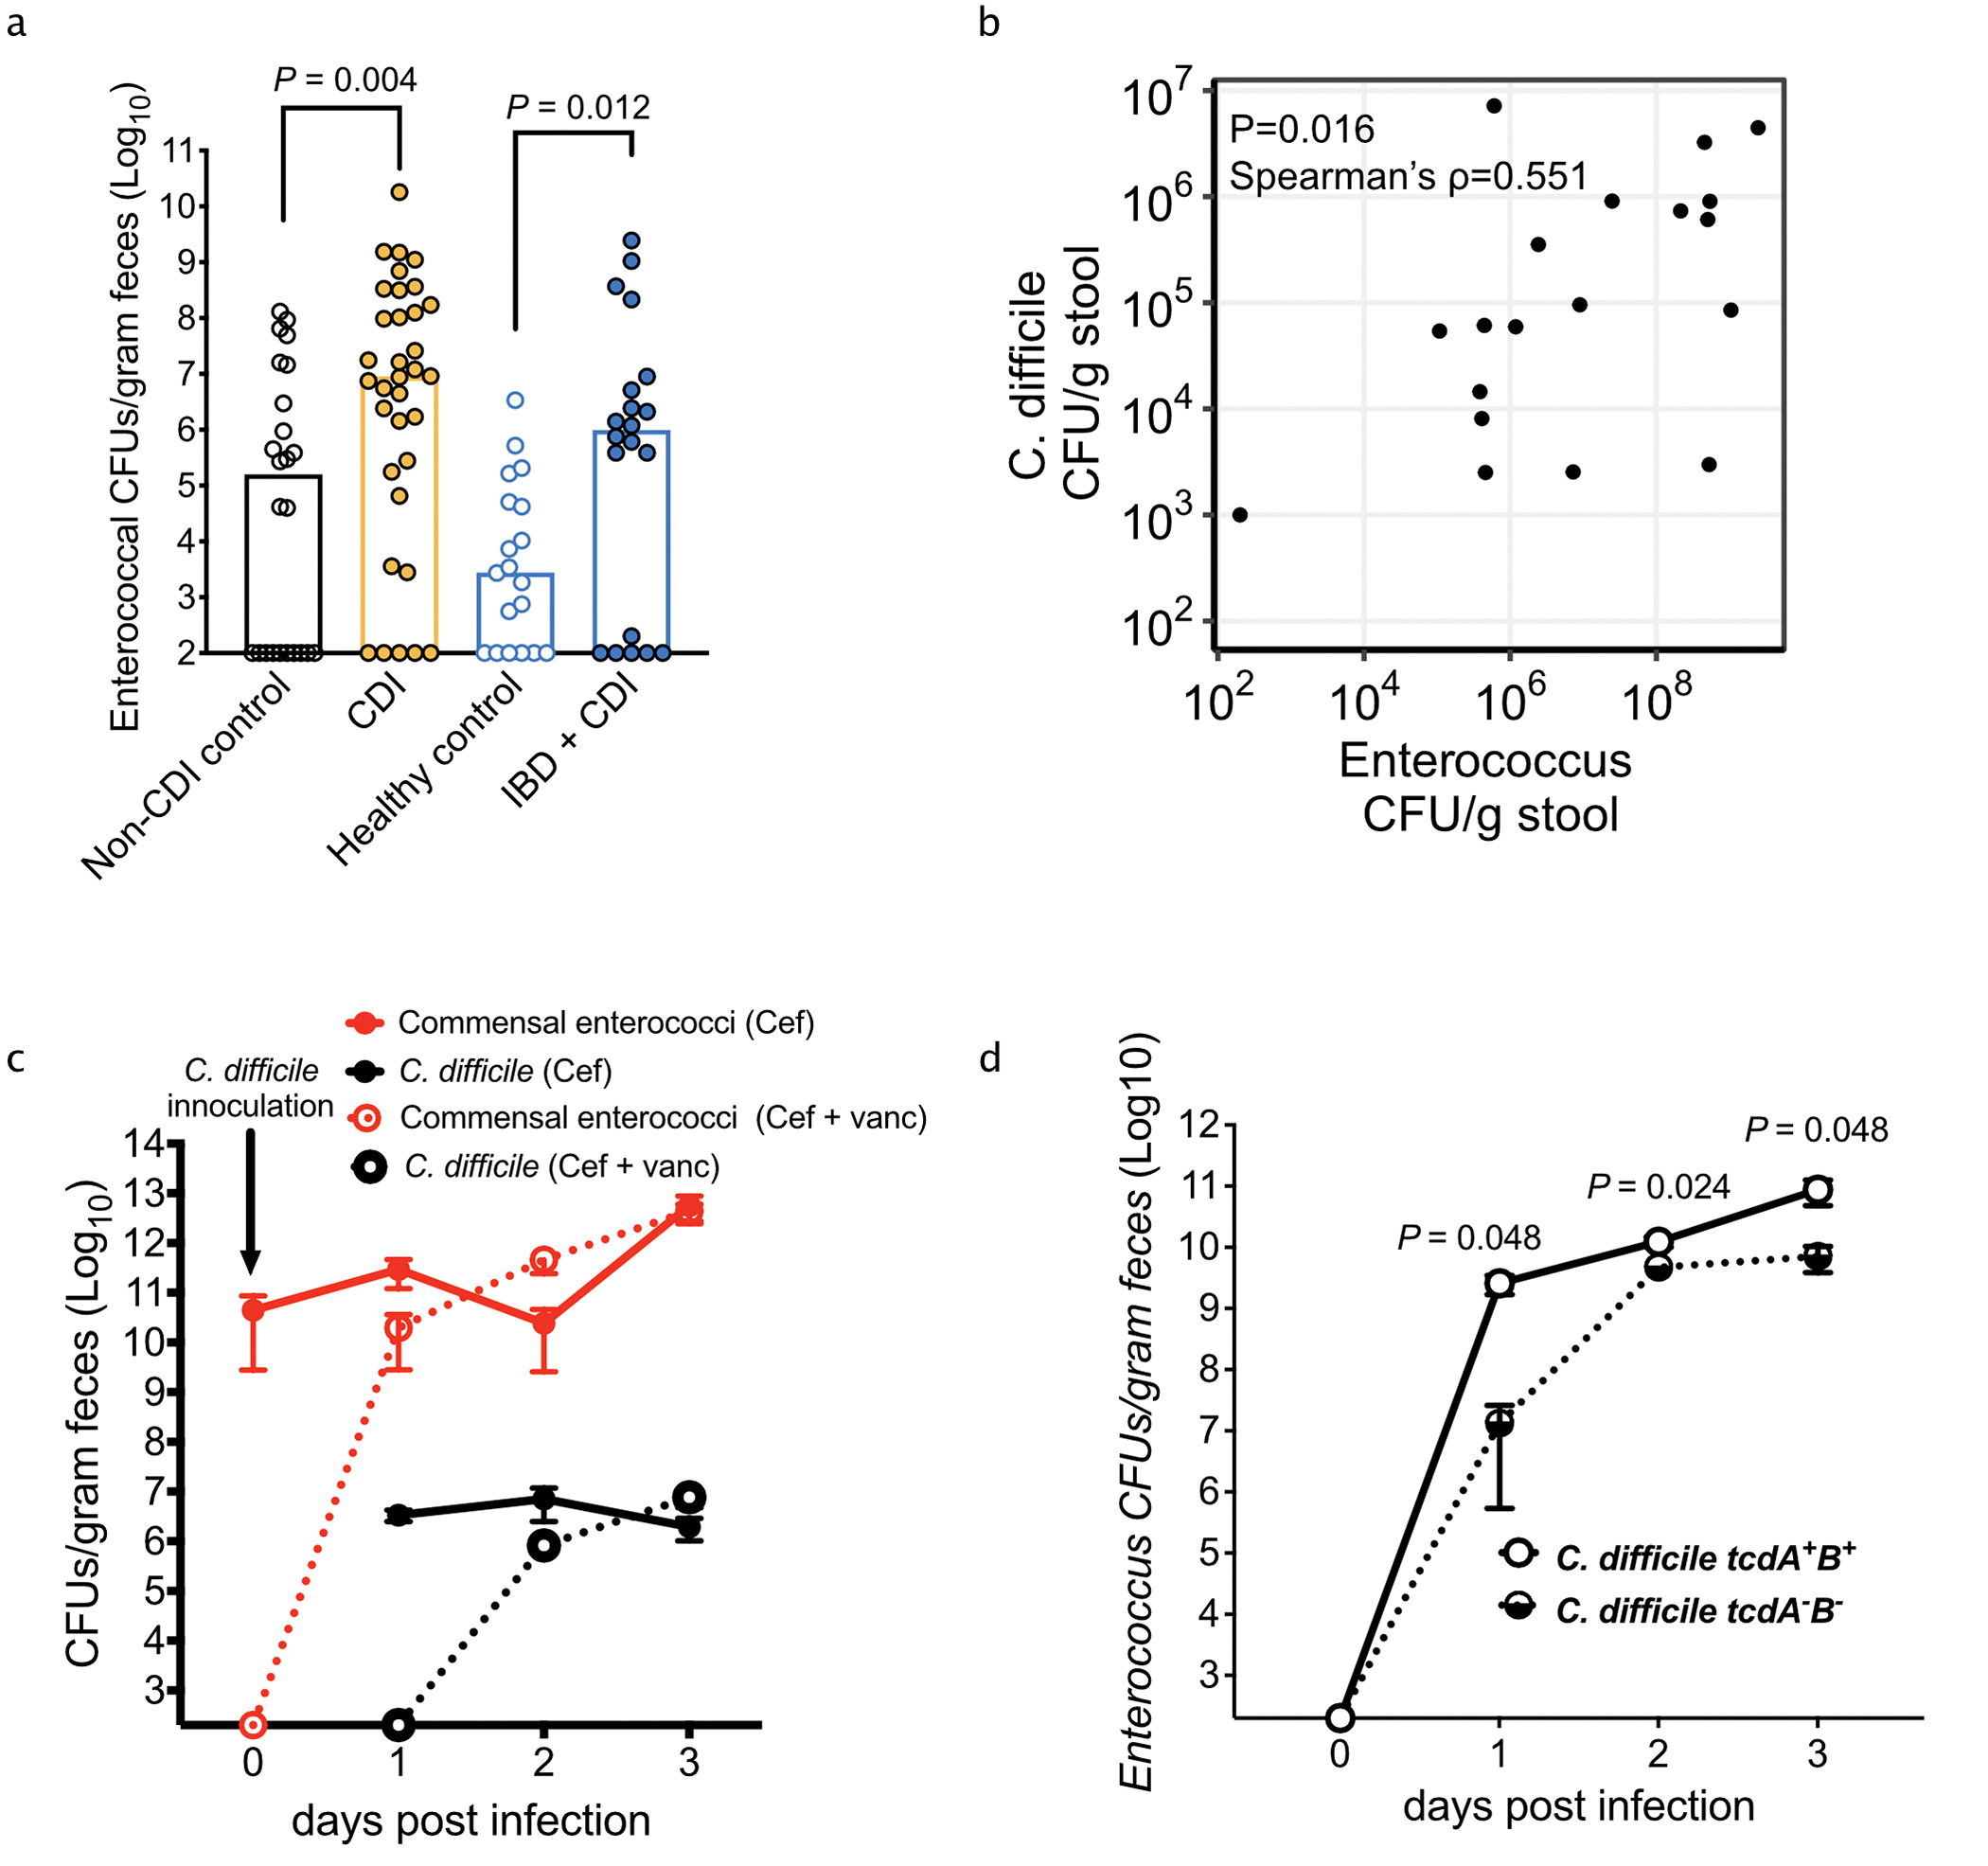
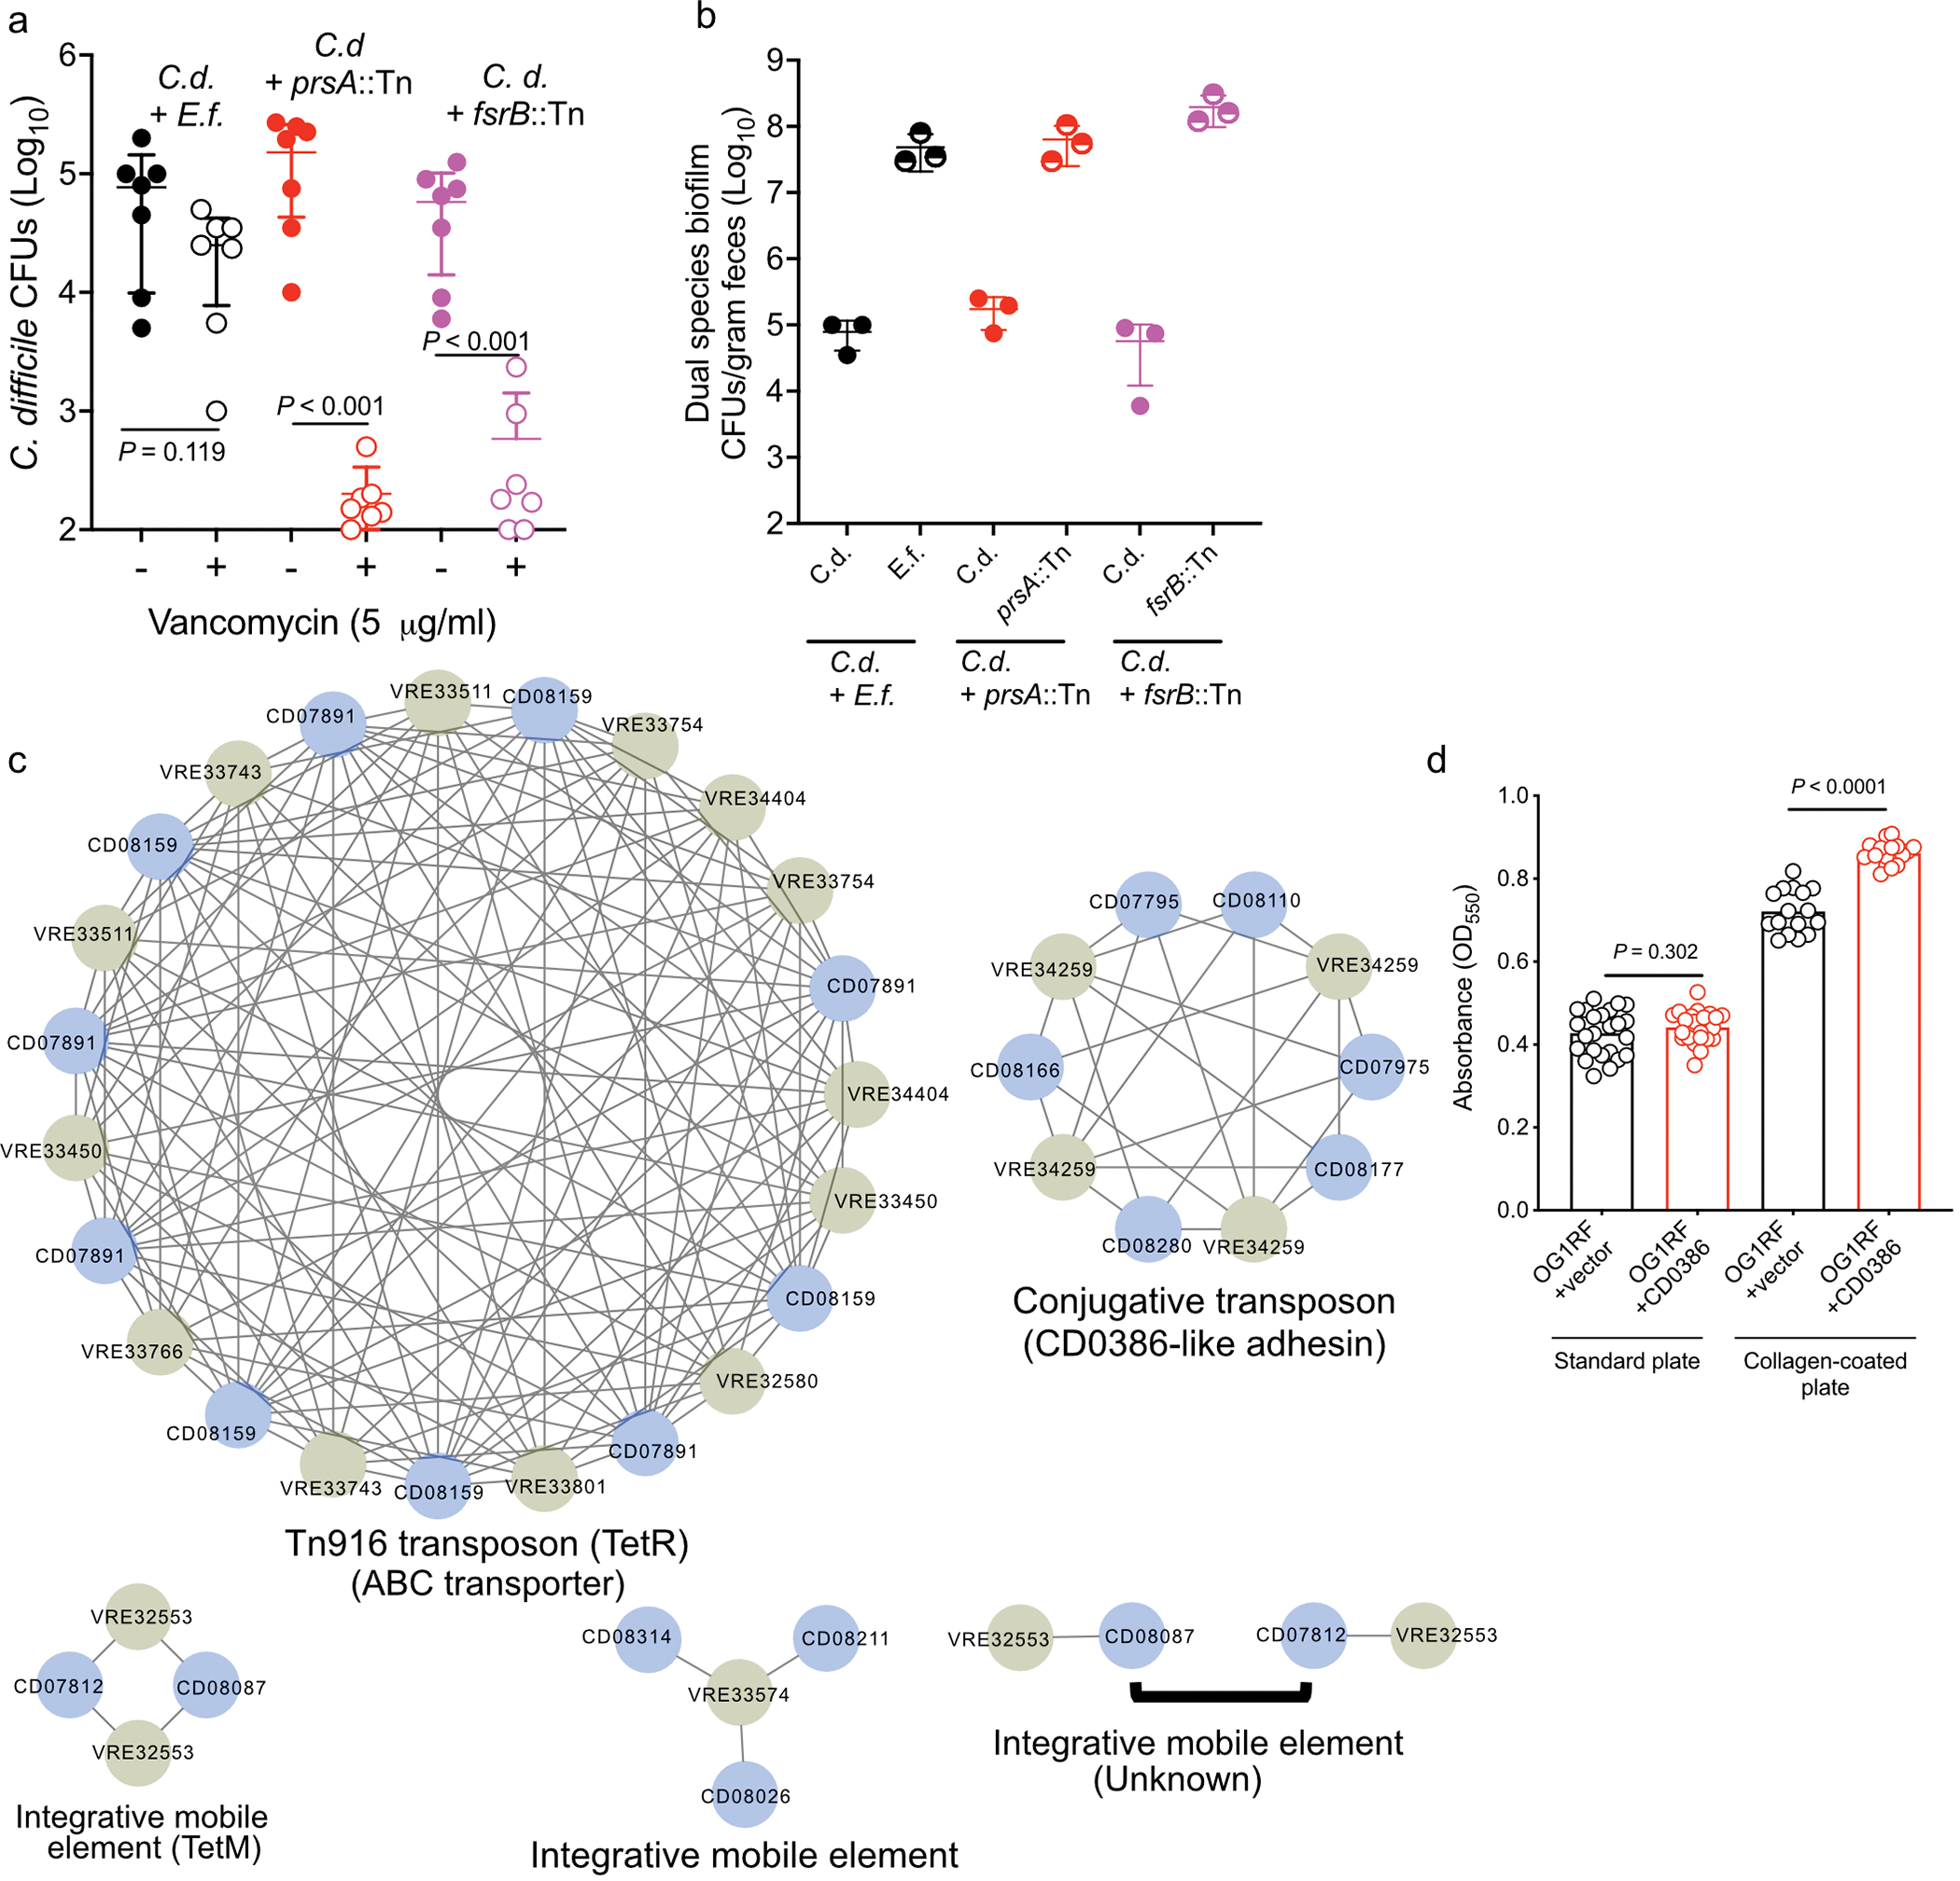
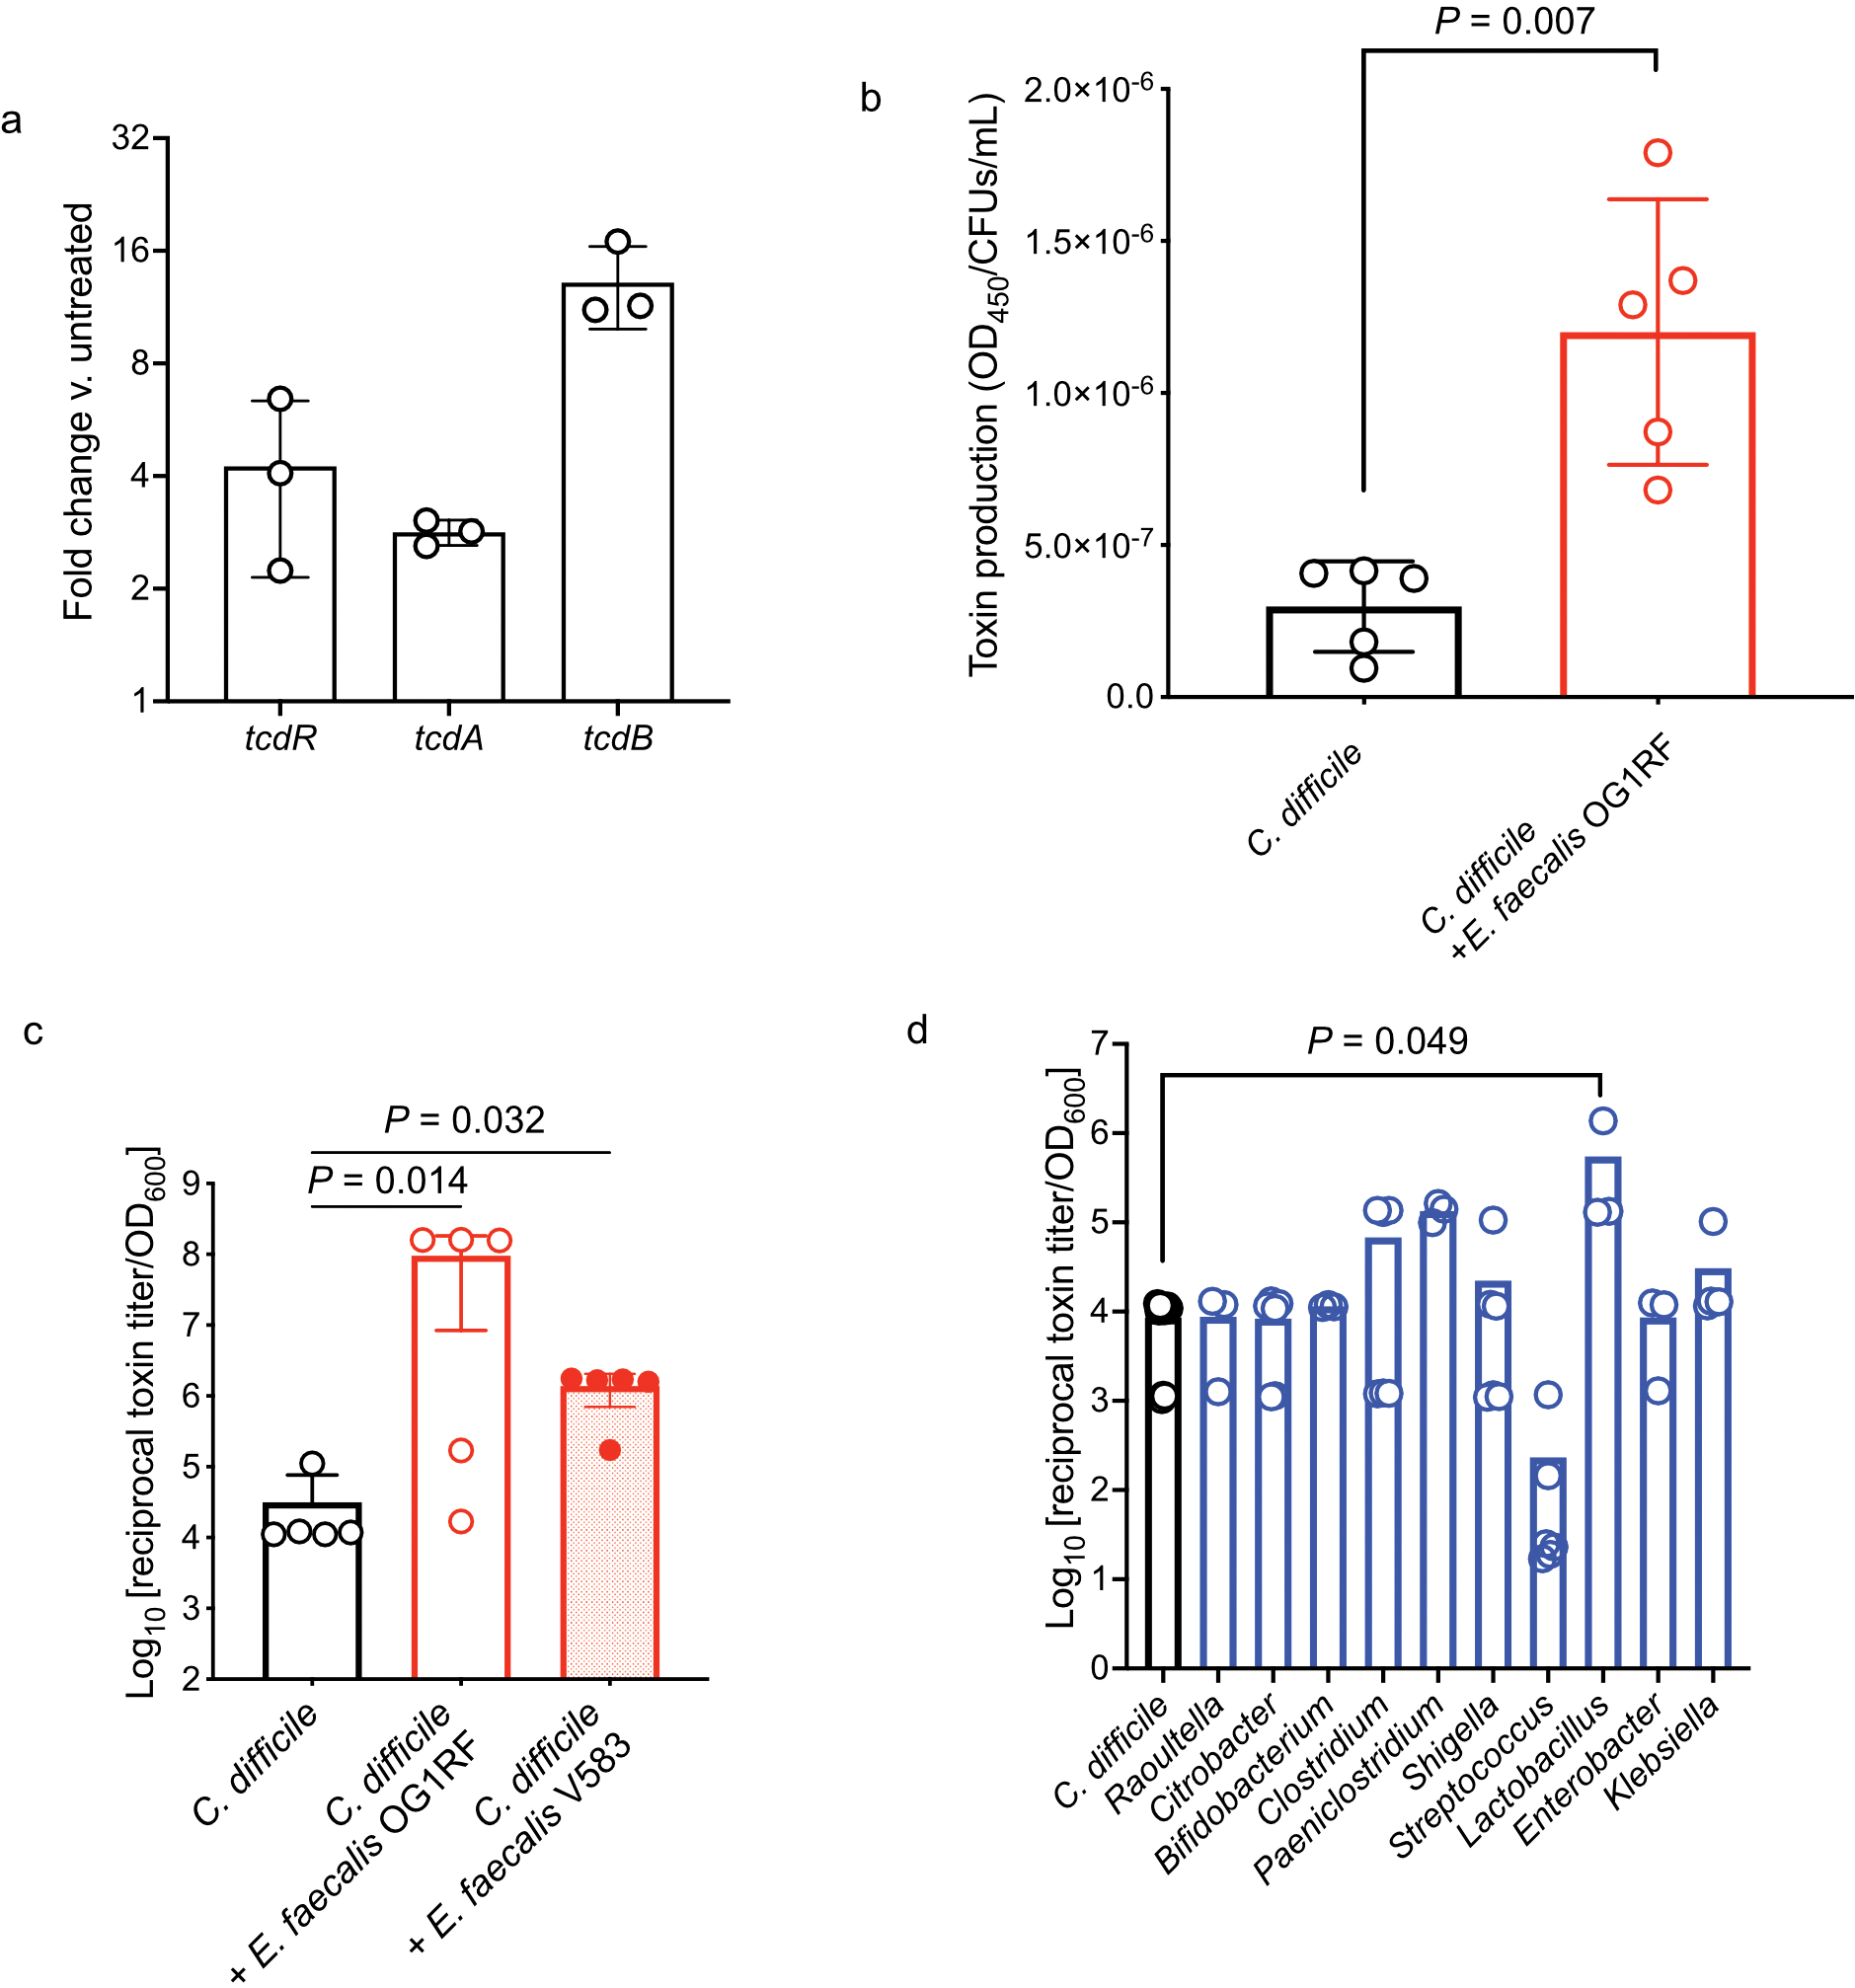
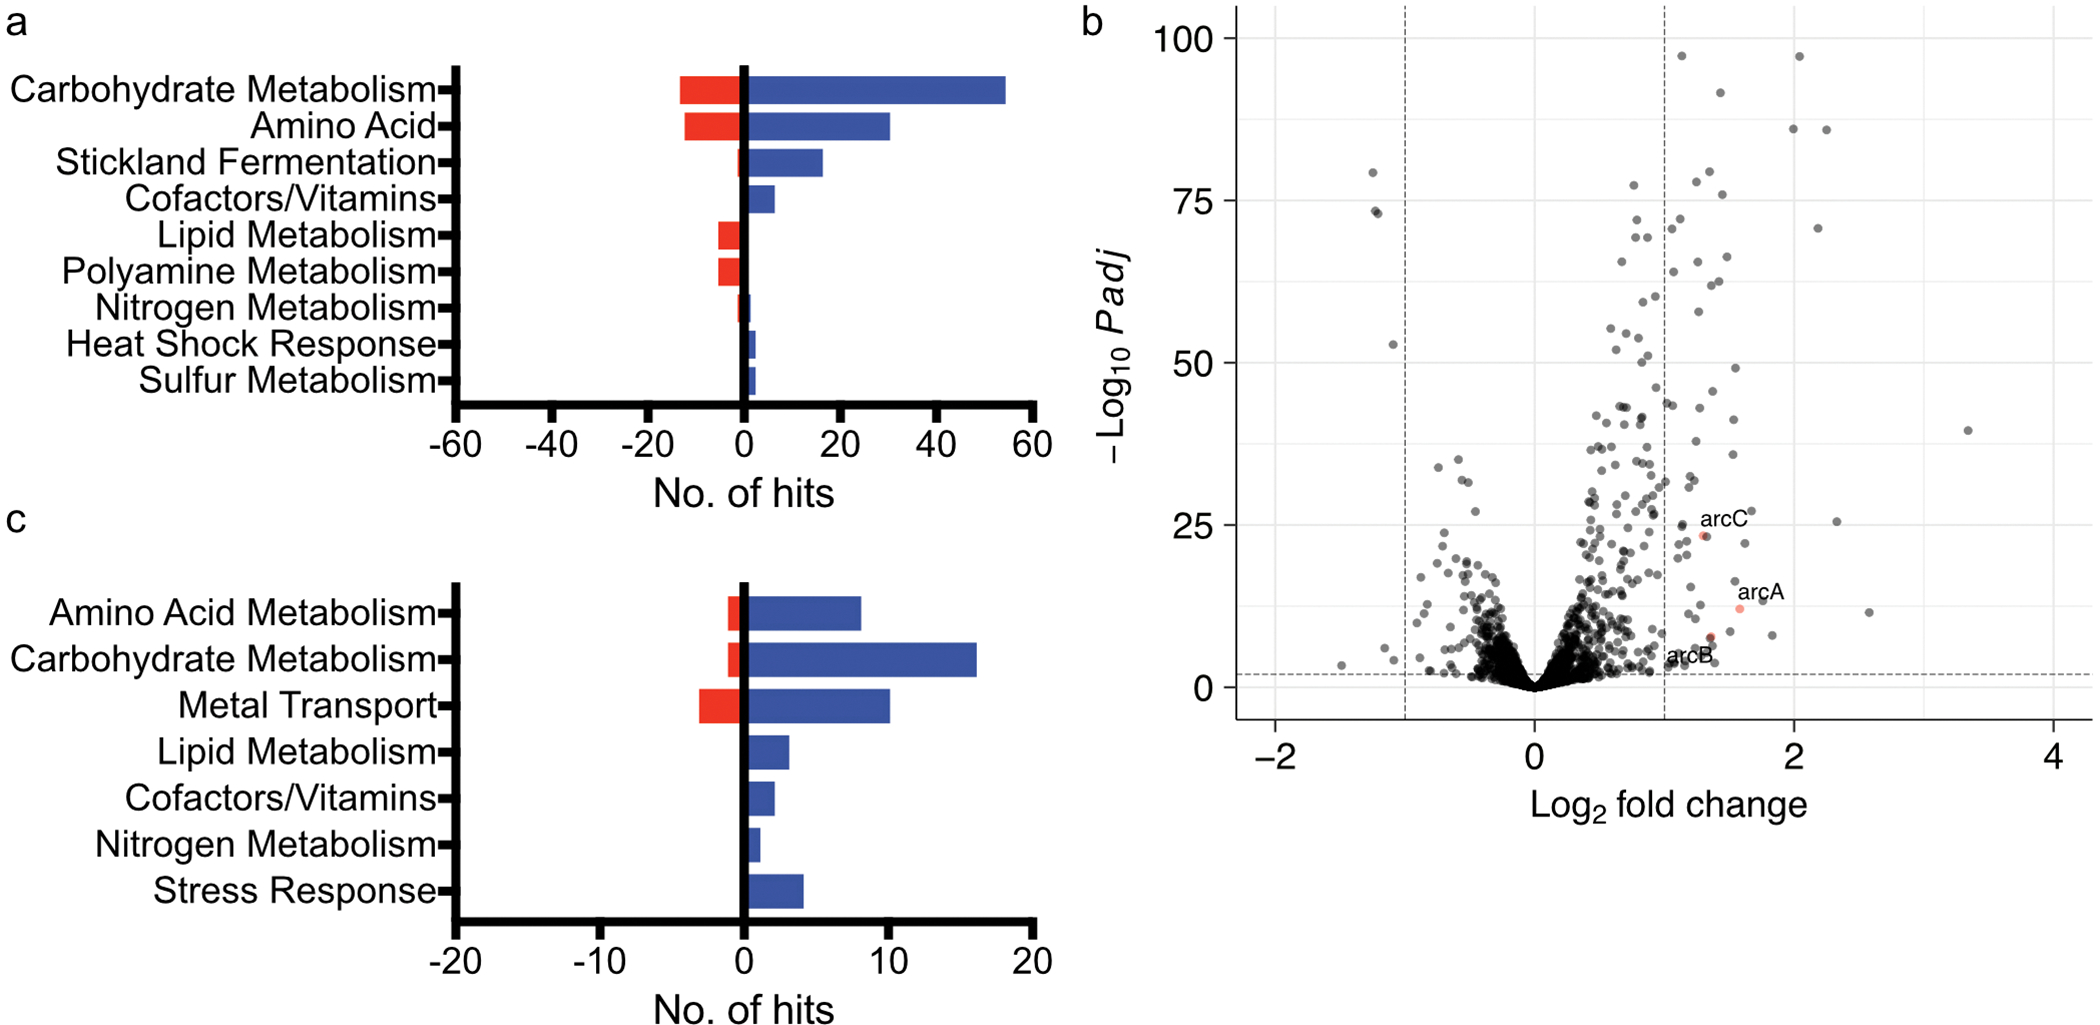
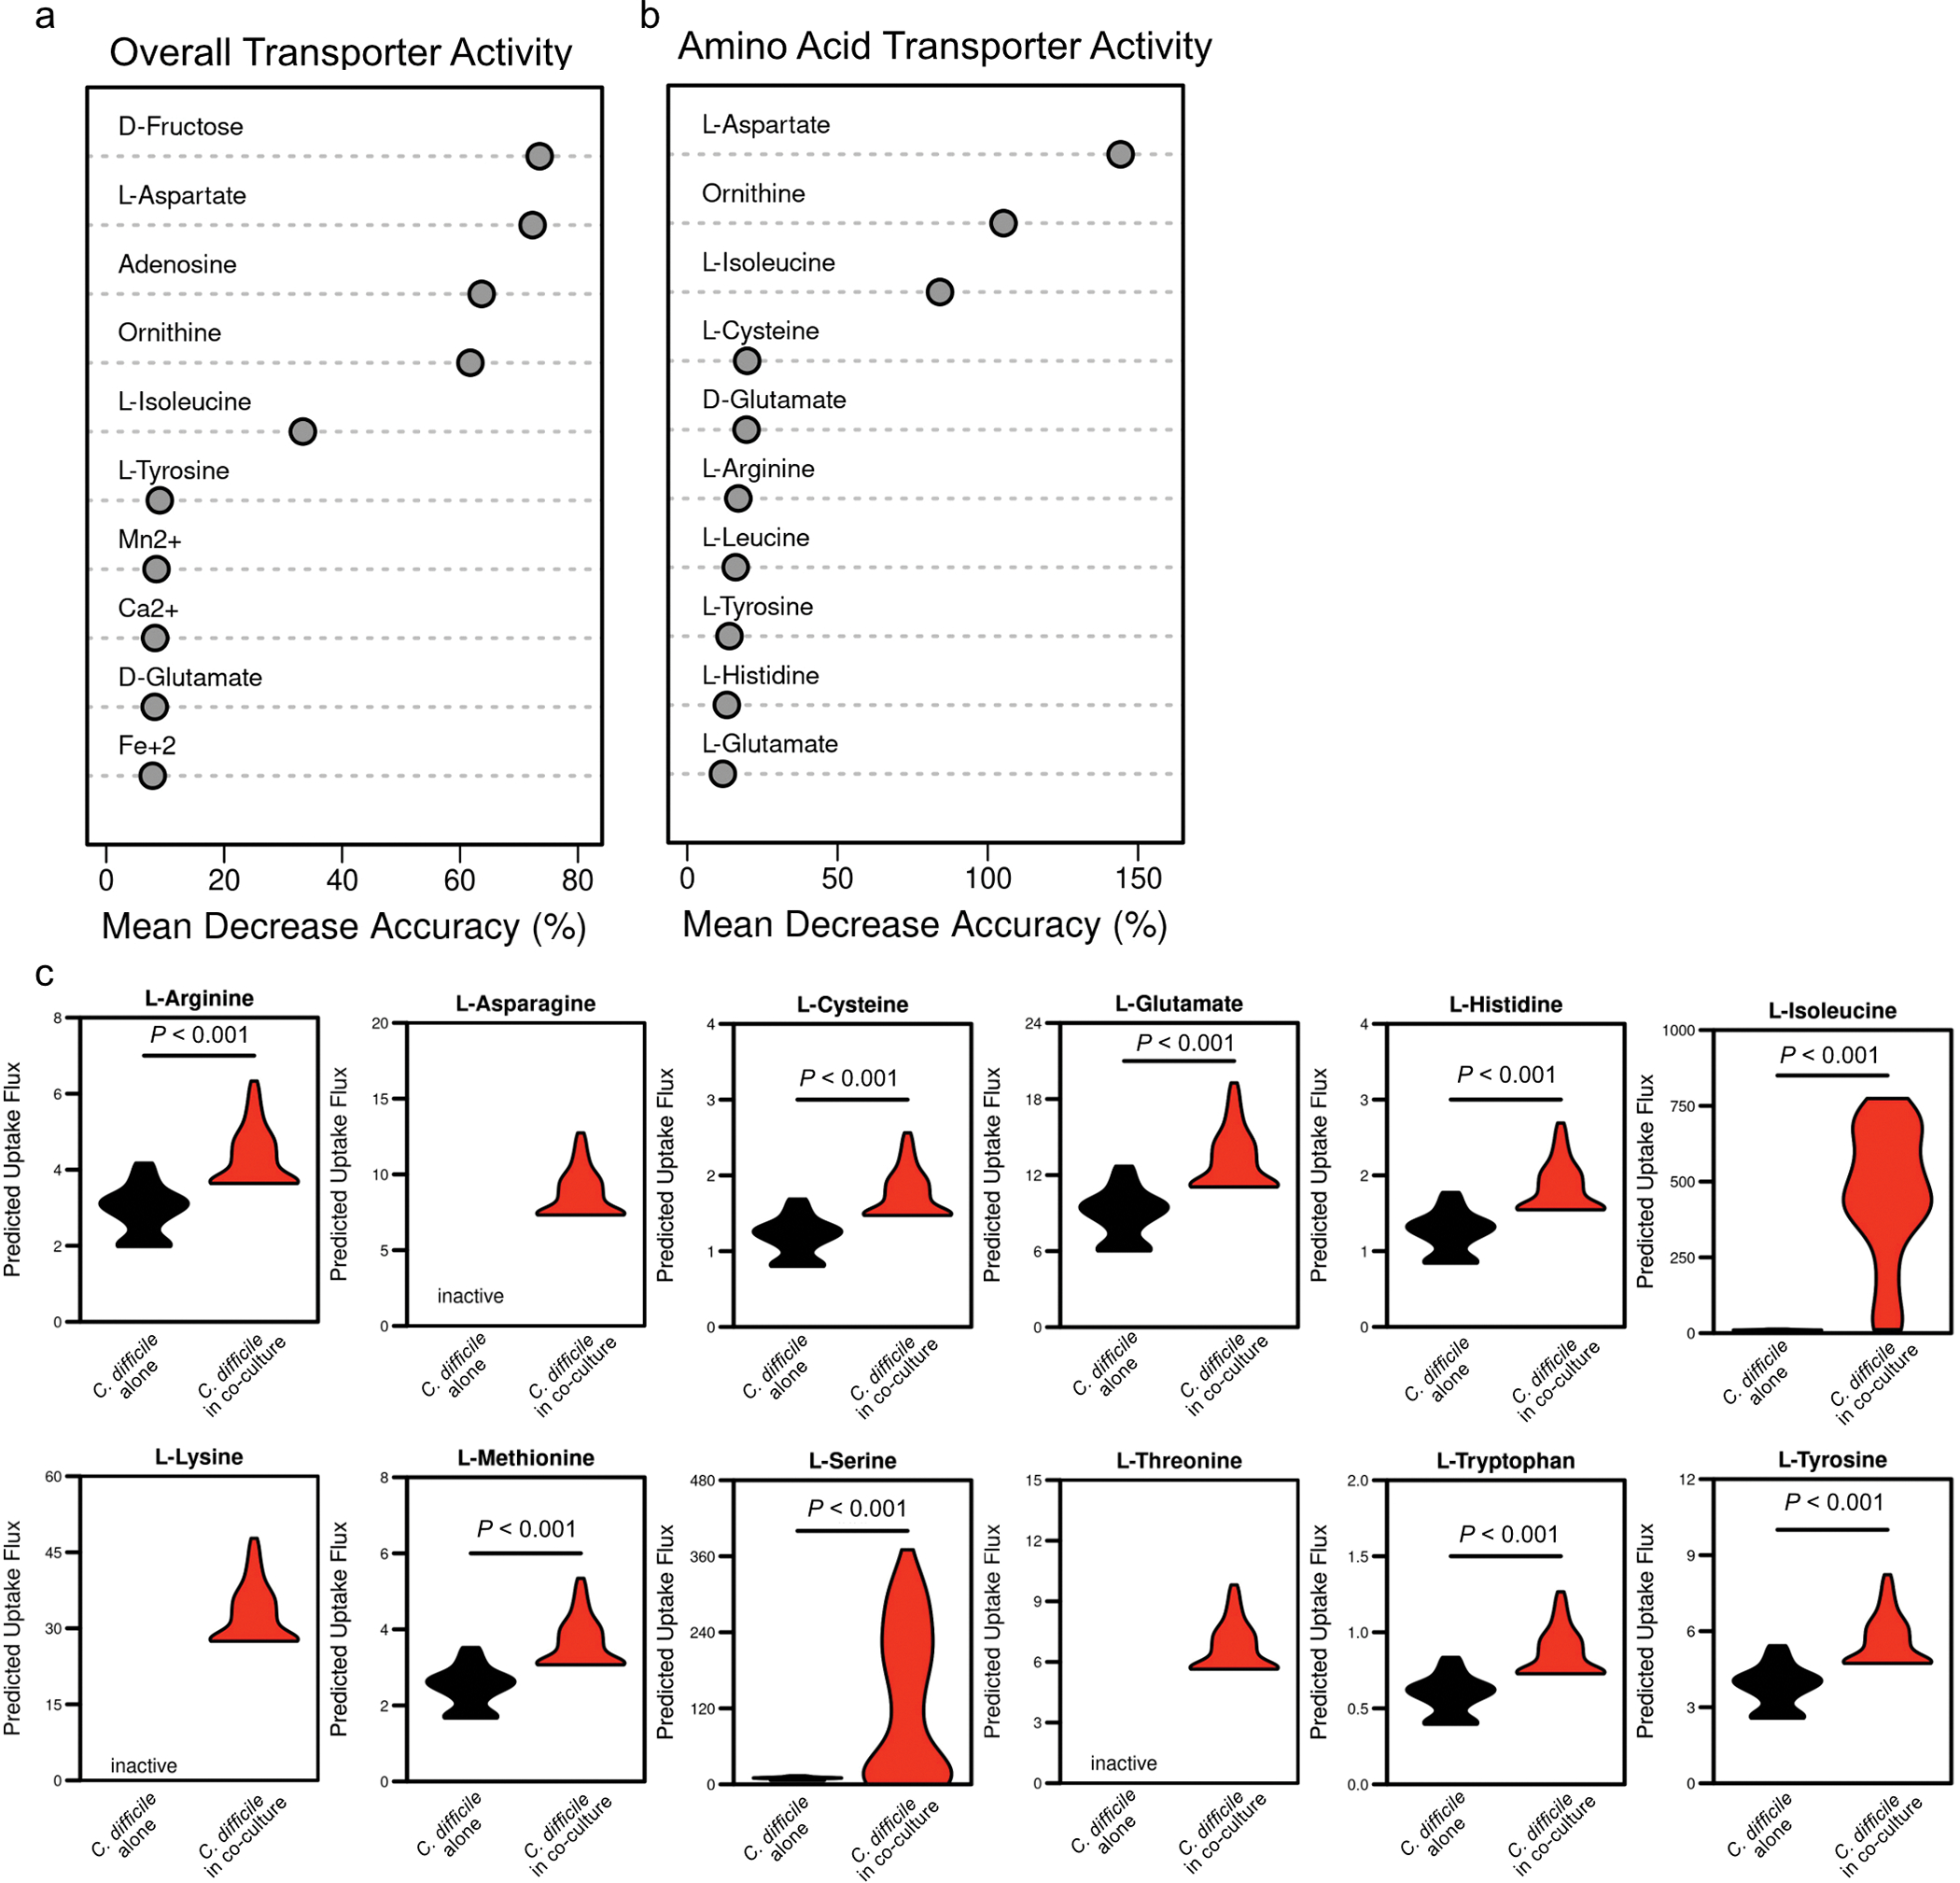
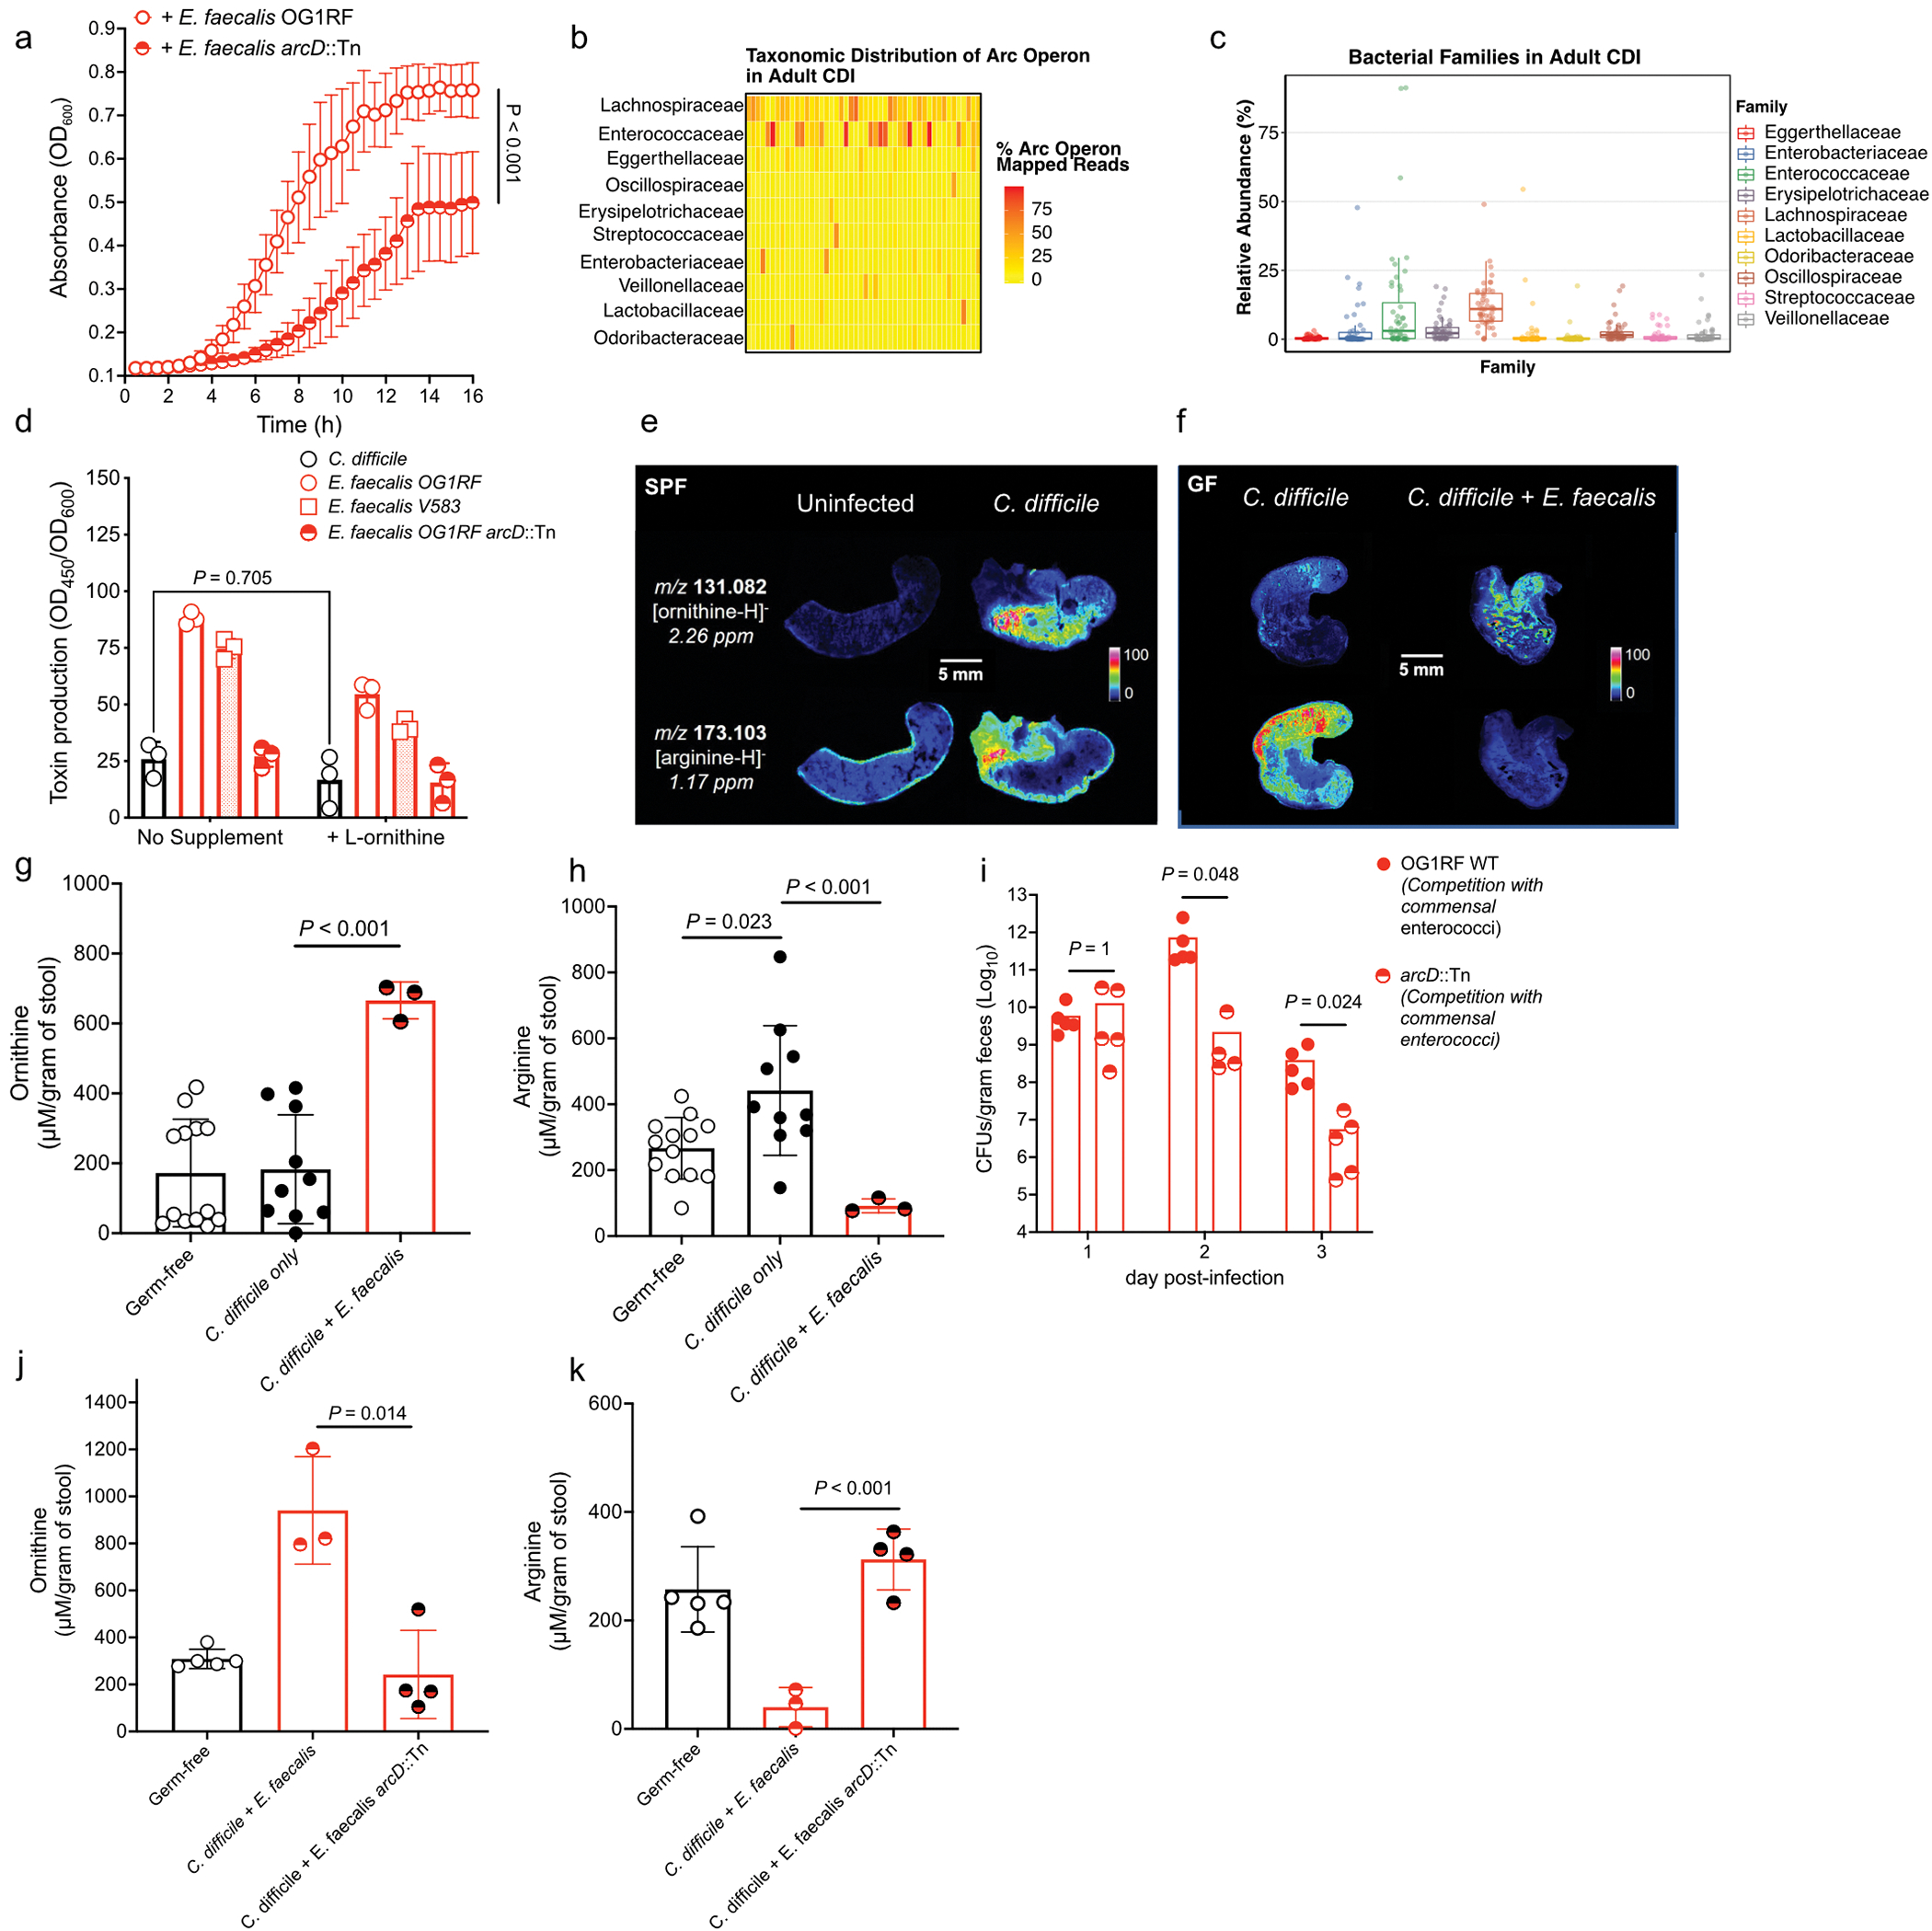
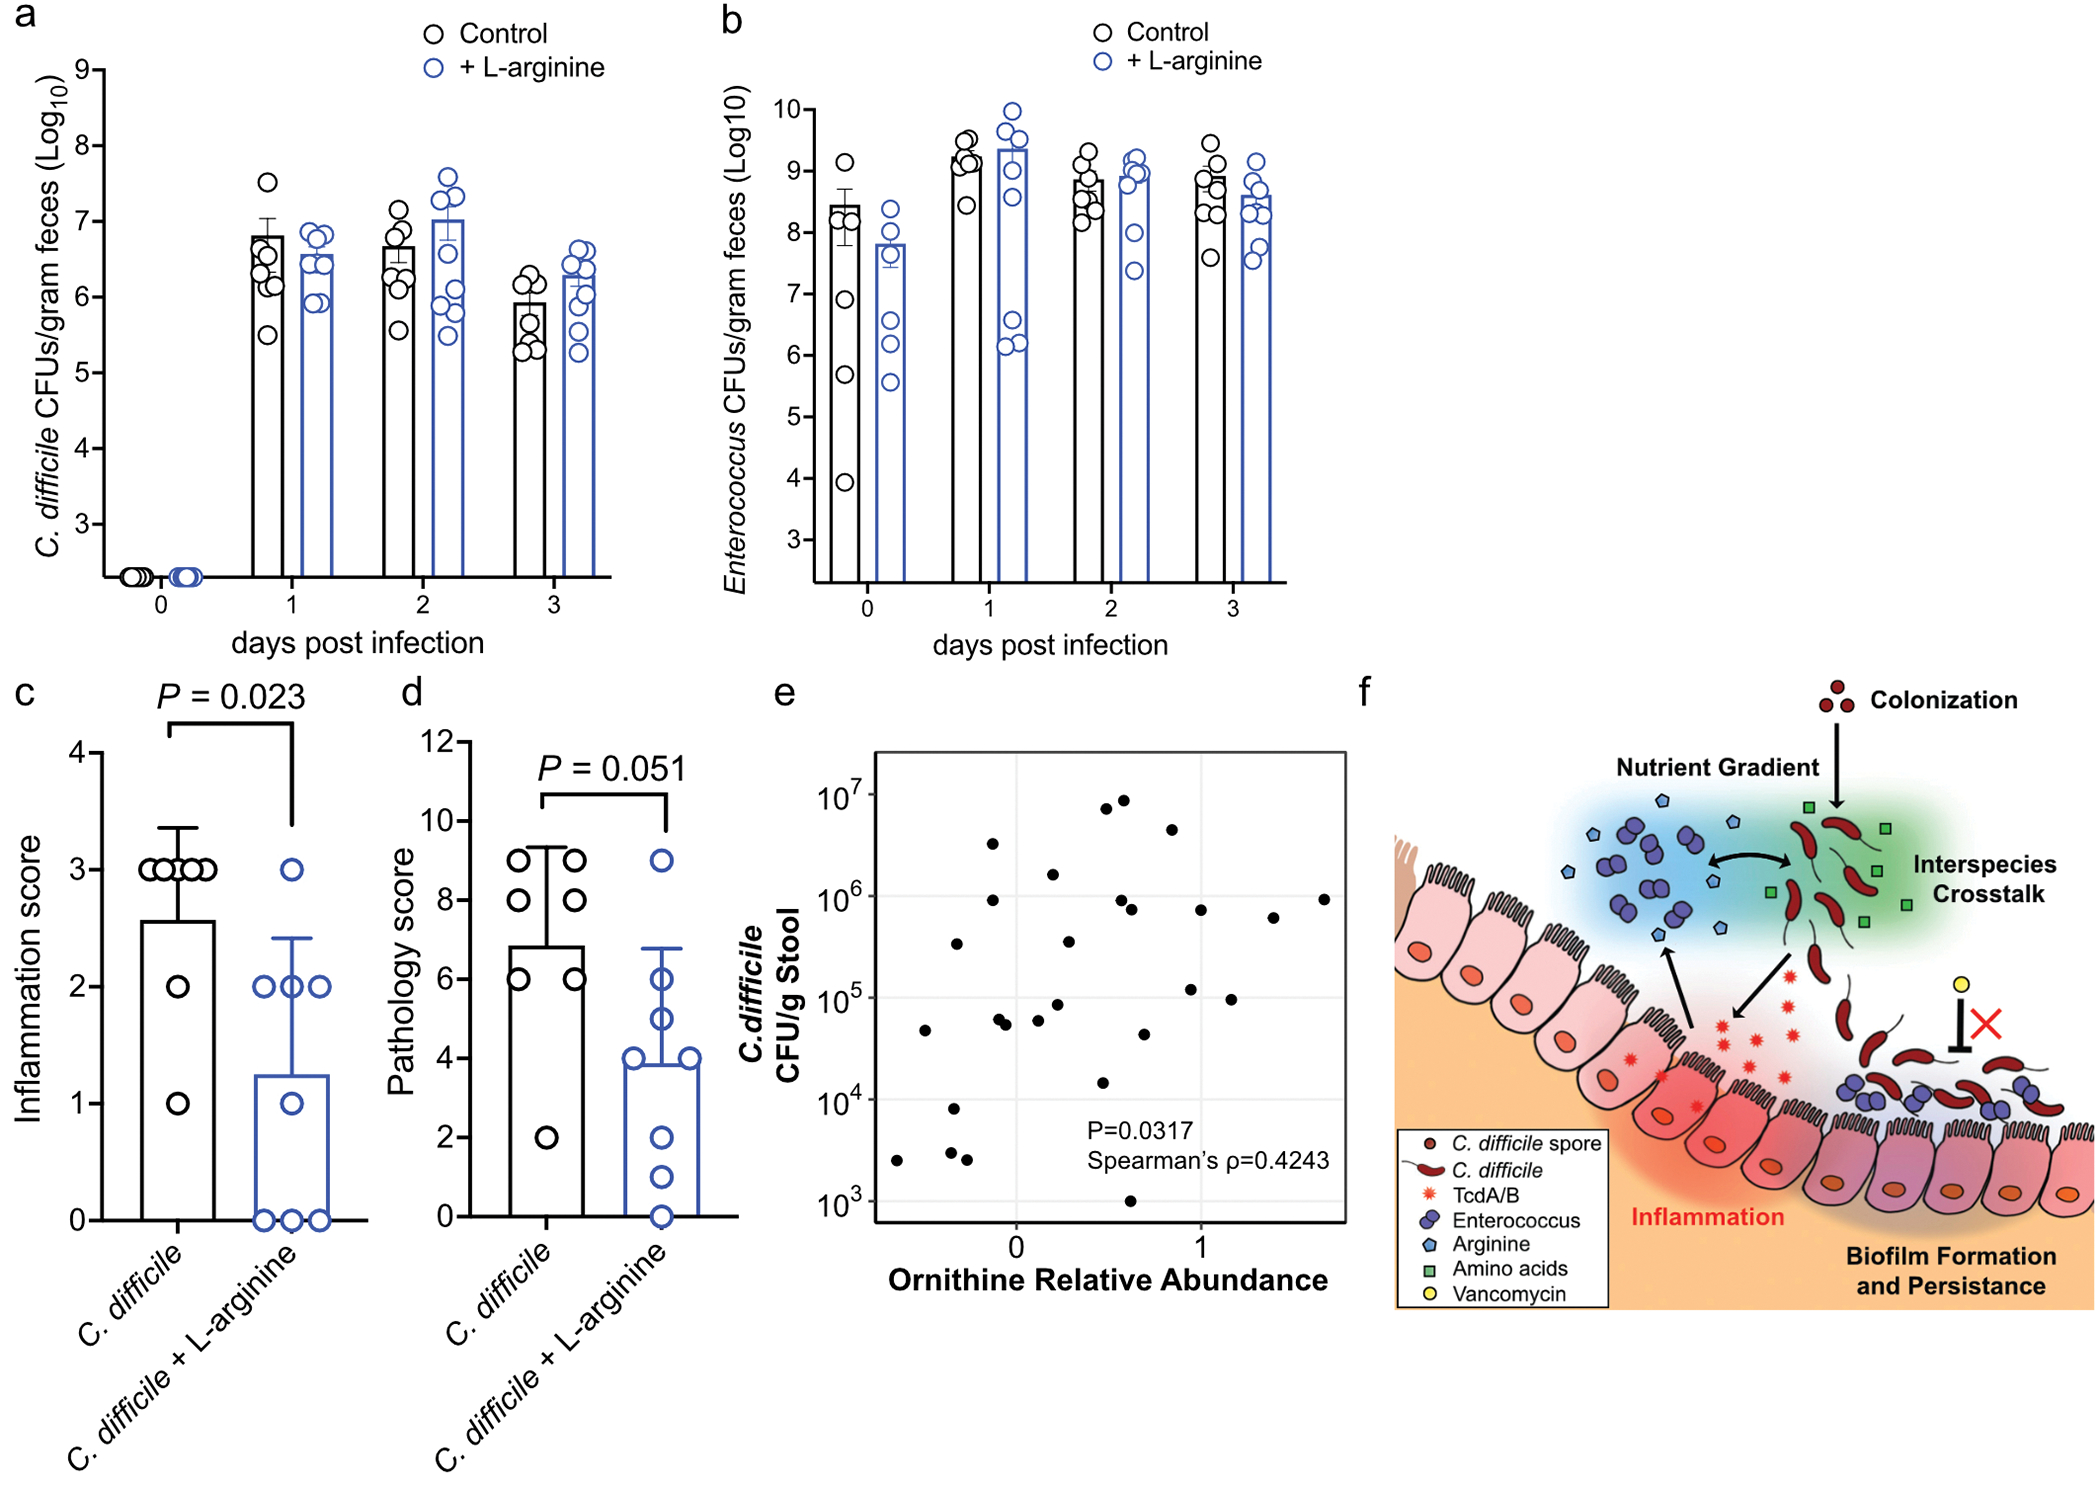
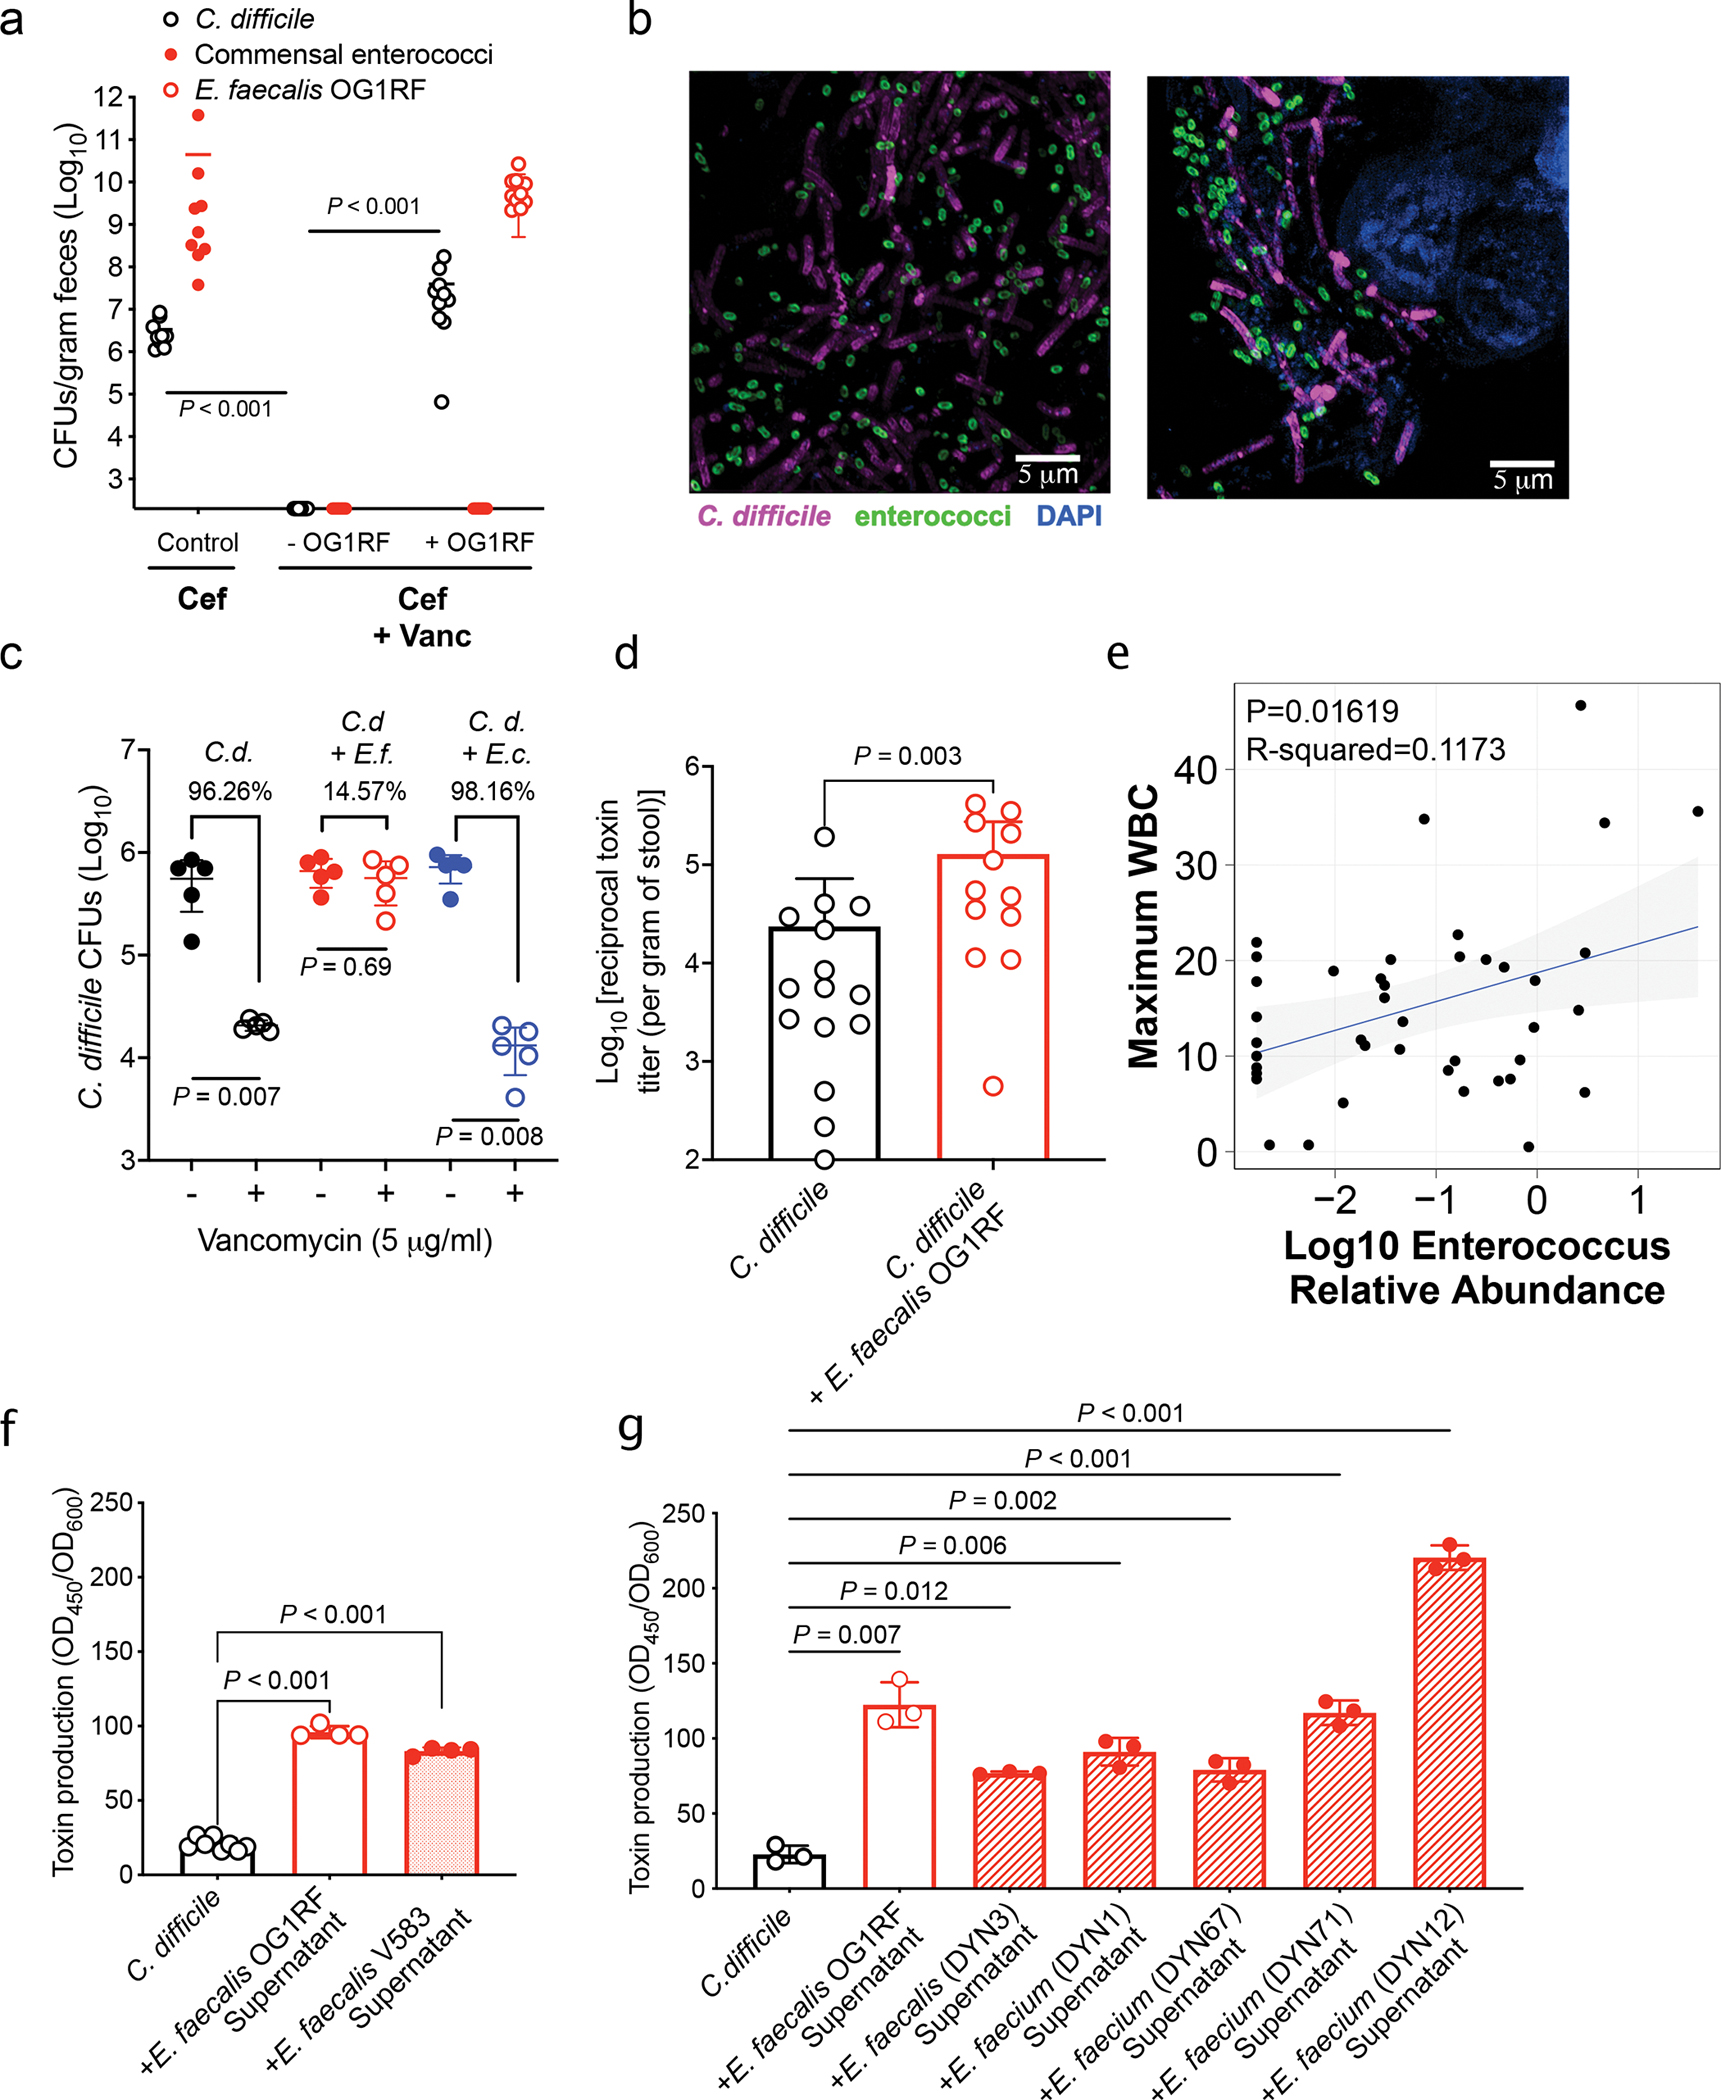
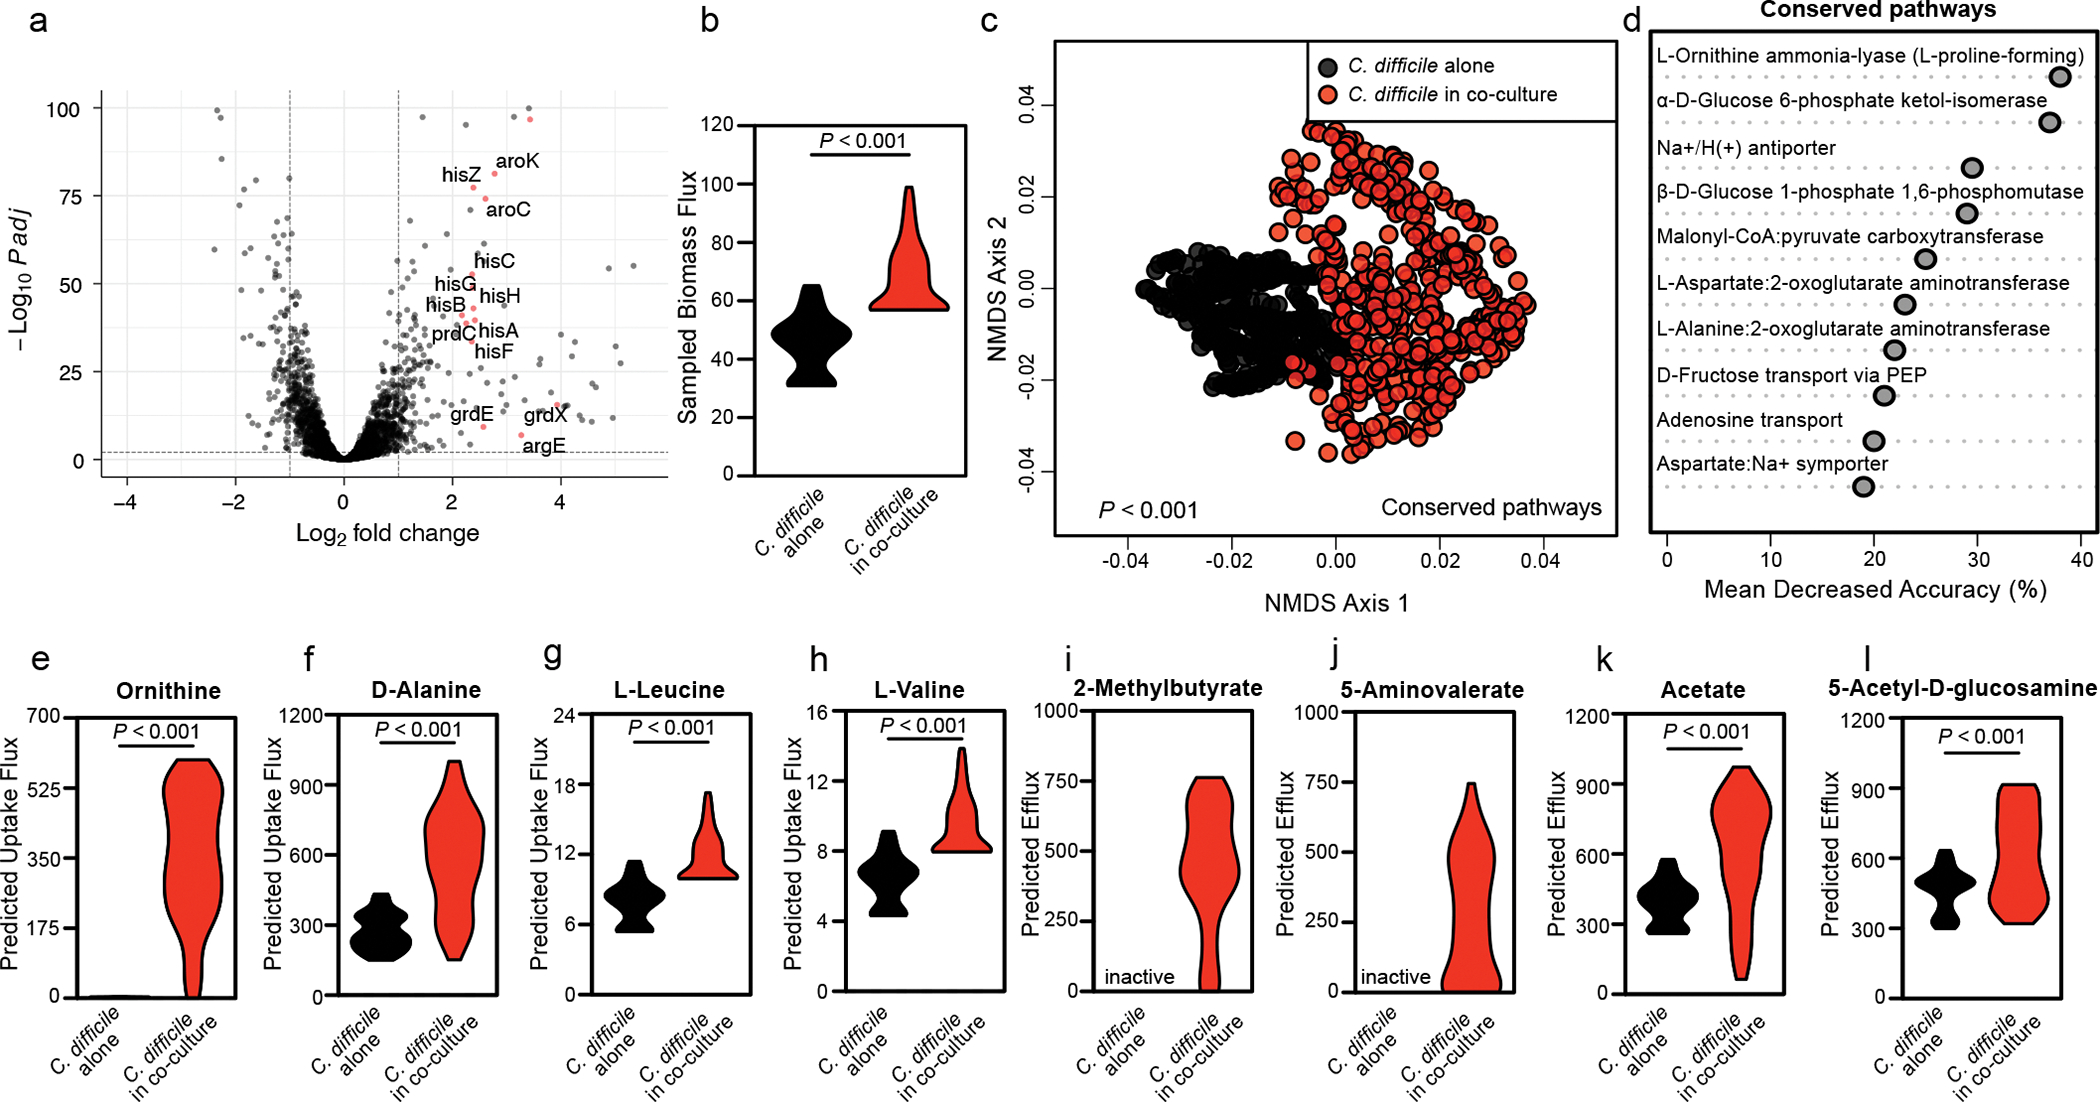
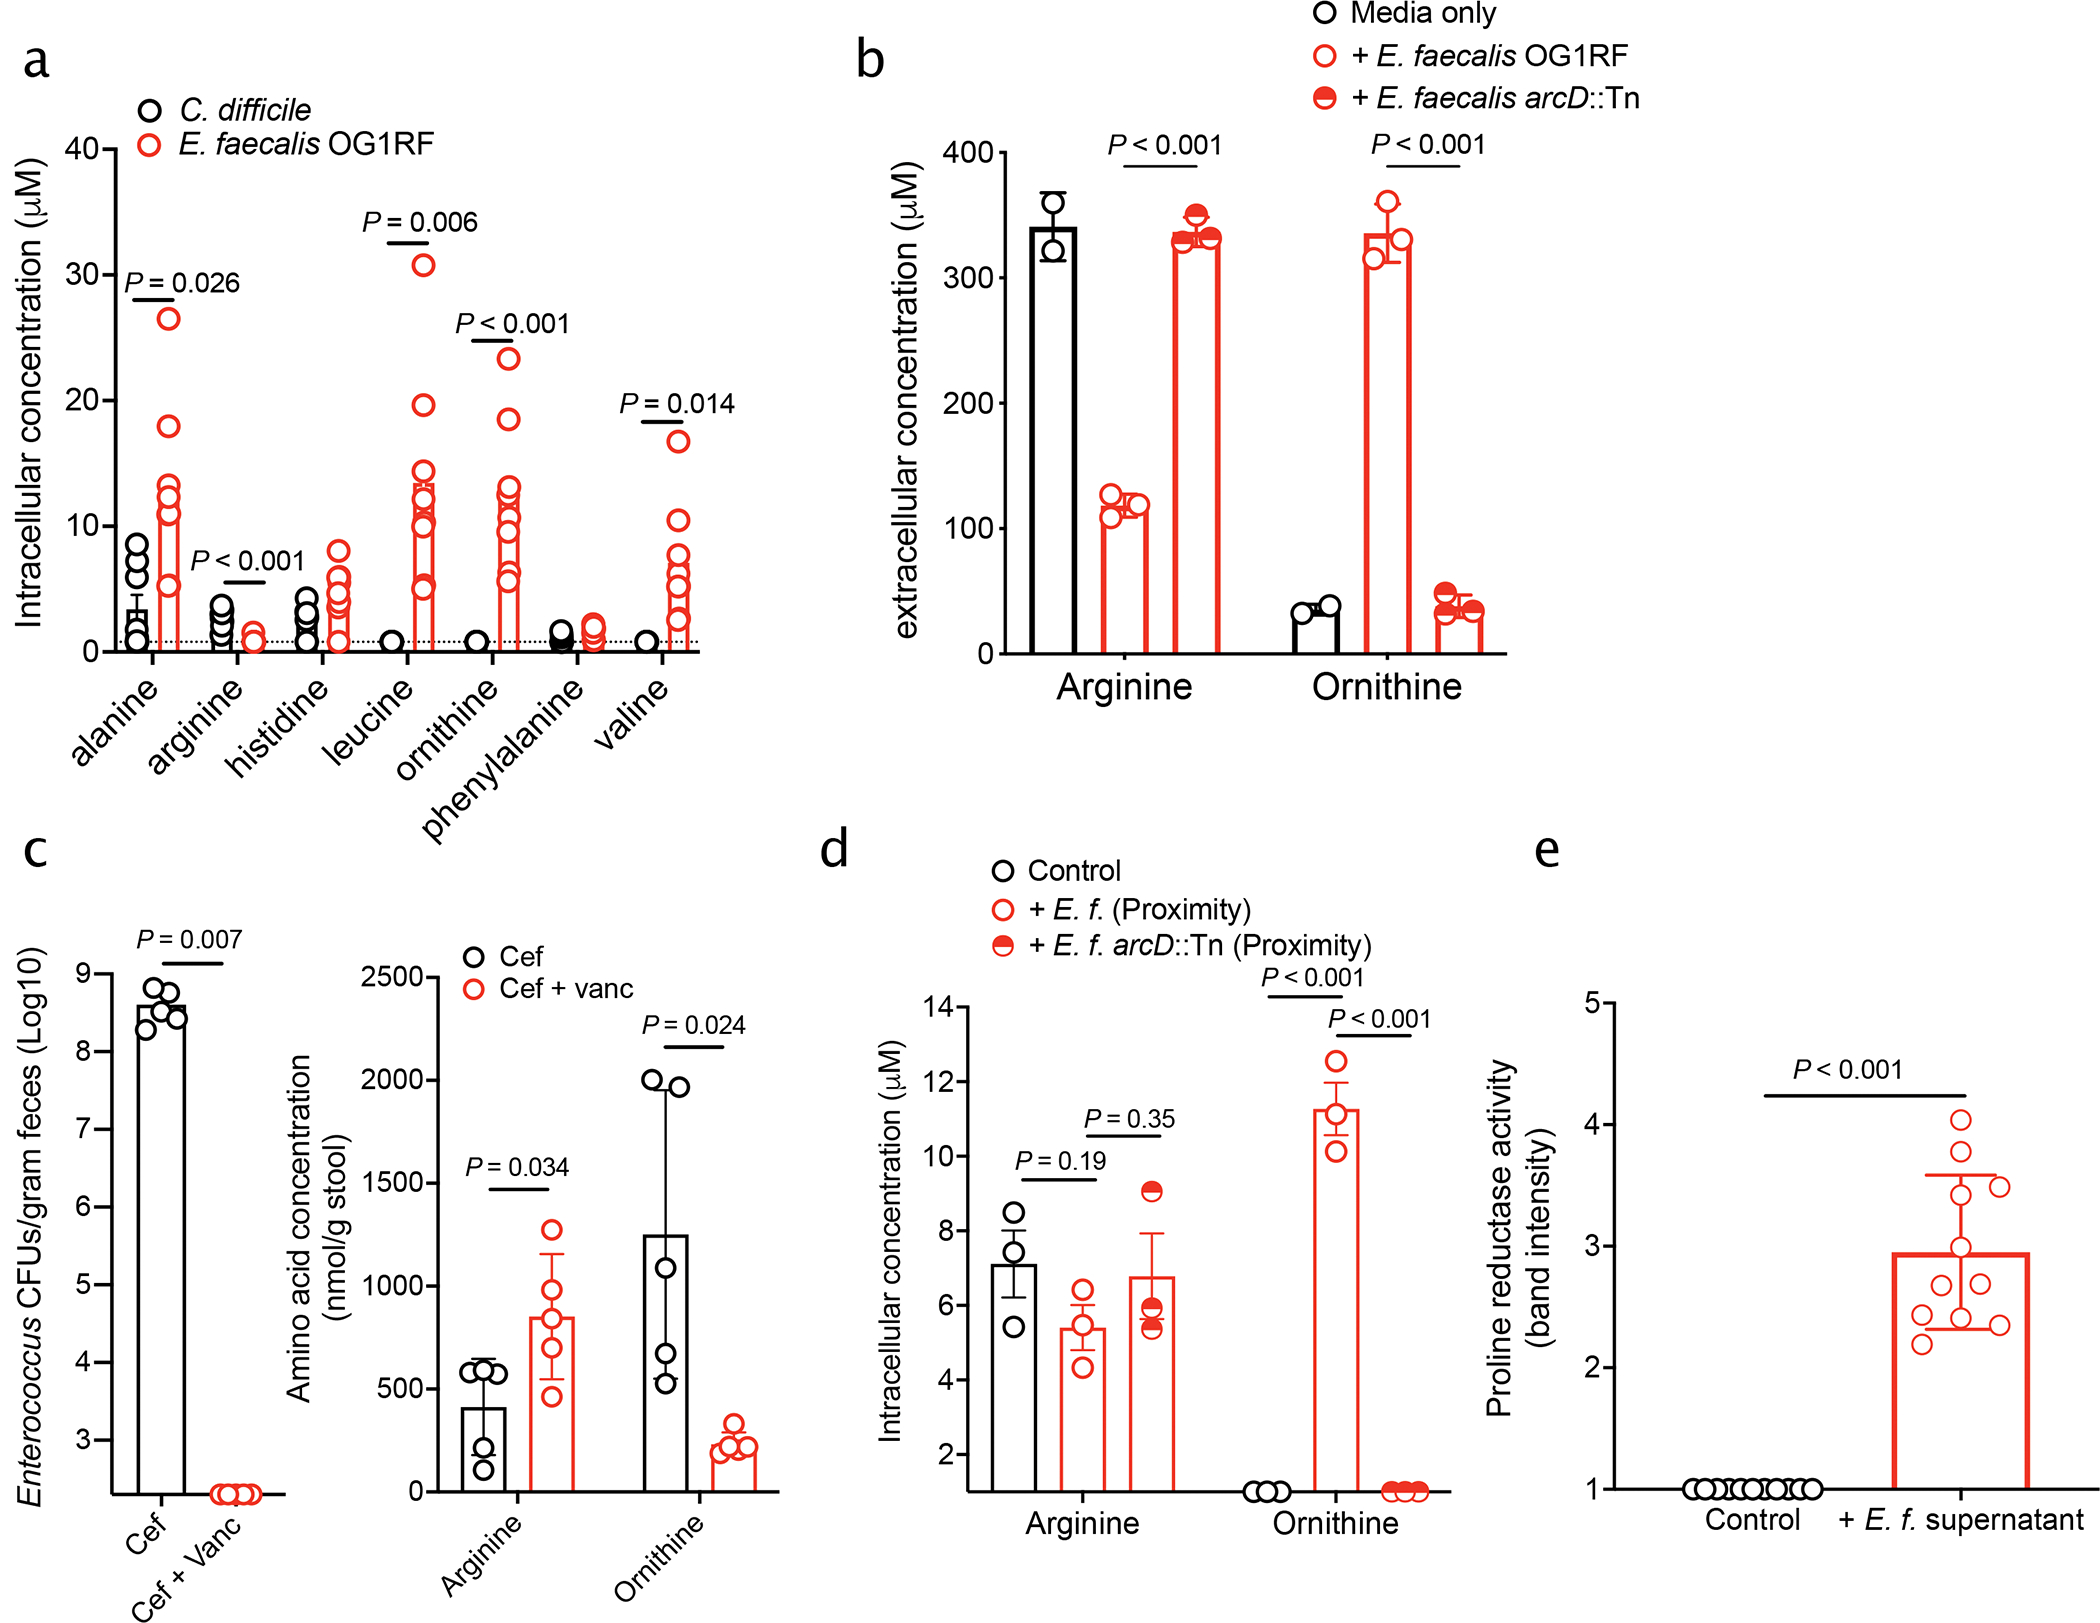
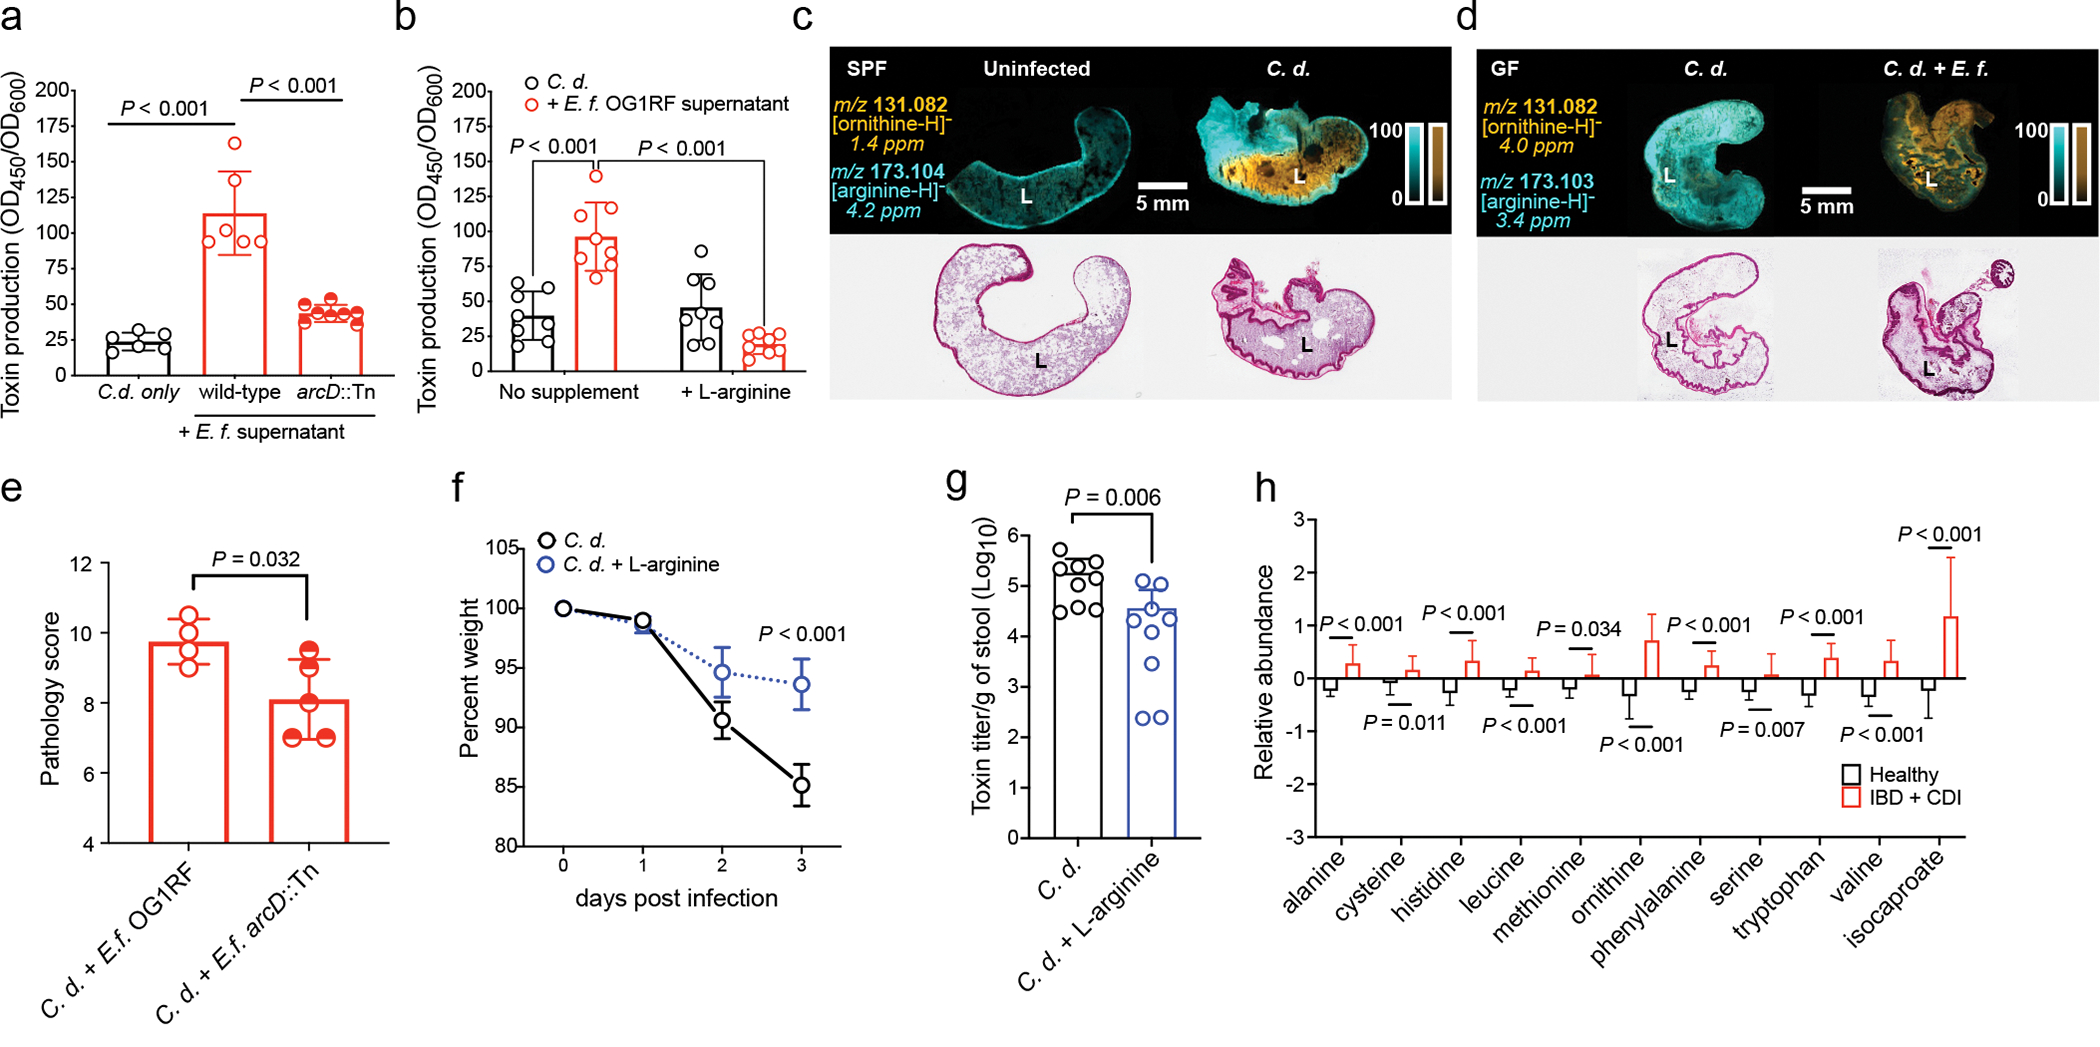
Enteric pathogens are exposed to a dynamic polymicrobial environment in the gastrointestinal tract1. This microbial community has been shown to be important during infection, but there are few examples illustrating how microbial interactions can influence the virulence of invading pathogens2. Here we show that expansion of a group of antibiotic-resistant, opportunistic pathogens in the gut-the enterococci-enhances the fitness and pathogenesis of Clostridioides difficile. Through a parallel process of nutrient restriction and cross-feeding, enterococci shape the metabolic environment in the gut and reprogramme C. difficile metabolism. Enterococci provide fermentable amino acids, including leucine and ornithine, which increase C. difficile fitness in the antibiotic-perturbed gut. Parallel depletion of arginine by enterococci through arginine catabolism provides a metabolic cue for C. difficile that facilitates increased virulence. We find evidence of microbial interaction between these two pathogenic organisms in multiple mouse models of infection and patients infected with C. difficile. These findings provide mechanistic insights into the role of pathogenic microbiota in the susceptibility to and the severity of C. difficile infection.


Conflict of interest statement

Competing interests: Authors declare that they have no competing interests.

Figures

Extended Data Fig. 1
Extended Data Fig. 1. Enterococcal abundance and dynamics during CDI
(a) Enterococcal bacterial burdens (CFUs) from pediatric patients (black and gold = Vanderbilt University (median, n = 24 for Non-CDI controls; n = 34 for CDI, two-sided Mann-Whitney, P=0.004); blue and light blue = Children’s Hospital of Philadelphia (n = 19 for healthy; n = 20 for IBD + CDI, two-sided Mann-Whitney test, P=0.012). (b) Two-sided Spearman correlation between detected C. difficile and Enterococcus burdens in pediatric patients with IBD + CDI (Spearman ρ = 0.551; n = 19). (c) Bacterial burdens quantified from mice following treatment with cefoperazone (cef) or cef + vancomycin (vanc) (mean ± s.e.m., n = 10 mice/group). (d) Enterococcal CFUs over the course of CDI. Mice were infected with a toxin producing wild type strain (M7404 TcdA+TcdB+) or a toxin-null isogenic mutant (M7404 TcdATcdB) (n = 5/group) (mean ± s.e.m. two-sided Mann-Whitney with Bonferroni-Dunn method for correction for multiple comparisons, corrected P values are in Supplementary Table 5).
Extended Data Fig. 2.
Extended Data Fig. 2.. Biofilm formation and transfer of mobile genetic elements during interspecies interactions
(a) Survival assay of co-culture biofilms with E. faecalis (E.f.) (P=0.119) or transposon mutants in E. faecalis genes OG1RF_11528 (fsrB::Tn) (P<0.001) and OG1RF_10423 (prsA::Tn) (P<0.001). Abundance of C. difficile in untreated (−) or vancomycin treated (+) biofilms are depicted (mean ± s.d., n=7, two-sided Mann-Whitney with Bonferroni-Dunn method for correction for multiple comparisons) (b) Abundance of C. difficile (C.d.) and E. faecalis strains (E.f., prsA::Tn, and frsB::Tn) in untreated dual species biofilms (mean ± s.d., n = 3). (c) Clusters of shared sequences detected in C. difficile (blue) and VRE (olive) genomes of clinical isolates from hospitalized patients. Lines connect sequences with at least 99.98% identity. Clusters are labeled based on mobile element type and relevant cargo, if known. Source data for each cluster can be found in Supplementary Information. (d) Biofilm formation of E. faecalis OG1RF carrying empty pMSP3535 vector or pMSP3535 carrying the CD0386-like adhesin. Biofilm formation was tested in standard (P=0.302) and collagen-coated plates (P<0.001). Crystal violet staining (OD550) values were calculated (mean ± s.d., n = 24/group for standard plates and 16/group for collagen plates, unpaired two-tailed t-tests).
Extended Data Fig. 3.
Extended Data Fig. 3.. Enterococcal-mediated enhancement of C. difficile toxin gene expression and production
(a) Fold change of the toxin-encoding genes in C. difficile in coculture with E. faecalis versus monoculture as measured by qPCR (mean ± s.d., n=3). (b) Toxin production by C. difficile when grown in co-culture with E. faecalis as measured by ELISA. Both C. difficile and E. faecalis were grown in the same culture and differential plating was used to measure C. difficile CFUs. Toxin levels (OD450) were normalized to C. difficile CFUs in the culture to control for any difference in growth (mean ± s.d., n = 5, two-tailed t-tests with Welch’s correction, P=0.007). (c) C. difficile toxin levels measured from in vitro cultures by cytotoxicity with E. faecalis cell-free supernatants. (mean ± s.d., n = 5, Kruskal-Wallis test with Dunn’s correction for multiple comparisons, OG1RF P=0.014, V583 P=0.032). (d) C. difficile toxin production measured by cytotoxicity following introduction of cell-free supernatants from microbiota isolates cultured from human patients with CDI and IBD (mean ± s.d., n = 12 (C. difficile), 3 (Raoultella, Bifidobacterium, Enterobacter, Paeniclostridium, Lactobacillus), 5 (Klebsiella), 6 (Citrobacter, Clostridium, Shigella, Streptococcus), Kruskal-Wallis test with Dunn’s correction for multiple comparisons, Lactobacillus P=0.049). Isolates were selected to represent the spectrum of taxa cultured from these patients.
Extended Data Fig. 4.
Extended Data Fig. 4.. Transcriptional changes associated with C. difficileE. faecalis interactions
(a) Pathway analysis of C. difficile transcripts significantly altered following co-culture as measured by RNA sequencing. For pathway analyses, blue bars represent transcripts that increased in abundance and red bars represent transcripts that decreased in abundance. (b) Volcano plot showing E. faecalis transcripts significantly altered following co-culture as measured by RNA sequencing. Red points represent genes associated with amino acid metabolism. Significance determined using two-sided Wald test and corrected for multiple comparisons using the Benjamini-Hochberg method. (c) Pathway analysis of E. faecalis transcripts significantly altered following co-culture as measured by RNA sequencing.
Extended Data Fig. 5.
Extended Data Fig. 5.. Transcriptome-guided metabolic flux predictions using genome-scale metabolic network reconstruction for C. difficile
(a) AUC-Random Forest supervised machine learning results for reaction flux samples for conserved transport reactions between contexts (k = 10; OOB = 0%). (b) AUC-Random Forest supervised machine learning results for reaction flux samples for conserved amino acid transport reactions between contexts (k = 10; OOB = 0%). (c) Difference in simulated uptake of selected amino acids across context-specific models. Significance determined by two-sided Wilcoxon rank-sum test. Corrected P values in Supplementary Table 5.
Extended Data Fig. 6.
Extended Data Fig. 6.. In situ labelling of C. difficile with a hydrazine probe and gel-based profiling of D-proline reductase activity
(a) Labeling schematic of hydrazine probe with PrdA of D-proline reductase. (b) Representative gel-based labelling profiles for C. difficile in the absence and presence of E. faecalis supernatant. Gel representative of three separate experiments. For Gel source data, see Supplementary Fig. 1. (c) Corresponding expression profiles after Coomassie staining.
Extended Data Fig. 7.
Extended Data Fig. 7.. The enterococcal ADI pathway reshapes the metabolic environment in the gut during CDI
(a) C. difficile growth in presence of E. faecalis or E. faecalis arcD::Tn supernatants. (mean ± s.d., n = 8/group, two-way ANOVA, Time factor P<0.001). (b) Taxonomic distribution (at bacterial family level) of reads mapped to arc genes in adult patients (n=48) with symptomatic CDI. Each column is a subject and each row is a bacterial family. Each cell displays the percentage of reads mapped to arc genes of a specific family out of all arc mapped reads. (c) Relative abundance of the top 10 arc operon containing bacterial families in each adult patient symptomatically infected with C. difficile (n=48, lower and upper hinges correspond to the first (25%) and third (75%) quartiles. The upper and lower whiskers extend from the hinge to the largest value no further than 1.5*IQR. Data beyond the whiskers are plotted individually). (d) Toxin production of C. difficile following introduction of supernatants from E. faecalis and addition of exogenous L-ornithine measured by ELISA (mean ± s.d., n = 3, Tukey’s multiple comparisons test, C. difficile +/− ornithine P=0.705). (e) MALDI-IMS image of uninfected or infected mice (3d post-infection) (SPF) (representative of n = 5 mice) or (f) GF mice mono-infected with C. difficile CD196 or co-infected with E. faecalis OG1RF (2d post-infection) (representative of n = 4 mice). Individual heatmaps of arginine and ornithine. (g) Ornithine levels in stool measured by targeted metabolomics in GF mice infected with C. difficile only (mean ± s.d., n = 10) or C. difficile + E. faecalis OG1RF (mean ± s.d., n = 3, two-sided t-tests with Welch’s correction, P<0.001). Metabolomics were performed on GF mice prior to infection (GF group, n = 13). (h) Arginine levels in stool of GF mice infected with C. difficile only (mean ± s.d., n = 10, two-sided t-test with Welch’s correction, P=0.023) or C. difficile + E. faecalis OG1RF (mean ± s.d., n = 3, two-sided t-test with Welch’s correction, P<0.001). Stool metabolomics performed prior to infection (GF group, n = 13). (i) CFU of E. faecalis OG1RF (wild type) or E. faecalis arcD::Tn during CDI. Each strain introduced prior to CDI and naturally competed with endogenous enterococci (n = 5/group) (mean ± s.e.m. two-sided Mann-Whitney test with Bonferroni-Dunn method for correction for multiple comparisons, day 2 P=0.048, day 3 P=0.024). (j) Ornithine (P=0.014) and (k) arginine (P<0.001) levels in stool measured by targeted metabolomics in GF mice infected with C. difficile. Mice pre-colonized for 1 day with E. faecalis (n = 3) or E. faecalis arcD::Tn (n = 4) (mean ± s.d.. two-sided t-tests with Welch’s correction). Metabolomics performed on GF mice prior to infection (GF group, n = 5).
Extended Data Fig. 8.
Extended Data Fig. 8.. Arginine supplementation decreases C. difficile pathogenesis in mice
(a) C. difficile and (b) Enterococcus burdens quantified from mice following cefoperazone treatment and subsequent infection. Mice were treated with 2% L-arginine in drinking water starting 2 days prior to infection and subsequently during the course of infection (mean ± s.d.. n = 7 for control, n = 8 for L-arginine treated; Mann-Whitney with Bonferroni-Dunn method for correction for multiple comparisons for each comparison). (c) Inflammation score (P=0.023) and (d) cumulative pathology score (P=0.051) measured 3 days post-infection for control (n = 7) and L-arginine treated (n = 8) mice (mean ± s.d.. two-sided t-tests with Welch’s correction). (e) Spearman correlation between ornithine abundance in stool and C. difficile burdens in pediatric patients with IBD and CDI with detectable C. difficile based on culture (two-sided Spearman’s ρ = 0.4243; n = 26). (f) Proposed model of multifaceted cooperative interactions between enterococci and C. difficile during infection.
Fig. 1.
Fig. 1.. Enterococci promote C. difficile fitness and pathogenesis.
(a) Bacterial burdens (CFUs) for endogenous enterococci measured day of C. difficile inoculation. C. difficile burdens measured on first day post-inoculation to determine success of initial colonization. Burdens calculated following cefoperazone (cef) or cef + vancomycin (vanc) treatment (mean ± s.d., n = 10/group, two-sided Mann-Whitney for each comparison, P<0.001). (b) FISH image in lumen (left) or associated with the mucosa (right) during mouse infection. (c) CFUs from C. difficile CD196 (C.d.) monoculture or co-culture (E. faecalis = E.f., E. coli = E.c.) biofilms. Biofilms treated with vehicle (−) or vancomycin (+). Percent killing shown vs. untreated (mean ± s.d., n=5, two-sided Mann-Whitney test, C.d.: P = 0.007; C.d. + E.f:. P = 0.69; C.d. + E.c.: P = 0.008). (d) C. difficile toxin titers from mice infected with C. difficile or C. difficile + E. faecalis OG1RF following cef + vanc treatment (mean ± s.d., n = 15 for C. difficile only and n = 12 for C. difficile + E. faecalis, two-sided Mann-Whitney test, P=0.003). (e) Linear regression relating peripheral WBC to Log10 Enterococcus 16S rRNA relative abundance (95% confidence interval shown, n = 41, P = 0.017). Two-sided Spearman correlation was also performed and showed a positive correlation between WBC and Enterococcus relative abundance (Spearman ρ = 0.252; n = 41). (f) C. difficile toxin levels measured by ELISA following growth with E. faecalis supernatants (mean ± s.d., n = 8 for C. difficile only and n = 4 for E. faecalis OG1RF and E. faecalis V583, one-way Welch ANOVA, P<0.001). (g) C. difficile toxin ELISA following introduction of cell-free supernatants from enterococci isolated from pediatric patients with IBD + CDI (mean ± s.d., n = 3/group, one-way Welch ANOVA, P<0.02, exact P values in Supplementary Table 5).
Fig. 2.
Fig. 2.. Context-specific GENRE analysis of C. difficile CD196 reveals significant metabolic shifts when in coculture with Enterococcus.
(a) Volcano plot showing C. difficile transcripts altered following co-culture measured by RNA sequencing. Significance determined using two-sided Wald test and corrected for multiple comparisons using the Benjamini-Hochberg method. Red points denote genes associated with amino acid metabolism. (b) Samples of metabolic flux states with biomass synthesis as the objective function in each context-specific model. Significant difference calculated by two-sided Wilcoxon rank-sum test (P<0.001). (c) Non-metric Multidimensional Scaling of Bray-Curtis dissimilarities for flux samples of all shared reactions across both experimental contexts. Significant difference determined by one-way PERMANOVA (P=0.001). (d) AUC-Random Forest supervised machine learning results highlighting reactions that differentiate flux distributions during C. difficile growth and C. difficile growth in the context of E. faecalis (k = 10; OOB = 0%). (e-h) Difference in simulated uptake of (e) L-ornithine (P<0.001), (f) D-alanine (P<0.001), (g) L-leucine (P<0.001), or (h) L-valine (P<0.001) across context-specific models. (i-l) Difference in (i) 2-methylbutyrate, (j) 5-aminovalerate, (k) acetate (P<0.001), and (l) N-acetyl-D-glucosamine (P<0.001) efflux across context-specific models. Significance determined by two-sided Wilcoxon rank-sum test.
Fig. 3.
Fig. 3.. Amino acid cross-talk is central to Enterococcus-C. difficile interactions.
(a) Amino acid abundance measured in macrocolonies (mean ± s.d., n = 8/group, multiple two-sided t-tests with Bonferroni-Dunn method for correction for multiple comparisons, corrected P values in Supplementary Table 5). Dotted line indicated limit of detection. (b) Arginine and ornithine levels measured in cell-free supernatants of E. faecalis OG1RF or E. faecalis OG1RF arcD::Tn (mean ± s.d., n=2 media only, n = 3 +E. faecalis and +E. faecalis ArcD::Tn, multiple two-sided t-tests with Bonferroni-Dunn method for correction for multiple comparisons. OG1RF vs. arcD::Tn: Ornithine: P < 0.001; Arginine: P < 0.001). (c) Enterococcus burdens (left) and arginine and ornithine levels (right) on day of C. difficile infection quantified from stool of mice treated with cef or cef + vanc. (mean ± s.d., n = 5/group, two-sided Mann-Whitney used for Enterococcus burdens, multiple two-sided t-tests with Bonferroni-Dunn method for correction for multiple comparisons used for amino acids. Corrected P in Supplementary Table 5). (d) Arginine and ornithine levels quantified from C. difficile macrocolonies plated in proximity of E. faecalis or E. faecalis arcD::Tn macrocolonies (mean ± s.d., n = 3/group, multiple two-sided t-tests with Bonferroni-Dunn method for correction for multiple comparisons. Corrected P values in Supplementary Table 5). (e) Band intensity of fluorescently-labeled PrdA from lysates of C. difficile grown either in fresh BHIS media or in media supplemented with E. faecalis OG1RF supernatants run on SDS-PAGE (mean ± s.d., n=11/group, two-sided t-test with Welch’s correction, P<0.001).
Fig. 4.
Fig. 4.. E. faecalis ADI pathway enhances C. difficile virulence.
(a) C. difficile CD196 toxin production measured by ELISA (mean ± s.d., n = 6 C. d. only and OG1RF supernatant, n=8 arcD::Tn, two-sided t-tests with Welch’s correction) and (b) supplementation with L-arginine (mean ± s.d., n = 8/group, Tukey’s multiple comparison test) (C.d. = C. difficile; E.f. = E. faecalis). Corrected P values in Supplementary Table 5. (c) MALDI-IMS image of ornithine and arginine in uninfected or infected mice (3 d post-infection) (SPF) (representative of n = 5 mice) or (d) GF mice mono-infected with C. difficile CD196 or co-infected with E. faecalis OG1RF (2d post-infection) (GF) (representative of n = 4 mice). Corresponding hematoxylin and eosin stained tissue displayed. “L” = lumen. (e) Pathology score from cecum of GF mice pre-colonized with E. faecalis OG1RF (n = 4) or E. faecalis arcD::Tn (n = 5) and subsequently infected with C. difficile (mean ± s.d., two-sided t-tests with Welch’s correction, P=0.032). (f) Percent weight of mice infected with C. difficile CD196 and treated with 2% L-arginine in drinking water (mean ± s.d., n = 9/treatment group, two-way ANOVA with Bonferroni’s multiple comparison test, day 3 P<0.001). (g) C. difficile toxin titers from mice infected with C. difficile and treated with 2% L-arginine in their drinking water (mean ± s.d., n = 9/treatment group, two-sided Mann-Whitney test, P=0.006). Stool toxin titers measured by cytotoxicity. (h) Relative abundance of select amino acids and isocaproate in feces of pediatric patients with IBD and CDI (mean ± s.d., n = 20) or healthy controls (mean ± s.d., n = 19, multiple two-sided t-tests with Bonferroni-Dunn method for correction for multiple comparisons. Corrected P values in Supplementary Table 5). Metabolites shown as relative values with each value rescaled to set the median value to 1.

Comment in

  • Helping C. difficile to thrive.
    Taglialegna A. Taglialegna A. Nat Rev Microbiol. 2023 Feb;21(2):65. doi: 10.1038/s41579-022-00838-2. Nat Rev Microbiol. 2023. PMID: 36460929 No abstract available.

References

    1. Abbas A & Zackular JP Microbe-microbe interactions during Clostridioides difficile infection. Curr Opin Microbiol 53, 19–25, doi:10.1016/j.mib.2020.01.016 (2020). - DOI - PMC - PubMed
    1. Buffie CG et al. Precision microbiome reconstitution restores bile acid mediated resistance to Clostridium difficile. Nature 517, 205–208, doi:10.1038/nature13828 (2015). - DOI - PMC - PubMed
    1. Lessa FC, Winston LG, McDonald LC & Team, E. I. P. C. d. S. Burden of Clostridium difficile infection in the United States. N Engl J Med 372, 2369–2370, doi:10.1056/NEJMc1505190 (2015). - DOI - PMC - PubMed
    1. Schubert AM et al. Microbiome data distinguish patients with Clostridium difficile infection and non-C. difficile-associated diarrhea from healthy controls. MBio 5, e01021–01014, doi:10.1128/mBio.01021-14 (2014). - DOI - PMC - PubMed
    1. Auchtung JM, Preisner EC, Collins J, Lerma AI & Britton RA Identification of Simplified Microbial Communities That Inhibit Clostridioides difficile Infection through Dilution/Extinction. mSphere 5, doi:10.1128/mSphere.00387-20 (2020). - DOI - PMC - PubMed

Methods References

    1. Dale JL et al. Comprehensive Functional Analysis of the Enterococcus faecalis Core Genome Using an Ordered, Sequence-Defined Collection of Insertional Mutations in Strain OG1RF. mSystems 3, doi:10.1128/mSystems.00062-18 (2018). - DOI - PMC - PubMed
    1. Theriot CM et al. Cefoperazone-treated mice as an experimental platform to assess differential virulence of Clostridium difficile strains. Gut Microbes 2, 326–334, doi:10.4161/gmic.19142 (2011). - DOI - PMC - PubMed
    1. Kumar L, Cox CR & Sarkar SK Matrix metalloprotease-1 inhibits and disrupts Enterococcus faecalis biofilms. PLoS One 14, e0210218, doi:10.1371/journal.pone.0210218 (2019). - DOI - PMC - PubMed
    1. Bloedt K, Riecker M, Poppert S & Wellinghausen N Evaluation of new selective culture media and a rapid fluorescence in situ hybridization assay for identification of Clostridium difficile from stool samples. J Med Microbiol 58, 874–877, doi:10.1099/jmm.0.009811-0 (2009). - DOI - PubMed
    1. Wellinghausen N, Bartel M, Essig A & Poppert S Rapid identification of clinically relevant Enterococcus species by fluorescence in situ hybridization. J Clin Microbiol 45, 3424–3426, doi:10.1128/JCM.00861-07 (2007). - DOI - PMC - PubMed

Publication types

MeSH terms