

Early detection and prognosis prediction for colorectal cancer by circulating tumour DNA methylation haplotypes: A multicentre cohort study
- PMID: 36386039
- PMCID: PMC9646872
- DOI: 10.1016/j.eclinm.2022.101717
Early detection and prognosis prediction for colorectal cancer by circulating tumour DNA methylation haplotypes: A multicentre cohort study
Abstract
Background: Early detection and prognosis prediction of colorectal cancer (CRC) can significantly reduce CRC-related mortality. Recently, circulating tumour DNA (ctDNA) methylation has shown good application foreground in the early detection and prognosis prediction of multiple tumours.
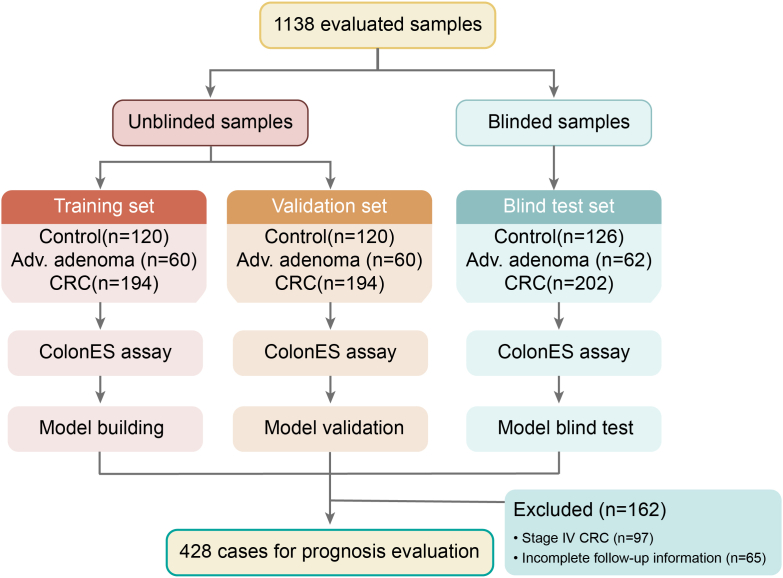
Methods: This multicentre cohort study evaluated ctDNA methylation haplotype patterns based on archived plasma samples (collected between 2010 and 2018) from 1138 individuals at two medical centres: Fudan University Shanghai Cancer Center (Shanghai, China) and Southern Medical University Nanfang Hospital (Guangzhou, Guangdong, China), including 366 healthy individuals, 182 patients with advanced adenoma (AA), and 590 patients with CRC. Samples were processed using the ColonES assay, a targeted bisulfite sequencing method that detects ctDNA methylation haplotype patterns in 191 genomic regions. Among these 1138 samples, 748 were used to develop a classification model, and 390 served as a blinded cohort for independent validation. The study is registered at https://register.clinicaltrials.gov with the unique identifier NCT03737591.
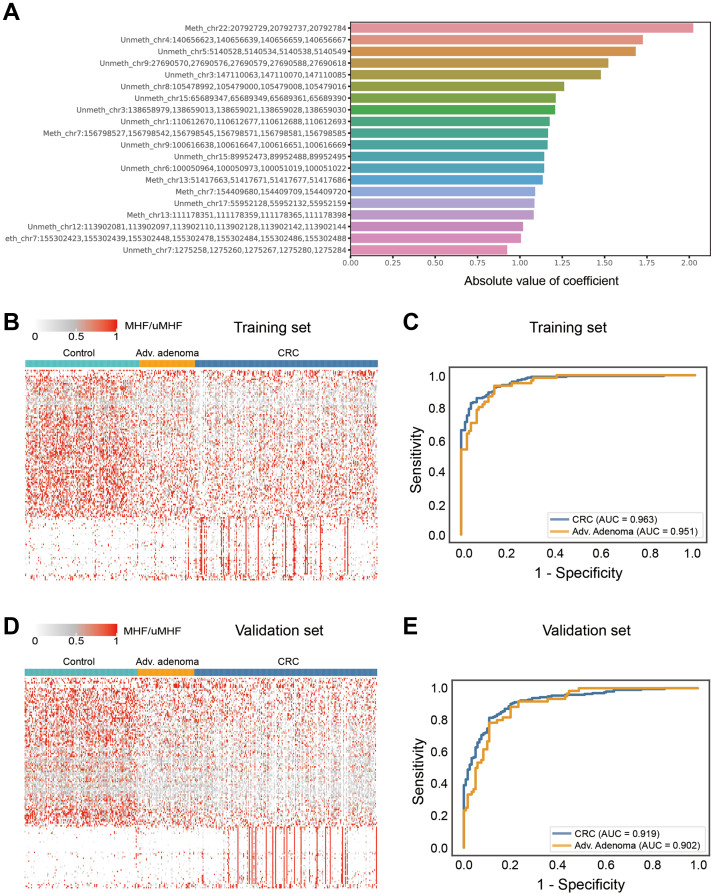
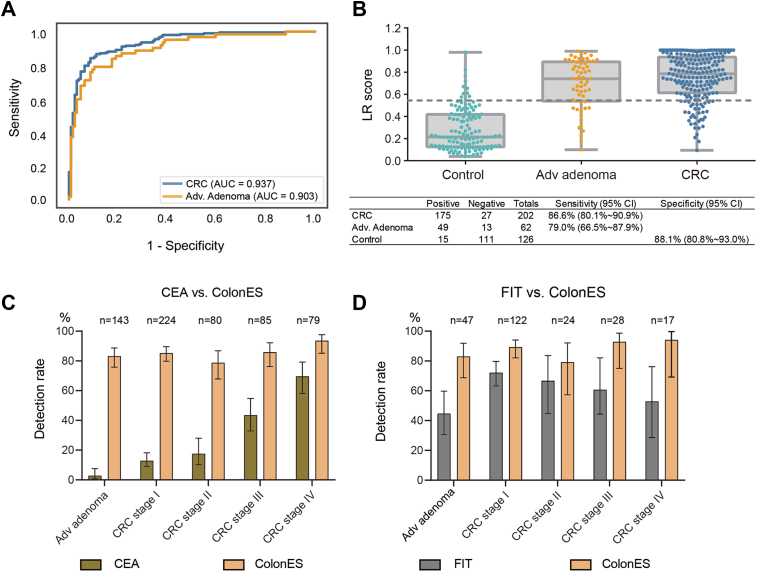
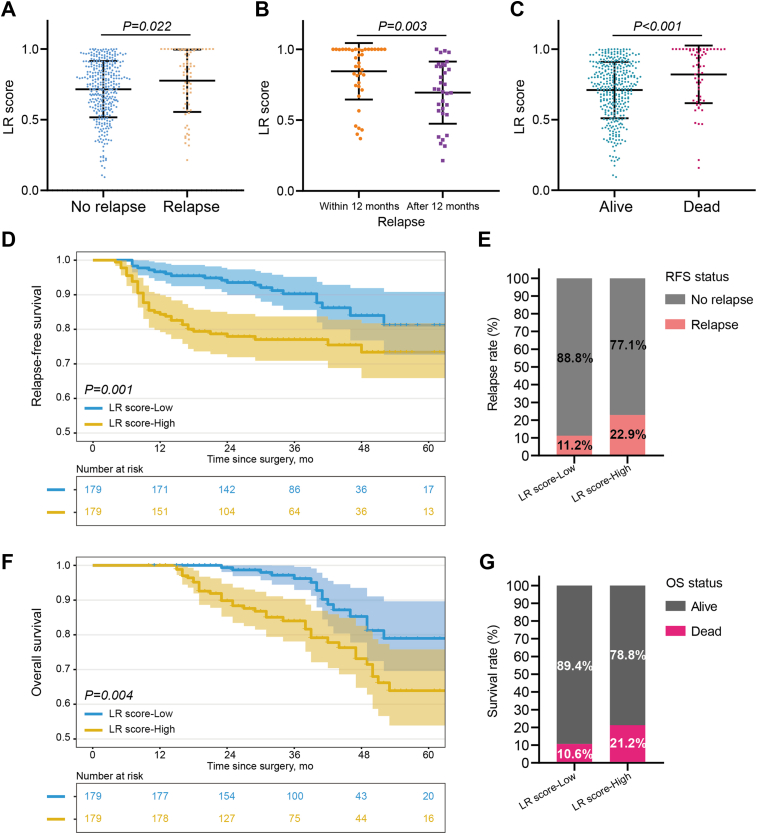
Results: The model obtained from unblinded samples discriminated patients with CRC or AA from normal controls with high accuracy. In the blinded validation set, the ColonES assay achieved sensitivity values of 79.0% (95% confidence interval (CI), 66%-88%) in AA patients and 86.6% (95% CI, 81%-91%) in CRC patients with a specificity of 88.1% (95% CI, 81%-93%) in healthy individuals. The model area under the curve (AUC) for the blinded validation set was 0.903 for AA samples and 0.937 for CRC samples. Additionally, the prognosis of patients with high preoperative ctDNA methylation levels was worse than that of patients with low ctDNA methylation levels (p = 0.001 for relapse-free survival and p = 0.004 for overall survival).
Interpretation: We successfully developed and validated an accurate, noninvasive detection method based on ctDNA methylation haplotype patterns that may enable early detection and prognosis prediction for CRC.
Funding: The Grant of National Natural Science Foundation of China (No.81871958), National Natural Science Foundation of China (No. 82203215), Shanghai Science and Technology Committee (No. 19140902100), Scientific Research Fund of Fudan University (No.IDF159052), Shanghai Municipal Health Commission (SHWJRS 2021-99), and Shanghai Sailing Program (22YF1408800).
Keywords: Colorectal cancer; Early detection; Precancerous adenomas; Prognosis prediction; ctDNA methylation.
© 2022 The Author(s).
Conflict of interest statement
H.W., C.M. and Z.S. are employed by company Singlera Genomics (Shanghai). The other authors declare no competing interests.
Figures
References
-
- Siegel R.L., Miller K.D., Fuchs H.E., Jemal A. Cancer statistics, 2021. CA Cancer J Clin. 2021;71(1):7–33. - PubMed
-
- Siegel R.L., Miller K.D., Goding Sauer A., et al. Colorectal cancer statistics, 2020. CA Cancer J Clin. 2020;70(3):145–164. - PubMed
-
- Bray F., Ferlay J., Soerjomataram I., Siegel R.L., Torre L.A., Jemal A. Global cancer statistics 2018: GLOBOCAN estimates of incidence and mortality worldwide for 36 cancers in 185 countries. CA Cancer J Clin. 2018;68(6):394–424. - PubMed
-
- Chen W., Zheng R., Baade P.D., et al. Cancer statistics in China, 2015. CA Cancer J Clin. 2016;66(2):115–132. - PubMed
Associated data
LinkOut - more resources
Full Text Sources
Medical
