. 2022 Nov 12;11(1):2144669.
doi: 10.1080/2162402X.2022.2144669. eCollection 2022.

Chemokine switch regulated by TGF-β1 in cancer-associated fibroblast subsets determines the efficacy of chemo-immunotherapy

Affiliations

Chemokine switch regulated by TGF-β1 in cancer-associated fibroblast subsets determines the efficacy of chemo-immunotherapy

Angélique Vienot et al. Oncoimmunology. .

Abstract

Combining immunogenic cell death-inducing chemotherapies and PD-1 blockade can generate remarkable tumor responses. It is now well established that TGF-β1 signaling is a major component of treatment resistance and contributes to the cancer-related immunosuppressive microenvironment. However, whether TGF-β1 remains an obstacle to immune checkpoint inhibitor efficacy when immunotherapy is combined with chemotherapy is still to be determined. Several syngeneic murine models were used to investigate the role of TGF-β1 neutralization on the combinations of immunogenic chemotherapy (FOLFOX: 5-fluorouracil and oxaliplatin) and anti-PD-1. Cancer-associated fibroblasts (CAF) and immune cells were isolated from CT26 and PancOH7 tumor-bearing mice treated with FOLFOX, anti-PD-1 ± anti-TGF-β1 for bulk and single cell RNA sequencing and characterization. We showed that TGF-β1 neutralization promotes the therapeutic efficacy of FOLFOX and anti-PD-1 combination and induces the recruitment of antigen-specific CD8+ T cells into the tumor. TGF-β1 neutralization is required in addition to chemo-immunotherapy to promote inflammatory CAF infiltration, a chemokine production switch in CAF leading to decreased CXCL14 and increased CXCL9/10 production and subsequent antigen-specific T cell recruitment. The immune-suppressive effect of TGF-β1 involves an epigenetic mechanism with chromatin remodeling of CXCL9 and CXCL10 promoters within CAF DNA in a G9a and EZH2-dependent fashion. Our results strengthen the role of TGF-β1 in the organization of a tumor microenvironment enriched in myofibroblasts where chromatin remodeling prevents CXCL9/10 production and limits the efficacy of chemo-immunotherapy.

Keywords: TGF-β; cancer; chemo-immunotherapy; chemokine; fibroblast; microenvironment.


Conflict of interest statement

CB declares research grant from Roche, Bayer and advisory board for MSD, Sanofi, Bayer. All other authors report no conflict of interest.

Figures
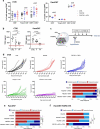
Figure 1.
Figure 1.
Adding TGF-β1 blockade to chemo-immunotherapy promotes complete tumor regression in CT26 and PancOH7 models. (a) Proportion of CD3+, Treg, and CD8+ T cells measured by flow cytometry in total CD45+ intra-tumoral cells isolated from CT26 and PancOH7-bearing BALB/c and C57BL/6 mice, respectively. For this purpose, tumors were collected two days following the last treatment injection. (b) TGF-β1 levels determined in whole tumor lysate derived from CT26 and PancOH7-bearing mice after FOLFOX ± anti-PD-1 and measured by ELISA. Pooled results from two independent experiments are presented. Red line shows the threshold at 200 pg/mL. (c) Experimental scheme: BALB/c and C57BL/6 mice were injected subcutaneously with PancOH7 pancreatic tumor cells and CT26 colon tumor cells, respectively (five experiments in the CT26 model and three experiments in the PancOH7 model). Mice were randomized and treated in five groups (n = 5–10 per group) when tumor size reached 50–60 mm3: Control, FOLFOX, FOLFOX+anti-TGF-β1, FOLFOX+anti-PD-1, and FOLFOX+anti-PD-1+ anti-TGF-β1. (d) Tumor growth and responses according to treatment groups for CT26 tumor-bearing mice. Tumor growths are indicated for one of a representative experiment, each line represents an individual mouse tumor size. Objective responses are shown for pooled mice (n = 30 per group). (e) Objective responses are shown in PancOH7 models for pooled C57BL/6 mice (n = 17 per group). (f) Objective responses are shown in PancOH7 models for pooled C57BL/6 FOXP3 DTR (diphtheria toxin receptor) mice (n = 10 in FPT group, n = 9 in other groups) for the depletion of regulatory T cells. *p ≤ .05 **p ≤ .01 ***p ≤ .001 ****p ≤ .0001. Abbreviations: Ab: antibody; Ctrl: control; F: FOLFOX; FP: FOLFOX+anti-PD-1.
Figure 2.
Figure 2.
Adding TGF-β1 blockade to chemo-immunotherapy increases effector and specific T cell infiltration in the CT26 model. (a) Tumor growth in mice treated with FOLFOX, anti-PD-1 ± anti-TGF-β1, according to depletion of CD8+ T lymphocytes. One representative experiments is shown (n = 3) (b) Numbers per mm3 of total CD8+ T cells (top left), IFNγ (Top right), GzmB (bottom left), and IFNγ/GzmB (Bottom right) expressing CD8+ tumor-infiltrating lymphocytes (TIL), according to the five groups of treatment. One representative experiment out of 5 is depicted. (c) Representative flow cytometry dot plot graphs on AH1 specific CD8+ TIL with gp70 tetramer staining. (d) Numbers per mm3 of gp70+IFNγ+GzmB+ expressing CD8+ TIL. (e) Tumor growth of untreated or FOLFOX + anti-TGF-β1/PD-1-treated cured mice re-challenged with 4T1 (Top) and CT26 (Bottom) tumor cells, two months after previous treatment. Each experiment was repeated independently a minimum of three times in the same conditions.
Figure 3.
Figure 3.
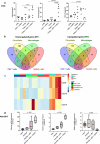
Anti-TGF-β1 combined with chemo-immunotherapy induces a chemokine switch in cancer-associated fibroblasts. (a) CXCL9, CXCL10, and CXCL14 levels determined in whole tumor lysate derived from the CT26 model and measured by ELISA. (b) Venn diagram showing overlaps between the transcriptomic signatures of CD4+ T cells, macrophages, endothelial cells, and CAF isolated from CT26 tumor-bearing mice. Number of genes overexpressed with FP (Left) and FPT (Right) are represented. (c) Heatmap showing chemokine expression (z score) of cell sorted populations. (d) mRNA levels of CXCL9, CXCL10, and CXCL14 were determined by RT-qPCR in CAF from PancOH7 tumor-bearing mice. Housekeeping gene Glyceraldehyde-3-Phosphate Dehydrogenase (GAPDH) was uses for the normalization of data in RT-qPCR experiments. Abbreviations: CTRL: control; FP: FOLFOX+anti-PD-1; FPT: FOLFOX+anti-PD-1+ anti-TGF-β1.
Figure 4.
Figure 4.
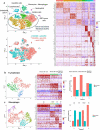
Cancer-associated fibroblast and immune cell heterogeneity after anti-TGF-β1 and chemo-immunotherapy combination at single-cell resolution. (a) t-distributed stochastic neighbor embedding (tSNE) embedding of 11,975 all single cells sorted from PancOH7 tumor-bearing C57BL/6 mice. Clusters identified through graph-clustering are indicated by color (Top left). Clusters across the two conditions of treatment (FOLFOX anti-PD-1 ± anti-TGF-β1; Bottom left). Heatmap showing the relative average expression of the most strongly enriched genes for each cluster; Top bars indicate clusters (Right). (b) tSNE embedding of T cells from cluster 7 in (A) (Left). Heatmap showing the relative average expression of the most strongly enriched genes for clusters from T cells. Three clusters of T cells were shown: t0, t1, and t2. High expression of genes associated with memory CD8+ T cells in the t0 population (Ccl5, Ly6c2, and Gzma), while the t1 subset was characterized by markers of effector CD8+ T cells (Cd8a, Lag3, Pdcd1, and Prf1). The transcriptional profile of the t2 population showed enrichment of regulatory CD4+ T cell markers (Tnfrsf4, Foxp3, and Cd4). Proportion of T cells in each cluster according to treatment conditions (Right). (c) tSNE embedding of macrophages from cluster 5 in (A) (Left). Heatmap showing the relative average expression of the most strongly enriched genes for clusters from macrophages. Proportion of macrophages in each cluster according to treatment conditions (Right). Abbreviations: EMT: epithelial-to-mesenchymal transition.
Figure 5.
Figure 5.
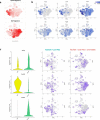
Chemokine switch across CAF subpopulations using single-cell RNA-sequencing. (a) AUCell-based tSNE representation coloring cells based on the gene set activities (AUC) of myCAF and iCAF signatures. (b) tSNEs illustrating the expression of the genes indicated in each panel. (c) Violin plots of expression of the indicated chemokines in myCAF and iCAF clusters (left). tSNEs illustrating the expression of the chemokines indicated in each panel split by treatment conditions (right).
Figure 6.
Figure 6.
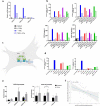
TGF-β1-induced epigenetic repression of CXCL9 and CXCL10 in fibroblasts is mediated by an interdependent cross-talk between EZH2 and G9a. (a) mRNA levels of CXCL9 and CXCL10 determined by RT-qPCR in naïve mouse fibroblasts (Left). CXCL9 and CXCL10 concentration in the medium analyzed by ELISA in the same fibroblasts (Right). Data are shown for one out of three representative experiments (b) mRNA levels of CXCL9 and CXCL10 determined by RT-qPCR in fibroblast incubated with epidrugs: EZH2 inhibitor (GSK343), G9a inhibitor (UNC0638), and JMJD3/KDM6B and UTX/KDM6A inhibitor (GSKJ4: negative control) (Top). CXCL9 and CXCL10 concentration in the medium analyzed by ELISA in the same conditions (Bottom). (c) Schematic representation of the interplay between EZH2 and G9a in the regulation of CXCL9/10 gene repression in naïve fibroblasts. (d) Naive mouse fibroblasts cells were transfected with control siRNA, EZH2 siRNA, or G9a siRNA in culture medium for 72 hours before incubation with TGF-β1 for 48 hours before being treated with IFNγ for a further 24 h. (e) Chromatin immunoprecipitation was conducted with specific antibodies against H3ac, H3K9me3, and H3K27me3 in confluent NIH/3T3 cells treated with TGF-β for 3 days and then fixed with formaldehyde. CXCL9 and CXCL10 promoters were amplified by qRT-PCR. Data are expressed as mean ± SEM of 2 or 3 separate experiments. *p < .05. (f) Correlation between CXCL9 promoter opening and myCAF signature in TCGA-COAD samples.

References

    1. Mariathasan S, Turley SJ, Nickles D, Castiglioni A, Yuen K, Wang Y, Kadel III EE, Koeppen H, Astarita JL, Cubas R, et al. TGFβ attenuates tumour response to PD-L1 blockade by contributing to exclusion of T cells. Nature. 2018;554(7693):544–15. doi:10.1038/nature25501. - DOI - PMC - PubMed
    1. Tauriello DVF, Palomo-Ponce S, Stork D, Berenguer-Llergo A, Badia-Ramentol J, Iglesias M, Sevillano M, Ibiza S, Cañellas A, Hernando-Momblona X, et al. TGFβ drives immune evasion in genetically reconstituted colon cancer metastasis. Nature. 2018;554(7693):538–543. doi:10.1038/nature25492. - DOI - PubMed
    1. de Streel G, Bertrand C, Chalon N, Liénart S, Bricard O, Lecomte S, Devreux J, Gaignage M, De Boeck G, Mariën L, et al. Selective inhibition of TGF-β1 produced by GARP-expressing Tregs overcomes resistance to PD-1/PD-L1 blockade in cancer. Nat Commun. 2020;11(1):4545. doi:10.1038/s41467-020-17811-3. - DOI - PMC - PubMed
    1. Strauss J, Heery CR, Schlom J, Madan RA, Cao L, Kang Z, Lamping E, Marté JL, Donahue RN, Grenga I, et al. Phase I Trial of M7824 (MSB0011359C), a Bifunctional Fusion Protein Targeting PD-L1 and TGFβ, in Advanced Solid Tumors. Clin Cancer Res. 2018;24(6):1287–1295. doi:10.1158/1078-0432.CCR-17-2653. - DOI - PMC - PubMed
    1. Kang Y-K, Bang Y-J, Kondo S, Chung HC, Muro K, Dussault I, Helwig C, Osada M, Doi T.. Safety and Tolerability of Bintrafusp Alfa, a Bifunctional Fusion Protein Targeting TGFβ and PD-L1, in Asian Patients with Pretreated Recurrent or Refractory Gastric Cancer. Clinical Cancer Research. 2020;26(13):3202–3210. doi:10.1158/1078-0432.CCR-19-3806. - DOI - PubMed

Publication types