Biological impact of restrictive and liberal fluid strategies at low and high PEEP levels on lung and distal organs in experimental acute respiratory distress syndrome
- PMID: 36388107
- PMCID: PMC9663484
- DOI: 10.3389/fphys.2022.992401
Biological impact of restrictive and liberal fluid strategies at low and high PEEP levels on lung and distal organs in experimental acute respiratory distress syndrome
Abstract
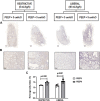
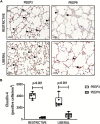
Background: Fluid regimens in acute respiratory distress syndrome (ARDS) are conflicting. The amount of fluid and positive end-expiratory pressure (PEEP) level may interact leading to ventilator-induced lung injury (VILI). We therefore evaluated restrictive and liberal fluid strategies associated with low and high PEEP levels with regard to lung and kidney damage, as well as cardiorespiratory function in endotoxin-induced ARDS. Methods: Thirty male Wistar rats received an intratracheal instillation of Escherichia coli lipopolysaccharide. After 24 h, the animals were anesthetized, protectively ventilated (VT = 6 ml/kg), and randomized to restrictive (5 ml/kg/h) or liberal (40 ml/kg/h) fluid strategies (Ringer lactate). Both groups were then ventilated with PEEP = 3 cmH2O (PEEP3) and PEEP = 9 cmH2O (PEEP9) for 1 h (n = 6/group). Echocardiography, arterial blood gases, and lung mechanics were evaluated throughout the experiments. Histologic analyses were done on the lungs, and molecular biology was assessed in lungs and kidneys using six non-ventilated animals with no fluid therapy. Results: In lungs, the liberal group showed increased transpulmonary plateau pressure compared with the restrictive group (liberal, 23.5 ± 2.9 cmH2O; restrictive, 18.8 ± 2.3 cmH2O, p = 0.046) under PEEP = 9 cmH2O. Gene expression associated with inflammation (interleukin [IL]-6) was higher in the liberal-PEEP9 group than the liberal-PEEP3 group (p = 0.006) and restrictive-PEEP9 (p = 0.012), Regardless of the fluid strategy, lung mechanical power and the heterogeneity index were higher, whereas birefringence for claudin-4 and zonula-ocludens-1 gene expression were lower in the PEEP9 groups. Perivascular edema was higher in liberal groups, regardless of PEEP levels. Markers related to damage to epithelial cells [club cell secreted protein (CC16)] and the extracellular matrix (syndecan) were higher in the liberal-PEEP9 group than the liberal-PEEP3 group (p = 0.010 and p = 0.024, respectively). In kidneys, the expression of IL-6 and neutrophil gelatinase-associated lipocalin was higher in PEEP9 groups, regardless of the fluid strategy. For the liberal strategy, PEEP = 9 cmH2O compared with PEEP = 3 cmH2O reduced the right ventricle systolic volume (37%) and inferior vena cava collapsibility index (45%). Conclusion: The combination of a liberal fluid strategy and high PEEP led to more lung damage. The application of high PEEP, regardless of the fluid strategy, may also be deleterious to kidneys.
Keywords: acute respiratory distress syndrome; immunohistochemistry; mechanical power; positive end-expiratory pressure; ventilator-induced lung injury.
Copyright © 2022 Felix, Maia, Rocha, Rodrigues, Medeiros, da Silva, Baldavira, Fernezlian, Eher, Capelozzi, Malbrain, Pelosi, Rocco and Silva.
Conflict of interest statement
The authors declare that the research was conducted in the absence of any commercial or financial relationships that could be construed as a potential conflict of interest.
Figures


Similar articles
-
Fluid management strategies and their interaction with mechanical ventilation: from experimental studies to clinical practice.Intensive Care Med Exp. 2023 Jul 21;11(1):44. doi: 10.1186/s40635-023-00526-2. Intensive Care Med Exp. 2023. PMID: 37474816 Free PMC article. Review.
-
The impact of fluid status and decremental PEEP strategy on cardiac function and lung and kidney damage in mild-moderate experimental acute respiratory distress syndrome.Respir Res. 2021 Jul 30;22(1):214. doi: 10.1186/s12931-021-01811-y. Respir Res. 2021. PMID: 34330283 Free PMC article.
-
Effects of pressure support ventilation on ventilator-induced lung injury in mild acute respiratory distress syndrome depend on level of positive end-expiratory pressure: A randomised animal study.Eur J Anaesthesiol. 2018 Apr;35(4):298-306. doi: 10.1097/EJA.0000000000000763. Eur J Anaesthesiol. 2018. PMID: 29324568
-
A more gradual positive end-expiratory pressure increase reduces lung damage and improves cardiac function in experimental acute respiratory distress syndrome.J Appl Physiol (1985). 2022 Feb 1;132(2):375-387. doi: 10.1152/japplphysiol.00613.2021. Epub 2021 Dec 23. J Appl Physiol (1985). 2022. PMID: 34941443
-
Should we titrate ventilation based on driving pressure? Maybe not in the way we would expect.Ann Transl Med. 2018 Oct;6(19):389. doi: 10.21037/atm.2018.09.48. Ann Transl Med. 2018. PMID: 30460263 Free PMC article. Review.
Cited by
-
Fluid management strategies and their interaction with mechanical ventilation: from experimental studies to clinical practice.Intensive Care Med Exp. 2023 Jul 21;11(1):44. doi: 10.1186/s40635-023-00526-2. Intensive Care Med Exp. 2023. PMID: 37474816 Free PMC article. Review.
-
Acute Respiratory Distress Syndrome and Fluid Management: Finding the Perfect Balance.J Clin Med. 2025 Mar 18;14(6):2067. doi: 10.3390/jcm14062067. J Clin Med. 2025. PMID: 40142875 Free PMC article. Review.
-
The modified effect of mechanical ventilation setting on relationship between fluid balance and hospital mortality for sepsis patients: a retrospective study.BMC Anesthesiol. 2025 Feb 20;25(1):91. doi: 10.1186/s12871-025-02954-x. BMC Anesthesiol. 2025. PMID: 39979809 Free PMC article.
References
-
- Akamine R., Yamamoto T., Watanabe M., Yamazaki N., Kataoka M., Ishikawa M., et al. (2007). Usefulness of the 5' region of the cDNA encoding acidic ribosomal phosphoprotein P0 conserved among rats, mice, and humans as a standard probe for gene expression analysis in different tissues and animal species. J. Biochem. Biophys. Methods 70, 481–486. 10.1016/j.jbbm.2006.11.008 - DOI - PubMed
LinkOut - more resources
Full Text Sources

