Review
. 2022 Oct 31:13:923988.
doi: 10.3389/fneur.2022.923988. eCollection 2022.

Site effects how-to and when: An overview of retrospective techniques to accommodate site effects in multi-site neuroimaging analyses

Affiliations
Review

Site effects how-to and when: An overview of retrospective techniques to accommodate site effects in multi-site neuroimaging analyses

Johanna M M Bayer et al. Front Neurol. .

Abstract

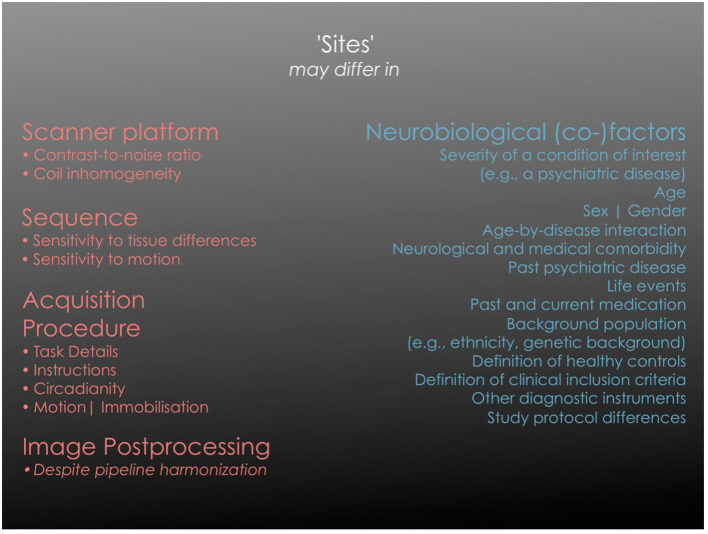
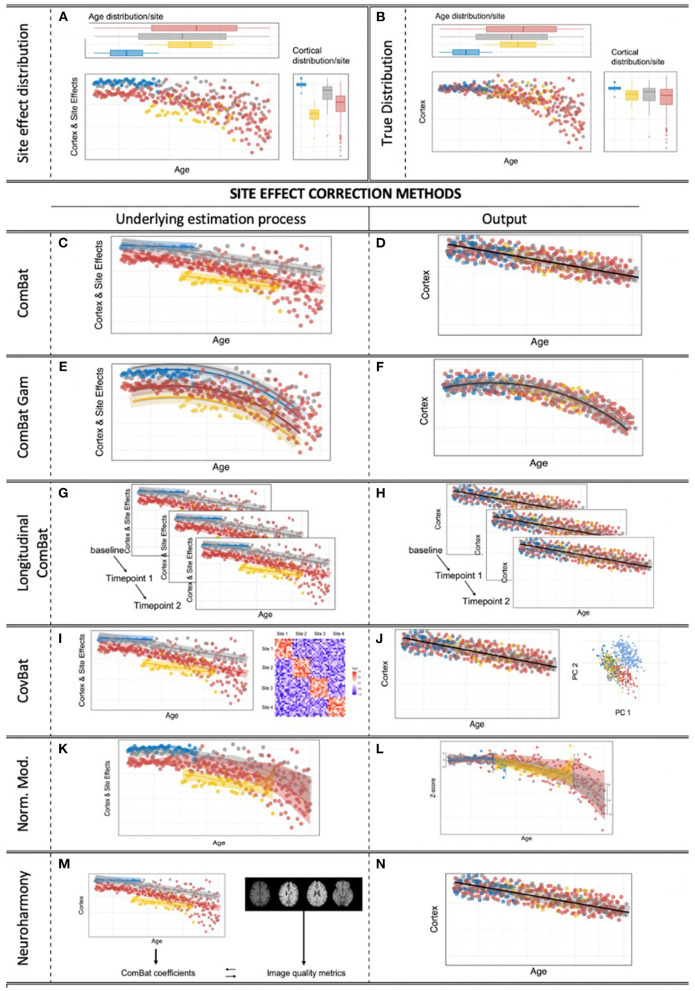
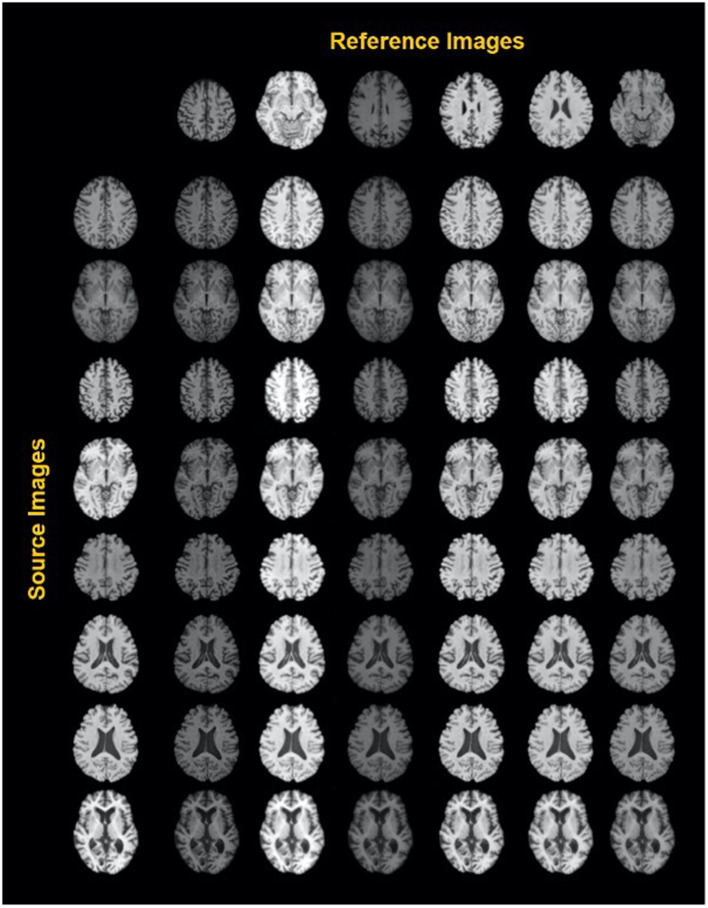
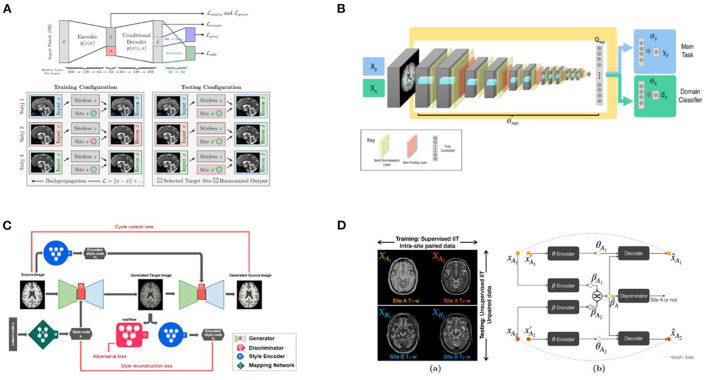
Site differences, or systematic differences in feature distributions across multiple data-acquisition sites, are a known source of heterogeneity that may adversely affect large-scale meta- and mega-analyses of independently collected neuroimaging data. They influence nearly all multi-site imaging modalities and biomarkers, and methods to compensate for them can improve reliability and generalizability in the analysis of genetics, omics, and clinical data. The origins of statistical site effects are complex and involve both technical differences (scanner vendor, head coil, acquisition parameters, imaging processing) and differences in sample characteristics (inclusion/exclusion criteria, sample size, ancestry) between sites. In an age of expanding international consortium research, there is a growing need to disentangle technical site effects from sample characteristics of interest. Numerous statistical and machine learning methods have been developed to control for, model, or attenuate site effects - yet to date, no comprehensive review has discussed the benefits and drawbacks of each for different use cases. Here, we provide an overview of the different existing statistical and machine learning methods developed to remove unwanted site effects from independently collected neuroimaging samples. We focus on linear mixed effect models, the ComBat technique and its variants, adjustments based on image quality metrics, normative modeling, and deep learning approaches such as generative adversarial networks. For each method, we outline the statistical foundation and summarize strengths and weaknesses, including their assumptions and conditions of use. We provide information on software availability and comment on the ease of use and the applicability of these methods to different types of data. We discuss validation and comparative reports, mention caveats and provide guidance on when to use each method, depending on context and specific research questions.

Keywords: ComBat; MRI; deep learning; generative adversarial networks (GANs); multi-site study; neuroimaging; normative modeling; site effect.


Conflict of interest statement

The authors declare that the research was conducted in the absence of any commercial or financial relationships that could be construed as a potential conflict of interest.

Figures

Figure 1
Figure 1
Overview of different sources of site effects. The left column lists categories of technical factors that are bound to a specific acquisition site and that may significantly influence the primary image properties. “Scanner effect” is often used as an abbreviation for “image acquisition platform” in a wider sense while it incorporates numerous technical components. In active tasks where researchers or technicians intervene as part of the study protocol (e.g., provide instructions to participants), additional site specific effects of a systemic nature may appear. The right column lists factors that may be variables of interest (such as a disease status) or variables of no interest, depending on the study question. Each of them may be site-specific and thus co-vary with the specific site in a multi-site analysis, imposing the challenge of disentangling the two sources of “site effects”. It should be noted that “variables of no interest” may still be essential for an adequate statistical model of the biological effects (e.g., age).
Figure 2
Figure 2
Site effects & correction methods for multi-site effects in neuroimaging. (A) Obvious site effects with preserved age effect within the sites. (B) True, underlying, unknown heteroscedastic distribution. (C,D) The standard ComBat algorithm provides linear adjustment of site means and scaling of site variance differences, with the option to preserve linear covariate effects of interest, while scaling the variance to a homoscedastic distribution. (E,F) ComBat-GAM: ComBat is augmented by the option to expand defined covariates of interest by penalized non-linear expansion terms, while scaling the variance to a homoscedastic distribution. (G,H) Longitudinal ComBat: The ComBat algorithm is modified to model within-subject variance over several time points under the additional consideration of changing (linear) covariates. (I,J) CovBat: After application of the original ComBat algorithm, ComBat is again applied to the principal components of the residuals to harmonize site-specific covariance. (K,L) Normative modeling allows the user to convert raw engineered features into z-scores specifically adjusted to separately model site effects and covariate effects, all under a Bayesian prior system. (M,N) Neuroharmony allows one to harmonize features of a single subject based on raw T1-image based quality metrics that have previously been linked to ComBat correction coefficients by a supervised ML algorithm that has been trained on a large neuroimaging data set.
Figure 3
Figure 3
Exemplary results of a style-encoding GAN. First row shows six reference images (columns 2–7) differing in their contrasts between gray matter, white matter, CSF and background, and the first column showing different source images at different axial slice positions. Harmonized images in each row demonstrate well-maintained anatomical structures and at the same an alignment of the contrast features to the reference column. See Liu et al. (44) for details. Reproduced with permission.
Figure 4
Figure 4
Four GAN-based deep learning harmonization models. (A) The network architecture in Moyer et al. (41). The invariant representations to and from the images are learned using an encoder/decoder architecture, with a one-hot vector to represent the protocol identifiers. (B) General network architecture in (67). The network is formed of three sections: the feature extractor with parameters, the label predictor with parameters, and the domain classifier with parameters. The domain invariant features (from the feature extractor), which are used in domain-invariant label predictions. are learned by confusing the domain classifier. The represents the input data used to train the main task with labels, and represents the input data used to train the steps involved in unlearning scanner with labels d. (C) The architecture of the style-encoding GAN (44). Generators learn to generate images by inputting a source image and a style code. The anatomy of the brain MRI was preserved using a cycle-GAN architecture, and the harmonization was achieved by inserting a style code into the images. Reproduced with permission. (D) (a) Given T1-w and T2-w images from Sites A and B, the method from Zuo et al. (69) learns the site-invariant anatomy from supervised image-to-image translation (T1–T2 synthesis) and site-variant contrast from unsupervised image-to-image translation (harmonization), where is learned to control the image contrast after harmonization, and is learned to preserve the anatomical information.

References

    1. Thompson PM, Jahanshad N, Ching CRK, Salminen LE, Thomopoulos SI, Bright J, et al. ENIGMA and global neuroscience: a decade of large-scale studies of the brain in health and disease across more than 40 countries. Transl Psychiatry. (2020) 10:167. 10.1016/j.biopsych.2020.02.167 - DOI - PMC - PubMed
    1. Psaty BM, O'Donnell CJ, Gudnason V, Lunetta KL, Folsom AR, Rotter JI, et al. Cohorts for heart and aging research in genomic epidemiology (CHARGE) consortium. Circ Cardiovasc Genet. (2009) 2:73–80. 10.1161/CIRCGENETICS.108.829747 - DOI - PMC - PubMed
    1. Habes M, Pomponio R, Shou H, Doshi J, Mamourian E, Erus G, et al. The brain chart of aging: machine-learning analytics reveals links between brain aging, white matter disease, amyloid burden, and cognition in the istaging consortium of 10,216 harmonized MR scans. Alzheimers Dement. (2021) 17:89–102. 10.1002/alz.12178 - DOI - PMC - PubMed
    1. Bethlehem RAI, Seidlitz J, White SR, Vogel JW, Anderson KM, Adamson C, et al. Brain charts for the human lifespan. Nature. (2022) 604:525–33. 10.1038/s41586-022-04554-y - DOI - PMC - PubMed
    1. Rutherford S, Fraza C, Dinga R, Kia SM, Wolfers T, Zabihi M, et al. Charting brain growth and aging at high spatial precision. Elife. (2022) 11:e72904. 10.7554/eLife.72904.sa2 - DOI - PMC - PubMed

LinkOut - more resources