. 2022 Oct 28:10:1025410.
doi: 10.3389/fpubh.2022.1025410. eCollection 2022.

Two years of COVID-19 pandemic: Framework of health interventions in a Brazilian city

Affiliations

Two years of COVID-19 pandemic: Framework of health interventions in a Brazilian city

Vanessa Dos Santos Faiões et al. Front Public Health. .

Abstract

The COVID-19 pandemic and its effects on public health have urgently demanded effective health policies to avoid the spread of COVID-19. Thus, public administrators have implemented non-pharmacological and pharmacological interventions to mitigate the pandemic's impacts and strengthen health services. The aim of this ecological study is to describe the scenario of COVID-19 pandemic in a Brazilian city, during 2 years. This ecological study was carried out in Nova Friburgo, a Brazilian city, for 105 weeks (two years), from March 29, 2020 (week 1) to April 02, 2022 (week 105). Data on COVID-19 cases and COVID-19 deaths, occupation of COVID-19 exclusive beds in hospitals, community mobility, vaccination, government regulation on the opening of city establishments and city risk assessment were collected from public datasets. Four waves of COVID-19 cases and deaths were observed during this period. The first case occurred in week 1 and first death in week 3 of this study. The highest peaks of cases and deaths were observed during the third wave with 1,131 cases (week 54) and 47 deaths (week 55) and where the highest occupation of COVID-19 exclusive beds in local hospitals occurred. Interventions from more restrictive to more flexible, were implemented throughout this study, including lockdown and gradual return in economic and social strata levels. Vaccination began on week 43 and at the end of this study 89.91% of the total population was vaccinated with at least one dose, being 83.22% fully vaccinated. A deep description of several interventions used to avoid COVID-19 spread in a Brazilian city during 2 years of this pandemic can help promote better decision-making in the future while it exposes the challenges of conducting public health policies in a pandemic scenario.

Keywords: COVID-19; non-pharmacological interventions; pandemic; public health; vaccine.


Conflict of interest statement

The authors declare that the research was conducted in the absence of any commercial or financial relationships that could be construed as a potential conflict of interest.

Figures

Figure 1
Figure 1
One hundred and five weeks that compose the timeframe of this study.
Figure 2
Figure 2
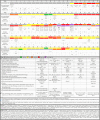
Timeline highlighting the major municipal decrees, local health events, and municipal, state and national holidays in Nova Friburgo. Each lower case letter not represented in the following week indicates the permanency of the regulative measures from the previous one.
Figure 3
Figure 3
State color flag system for all 16 cities of the mountainous region and for this entire region of the state of Rio de Janeiro. Cities: 1, Petrópolis; 2, Nova Friburgo; 3, Teresópolis; 4, Guapimirim; 5, Cachoeiras de Macacu; 6, Bom Jardim; 7, Cordeiro; 8, São José do Vale do Rio Preto; 9, Cantagalo; 10, Carmo; 11, Sumidouro; 12, Duas Barras; 13, Trajano de Moraes; 14, Santa Maria Madalena; 15, São Sebastião do Alto; 16, Macuco; *City where this study was conducted. Flag colors: gray, unknown (absent or not found); green, very low; yellow, low; orange, moderate; red, high; purple, very high risk. ✓, present; X, absent; na, not applicable.
Figure 4
Figure 4
Evolution of weekly COVID-19 cases and deaths in Nova Friburgo. Flag colors: Green, very low; yellow, low; orange, moderate; red, high; purple, very high risk.
Figure 5
Figure 5
Percentage of accumulated COVID-19 cases per week in each age group. Flag colors: Green, very low; yellow, low; orange, moderate; red, high; purple, very high risk.
Figure 6
Figure 6
COVID-19 exclusive public bed occupation per week in absolute numbers. In the line above the graph, is the total occupation percentage for COVID-19 exclusive beds (infirmary and ICU) in public hospitals. Flag colors: Green, very low; yellow, low; orange, moderate; red, high; purple, very high risk. ICU, intensive care unit.
Figure 7
Figure 7
COVID-19 exclusive private bed occupation per week in absolute numbers. In the line above the graph, is the total occupation percentage for COVID-19 exclusive beds (infirmary and ICU) in private hospitals. Flag colors: Green, very low; yellow, low; orange, moderate; red, high; purple, very high risk. ICU, intensive care unit.
Figure 8
Figure 8
Impact of decrees and holidays on community mobility per week. Decrees: (A) face mask mandatory; (B) reopening industries; (C) bus 100% capacity and total hours 16/day; (D) reopening several business and social segments; (J) lockdown; (K) rotation by company registry number; (L) flags no longer regulate business and social segments; (R) decree commercial events one meter social distancing; (T) decree for a more flexible mask use. Holidays: (E) Father's day 2020 (Sun); (F) Nossa Senhora Aparecida 2020 (Mon); (G) Christmas 2020 (Fri); (H) New year 2021 (Fri); (I) Carnival 2021 (Tue); (M) Independence day 2021 (Tue); (N) Nossa Senhora Aparecida 2021 (Tue); (O) Proclamation of the republic and black awareness day 2021 (Mon and Sat); (P) Christmas 2021 (Sat); (Q) New year 2022 (Sat); (S) Carnival 2022 (Tue). Flag colors: green, very low; yellow, low; orange, moderate; red, high; purple, very high risk.
Figure 9
Figure 9
Relationship between transit station and COVID-19 cases. Flag colors: green, very low; yellow, low; orange, moderate; red, high; purple, very high risk.
Figure 10
Figure 10
Accumulated vaccination rates per week in Nova Friburgo. Flag colors: yellow, low; orange, moderate; red, high; purple, very high risk.

References

    1. WHO . Naming the coronavirus disease (COVID-19) and the virus that causes it. (2020). Available online at: https://www.who.int/emergencies/diseases/novel-coronavirus-2019/technica... (accessed April 03, 2022).
    1. Chee J, Loh WS, Liu Z, Mullol J, Wang DY. Clinical-pathological correlation of the pathophysiology and mechanism of action of COVID-19—a primer for clinicians. Curr Allergy Asthma Rep. (2021) 21:1–10. 10.1007/s11882-021-01015-w - DOI - PMC - PubMed
    1. WORLDOMETER. COVID-19 Coronavirus Pandemic. (2022). Available online at: https://www.worldometers.info/coronavirus/ (accessed October 07, 2022).
    1. Brasil . Ministério da Saúde. Brasil confirma primeiro caso do novo coronavírus. (2020). Available online at: https://www.gov.br/pt-br/noticias/saude-e-vigilancia-sanitaria/2020/02/b... (accessed June 23, 2021).
    1. Flaxman S, Mishra S, Gandy A, Unwin HJT, Mellan TA, Coupland H, et al. . Estimating the effects of non-pharmaceutical interventions on COVID-19 in Europe. Nature. (2020) 584:257–61. 10.1038/s41586-020-2405-7 - DOI - PubMed

Publication types

MeSH terms