Review
. 2022 Nov 10:46:105-127.
doi: 10.1016/j.euros.2022.10.017. eCollection 2022 Dec.

Molecular Biomarkers for the Detection of Clinically Significant Prostate Cancer: A Systematic Review and Meta-analysis

Affiliations
Review

Molecular Biomarkers for the Detection of Clinically Significant Prostate Cancer: A Systematic Review and Meta-analysis

Tasmania Del Pino-Sedeño et al. Eur Urol Open Sci. .

Abstract

Context: Prostate cancer (PCa) is the second most common type of cancer in men. Individualized risk stratification is crucial to adjust decision-making. A variety of molecular biomarkers have been developed in order to identify patients at risk of clinically significant PCa (csPCa) defined by the most common PCa risk stratification systems.

Objective: The present study aims to examine the effectiveness (diagnostic accuracy) of blood or urine-based PCa biomarkers to identify patients at high risk of csPCa.

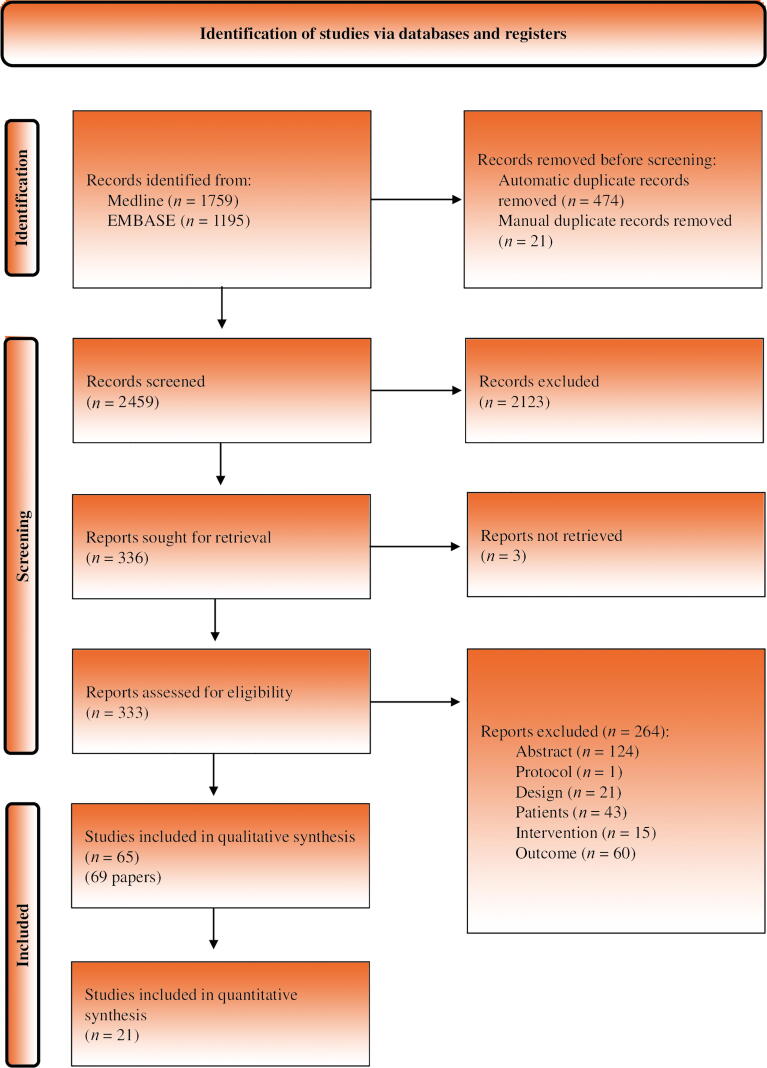
Evidence acquisition: A systematic review of the literature was conducted. Medline and EMBASE were searched from inception to March 2021. Randomized or nonrandomized clinical trials, and cohort and case-control studies were eligible for inclusion. Risk of bias was assessed using the Quality Assessment of Diagnostic Accuracy Studies-2 (QUADAS-2) tool. Pooled estimates of sensitivity, specificity, and area under the curve were obtained.

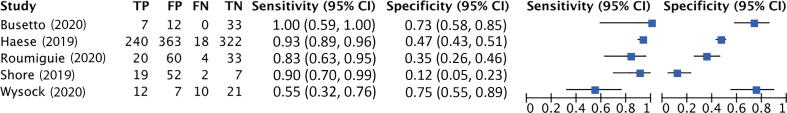
Evidence synthesis: Sixty-five studies (N = 34 287) were included. Not all studies included prostate-specific antigen-selected patients. The pooled data showed that the Prostate Health Index (PHI), with any cutoff point between 15 and 30, had sensitivity of 0.95-1.00 and specificity of 0.14-0.33 for csPCa detection. The pooled estimates for SelectMDx test sensitivity and specificity were 0.84 and 0.49, respectively.

Conclusions: The PHI test has a high diagnostic accuracy rate for csPCa detection, and its incorporation in the diagnostic process could reduce unnecessary biopsies. However, there is a lack of evidence on patient-important outcomes and thus more research is needed.

Patient summary: It has been possible to verify that the application of biomarkers could help detect prostate cancer (PCa) patients with a higher risk of poorer evolution. The Prostate Health Index shows an ability to identify 95-100 for every 100 patients suffering from clinically significant PCa who take the test, preventing unnecessary biopsies in 14-33% of men without PCa or insignificant PCa.

Keywords: Clinically significant cancer; Meta-analysis; Molecular markers; Prostatic neoplasms; Systematic review.


Figures

Fig. 1
Fig. 1
PRISMA flow chart detailing the screening process. PRISMA = Preferred Reporting Items for Systematic Reviews and Meta-analyses.
Fig. 2
Fig. 2
Risk of bias and applicability concerns (QUADAS-2 tool): (A) across studies and (B) within studies. QUADAS-2 = Quality Assessment of Diagnostic Accuracy Studies-2.
Fig. 2
Fig. 2
Risk of bias and applicability concerns (QUADAS-2 tool): (A) across studies and (B) within studies. QUADAS-2 = Quality Assessment of Diagnostic Accuracy Studies-2.
Fig. 3
Fig. 3
Accuracy of SelectMDx test for csPCa detection. (A) Forest plot of sensitivity and specificity. (B) Summary receiver operating characteristic (SROC) curve. AUC = area under the curve; CI = confidence interval; csPCa = clinically significant prostate cancer; FN = false negative; FP = false positive; SENS = sensitivity; SPEC = specificity; TN = true negative; TP = true positive.
Fig. 3
Fig. 3
Accuracy of SelectMDx test for csPCa detection. (A) Forest plot of sensitivity and specificity. (B) Summary receiver operating characteristic (SROC) curve. AUC = area under the curve; CI = confidence interval; csPCa = clinically significant prostate cancer; FN = false negative; FP = false positive; SENS = sensitivity; SPEC = specificity; TN = true negative; TP = true positive.
Fig. 4
Fig. 4
Accuracy of PHI test for csPCa detection. (A) Forest plot of sensitivity and specificity: cutoff point 15–20. (B) Summary receiver operating characteristic (SROC) curve: cutoff point 15–20. (C) Forest plot of sensitivity and specificity: cutoff point 20–25. (D) SROC curve: cutoff point 20–25. (E) Forest plot of sensitivity and specificity: cutoff point 25–30. (F) SROC curve: cutoff point 25–30. AUC = area under the curve; CI = confidence interval; csPCa = clinically significant prostate cancer; FN = false negative; FP = false positive; PHI = Prostate Health Index; SENS = sensitivity; SPEC = specificity; TN = true negative; TP = true positive.
Fig. 4
Fig. 4
Accuracy of PHI test for csPCa detection. (A) Forest plot of sensitivity and specificity: cutoff point 15–20. (B) Summary receiver operating characteristic (SROC) curve: cutoff point 15–20. (C) Forest plot of sensitivity and specificity: cutoff point 20–25. (D) SROC curve: cutoff point 20–25. (E) Forest plot of sensitivity and specificity: cutoff point 25–30. (F) SROC curve: cutoff point 25–30. AUC = area under the curve; CI = confidence interval; csPCa = clinically significant prostate cancer; FN = false negative; FP = false positive; PHI = Prostate Health Index; SENS = sensitivity; SPEC = specificity; TN = true negative; TP = true positive.
Supplementary figure

References

    1. Sung H., Ferlay J., Siegel R.L., et al. Global cancer statistics 2020: GLOBOCAN estimates of incidence and mortality worldwide for 36 cancers in 185 countries. Cancer J Clin. 2021;71:209–249. - PubMed
    1. Torre L.A., Siegel R.L., Ward E.M., Jemal A. Global cancer incidence and mortality rates and trends—an update. Cancer Epidemiol Biomarkers Prev. 2016;25:16–27. - PubMed
    1. Bell K.J.L., Del Mar C., Wright G., Dickinson J., Glasziou P. Prevalence of incidental prostate cancer: a systematic review of autopsy studies. Int J Cancer. 2015;137:1749–1757. - PMC - PubMed
    1. Ferlay J., Ervik M., Lam F., et al. International Agency for Research on Cancer; Lyon, France: 2020. Global cancer observatory: cancer today; p. 419.
    1. National Cancer Institute . National Institutes of Health; Bethesda, MD: 2019. SEER cancer stat facts.https://seer.cancer.gov/statfacts/html/mulmy.html

LinkOut - more resources