. 2022 Nov 9;2(11):None.
doi: 10.1016/j.xgen.2022.100179.

Uncovering novel mutational signatures by de novo extraction with SigProfilerExtractor

Affiliations

Uncovering novel mutational signatures by de novo extraction with SigProfilerExtractor

S M Ashiqul Islam et al. Cell Genom. .

Abstract

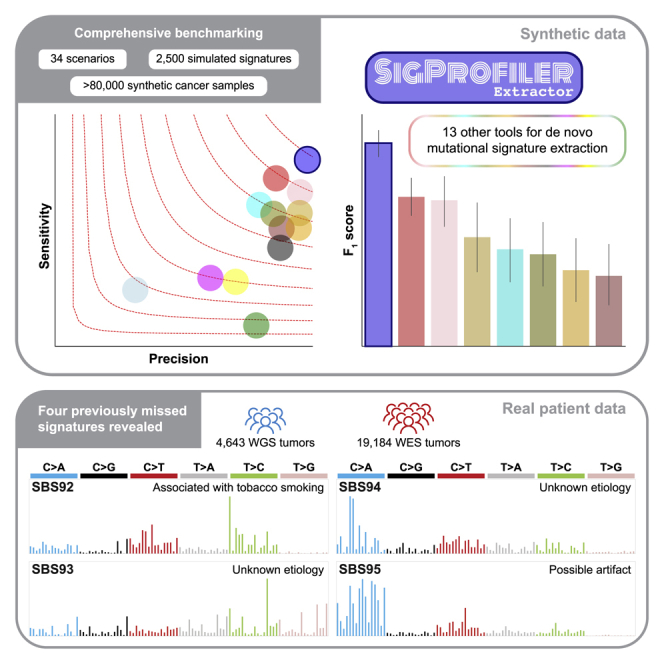
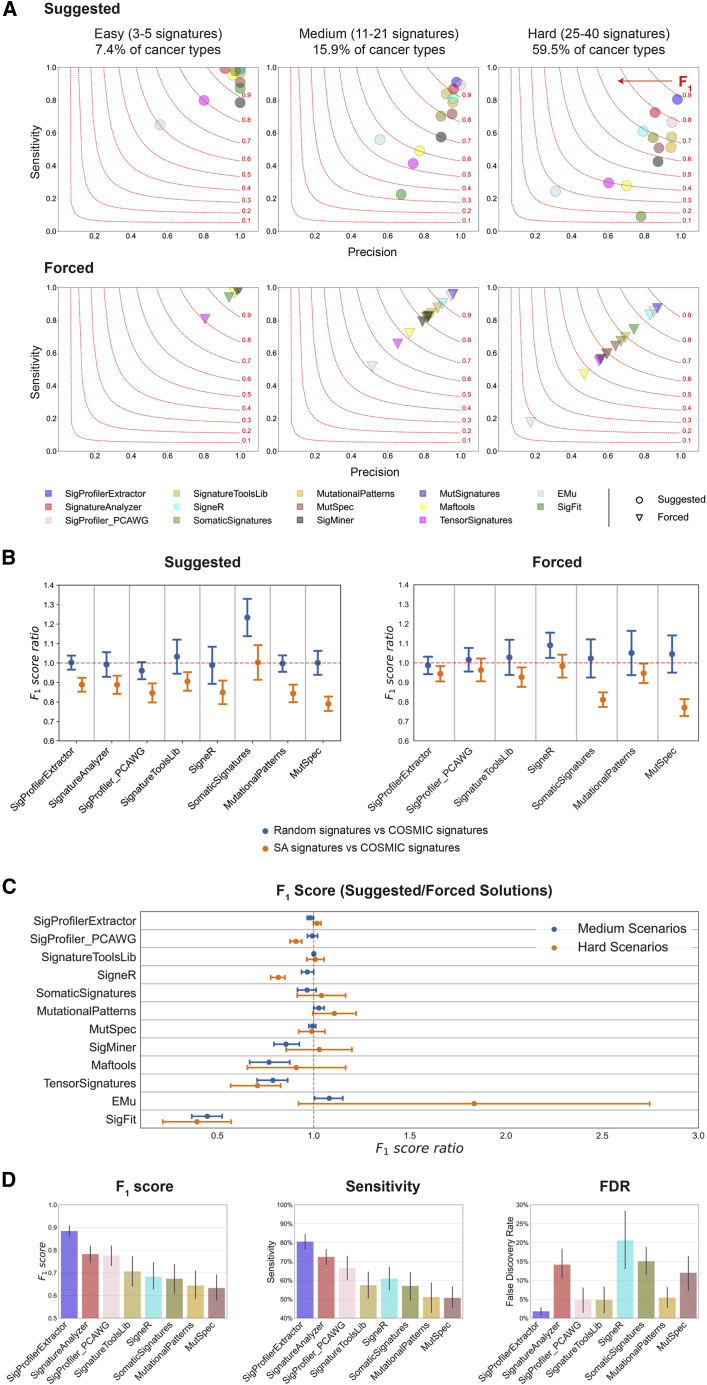
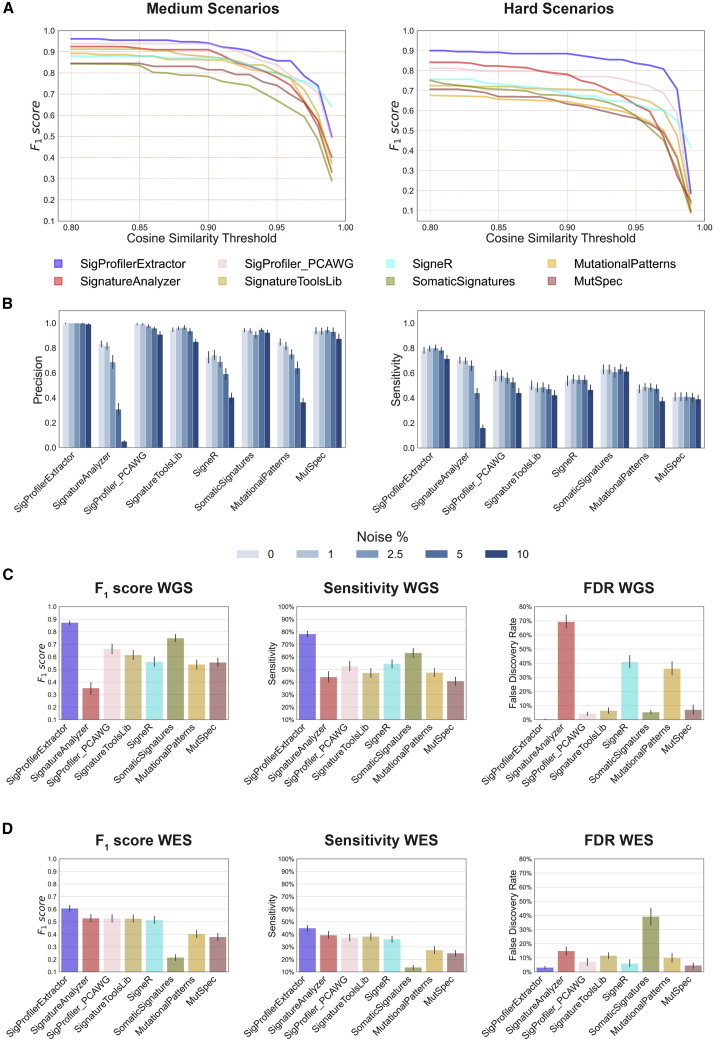
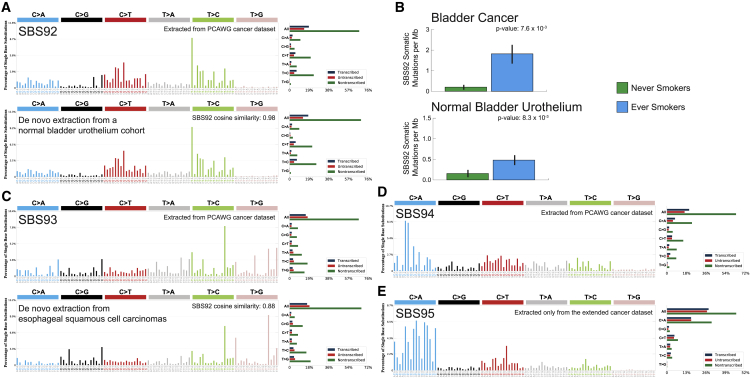
Mutational signature analysis is commonly performed in cancer genomic studies. Here, we present SigProfilerExtractor, an automated tool for de novo extraction of mutational signatures, and benchmark it against another 13 bioinformatics tools by using 34 scenarios encompassing 2,500 simulated signatures found in 60,000 synthetic genomes and 20,000 synthetic exomes. For simulations with 5% noise, reflecting high-quality datasets, SigProfilerExtractor outperforms other approaches by elucidating between 20% and 50% more true-positive signatures while yielding 5-fold less false-positive signatures. Applying SigProfilerExtractor to 4,643 whole-genome- and 19,184 whole-exome-sequenced cancers reveals four novel signatures. Two of the signatures are confirmed in independent cohorts, and one of these signatures is associated with tobacco smoking. In summary, this report provides a reference tool for analysis of mutational signatures, a comprehensive benchmarking of bioinformatics tools for extracting signatures, and several novel mutational signatures, including one putatively attributed to direct tobacco smoking mutagenesis in bladder tissues.

Keywords: cancer genomics; genomics; mutagenesis; mutational signatures.


Conflict of interest statement

M.V. is an employee of NVIDIA corporation. L.B.A. is a compensated consultant and has equity interest in io9, LLC. His spouse is an employee of Biotheranostics, Inc. L.B.A. and B.S.A. are inventors of a US patent 10,776,718. E.N.B. and L.B.A. declare US provisional applications with serial numbers 63/289,601 and 63/269,033. L.B.A. and A.A. declare US provisional patent applications with serial numbers 63/366,392 and 63/367,846. All other authors declare no competing interests.

Figures

None
Graphical abstract
Figure 1
Figure 1
Overview of SigProfilerExtractor (A) SigProfilerExtractor’s general workflow is outlined starting from an input of somatic mutations and resulting in an output of de novo mutational signatures. An example is shown for a solution with three de novo signatures. Somatic mutations are first converted into a mutational matrix M. Subsequently, the matrix is factorized with different ranks using nonnegative matrix factorization. Model selection is applied to identify the optimal factorization rank based on each solution’s stability and its reconstruction of the original data. (B) Schematic representation for an example decomposition with a factorization rank of k = 3 reflecting three operative mutational signatures. By default, SigProfilerExtractor performs 100 independent nonnegative matrix factorizations with the matrix M being Poisson resampled and normalized (denoted by “ˆ”) prior to each factorization. Partition clustering of the 100 factorizations is used to evaluate the factorization stability rank, measured in silhouette values; clustering can also be presented as two-dimensional projections revealing more similar mutational signatures as shown for the three example signatures. The centroid of the clustered solutions (denoted by “–”) is compared with the original matrix M. (C) All identified de novo signatures are matched to a combination of known COSMIC mutational signatures. An example is given for de novo extracted signature SBS96B, which matches a combination of COSMIC signatures SBS1, SBS2, and SBS13.
Figure 2
Figure 2
Benchmarking of bioinformatics tools for de novo extraction of mutational signatures using SBS-96 noiseless scenarios (A) Average precision (x axes), sensitivities (y axes), and F1 scores (harmonic mean of precision and sensitivity; red curves) are shown across the three types of scenarios. Different tools are displayed using circles and triangles with different colors. Circles are used to display results for suggested model selection, which most closely matches analysis of a real dataset. Triangles are used to display results for forced model selection, where tools were required to extract the known total number of ground-truth mutational signatures. All triangles are located on the diagonal, as the forced model selection results in equal numbers of false-positive and false-negative signatures. (B) Evaluating the effect of ground-truth signatures on the de novo extraction by different tools (x axes). Ratio of F1 scores (y axes) with standard errors of the mean were calculated for medium complexity scenarios simulated using COSMIC, SA, or random signatures. Ratio of approximately 1.00 indicates a similar performance between different types of signatures. (C) Evaluating the performance of de novo extraction between suggested and forced selection for different tools (x axes). Ratio of F1 scores (y axes) with standard errors of the mean was calculated for all medium and hard scenarios. Ratio of approximately 1.00 indicates a similar performance between suggested and forced model selection. (D) Summary of the performance for the top eight tools on hard SBS-96 noiseless scenarios with suggested model selection. Vertical axes reflect F1 score (left plot), sensitivity (middle plot), and false discovery rate (right plot), respectively. Error bars correspond to standard errors of the mean. Results from SignatureAnalyzer and MutSignatures are not displayed in (A)–(C) for forced and suggested model selections, respectively, as the tools do not support these types of analyses.
Figure 3
Figure 3
Additional evaluations of the top eight bioinformatics tools for de novo extraction of mutational signatures (A) Average F1 scores for the top eight tools based on different thresholds for cosine similarity in suggested medium and hard scenarios; thresholds for cosine similarity are used for determining true-positive signatures (Figure S1). Horizontal axes reflect the cosine similarity thresholds, while vertical axes correspond to the average F1 scores corresponding to cosine similarity thresholds. (B) Precision and sensitivity of the top eight tools for SBS-96 WGS scenarios with different levels of noise. Noise levels reflect the average number of somatic mutations in a cancer genome affected by additive white Gaussian noise; for example, 1% noise corresponds to approximately 1% of mutations in a sample being due to noise. Error bars correspond to standard errors of the mean. (C and D) Summary of the performance of the top eight tools on SBS-96 (C) WGS and (D) WES scenarios with 5% noise. Vertical axes reflect F1 score (left plot), sensitivity (middle plot), and false discovery rate (right plot), respectively. Error bars correspond to standard errors of the mean.
Figure 4
Figure 4
Novel signatures identified in a cohort of 4,643 WGS and 19,184 WES cancers Mutational signatures are displayed using 96 plots. Single base substitutions are shown using the six subtypes of substitutions: C>A, C>G, C>T, T>A, T>C, and T>G. Underneath each subtype are 16 bars reflecting the sequence contexts determined by the four possible bases 5′ and 3′ to each mutated base. Additional information whether mutations from a signature are in nontranscribed/intergenic DNA, on the transcribed strand of a gene, or on the untranscribed strand of the gene is provided adjacent to the 96 plots. (A) Mutational profile of signature SBS92 derived from the PCAWG cohort (top). Confirmation of the profile of signature SBS92 (bottom) by analysis of an independent WGS set of microbiopsies of histologically normal urothelium. (B) Bars are used to display average values for numbers of somatic substitutions per Mb attributed to signature SBS92 in bladder cancer and normal bladder urothelium. Green bars represent never smokers, whereas blue bars correspond to ever smokers. Error bars correspond to 95% confidence intervals. Each p value is based on a Wilcoxon rank-sum test. (C) Mutational profile of signature SBS93 derived from the PCAWG cohort (top). Confirmation of the profile of signature SBS93 (bottom) by analysis of an independent WGS set of esophageal squamous cell carcinomas. (D) Mutational profile of signature SBS94 derived from the PCAWG cohort. (E) Mutational profile of signature SBS95 derived only from liver hepatocellular carcinomas of the extended cohort. Signatures SBS94 and SBS95 were not identified in any additional independent cohort.

References

    1. Stratton M.R., Campbell P.J., Futreal P.A. The cancer genome. Nature. 2009;458:719–724. doi: 10.1038/nature07943. - DOI - PMC - PubMed
    1. Hollstein M., Hergenhahn M., Yang Q., Bartsch H., Wang Z.-Q., Hainaut P. New approaches to understanding p53 gene tumor mutation spectra. Mutat. Res. 1999;431:199–209. doi: 10.1016/s0027-5107(99)00162-1. - DOI - PubMed
    1. Vogelstein B., Papadopoulos N., Velculescu V.E., Zhou S., Diaz L.A., Jr., Kinzler K.W. Cancer genome landscapes. Science. 2013;339:1546–1558. doi: 10.1126/science.1235122. - DOI - PMC - PubMed
    1. Alexandrov L.B., Nik-Zainal S., Wedge D.C., Campbell P.J., Stratton M.R. Deciphering signatures of mutational processes operative in human cancer. Cell Rep. 2013;3:246–259. doi: 10.1016/j.celrep.2012.12.008. - DOI - PMC - PubMed
    1. Alexandrov L.B. Understanding the origins of human cancer. Science. 2015;350:1175. doi: 10.1126/science.aad7363. - DOI - PubMed