. 2022 Oct 20;25(11):105424.
doi: 10.1016/j.isci.2022.105424. eCollection 2022 Nov 18.

Endothelial SIRT-1 has a critical role in the maintenance of capillarization in brown adipose tissue

Affiliations

Endothelial SIRT-1 has a critical role in the maintenance of capillarization in brown adipose tissue

Ryo Furuuchi et al. iScience. .

Abstract

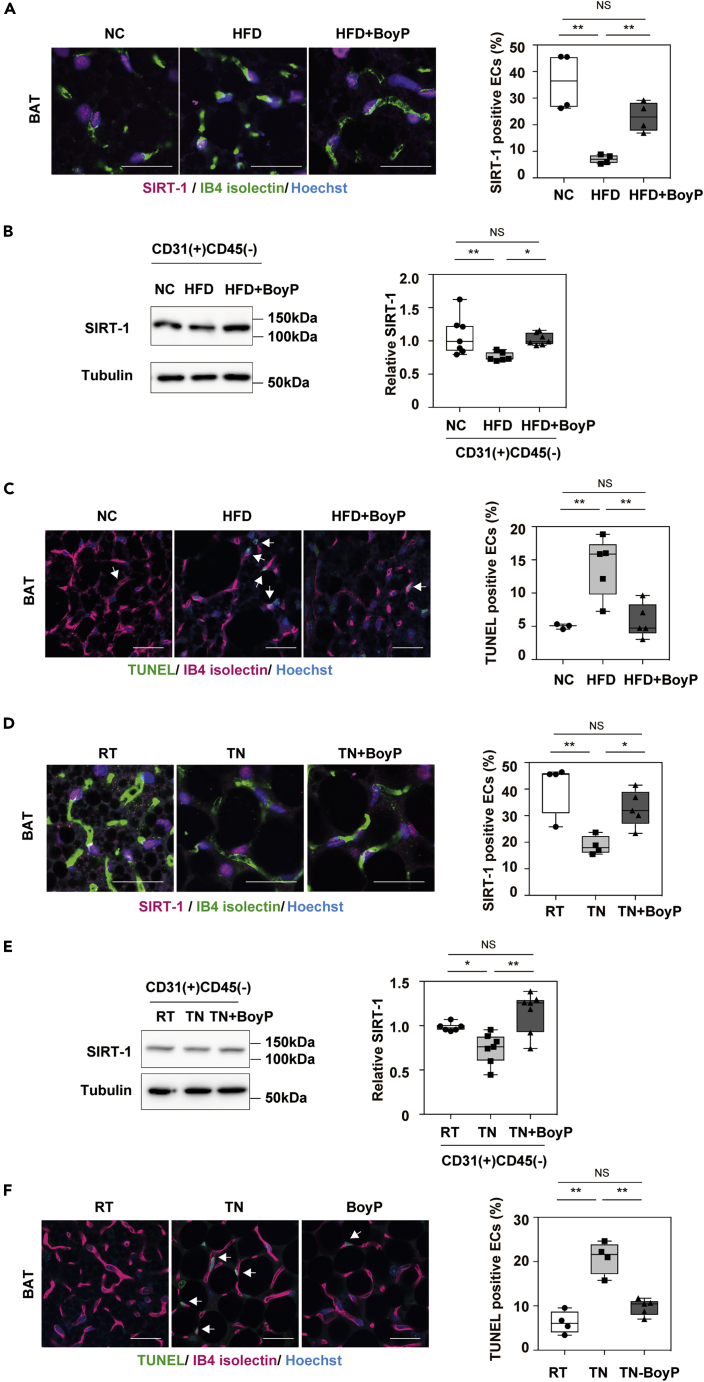
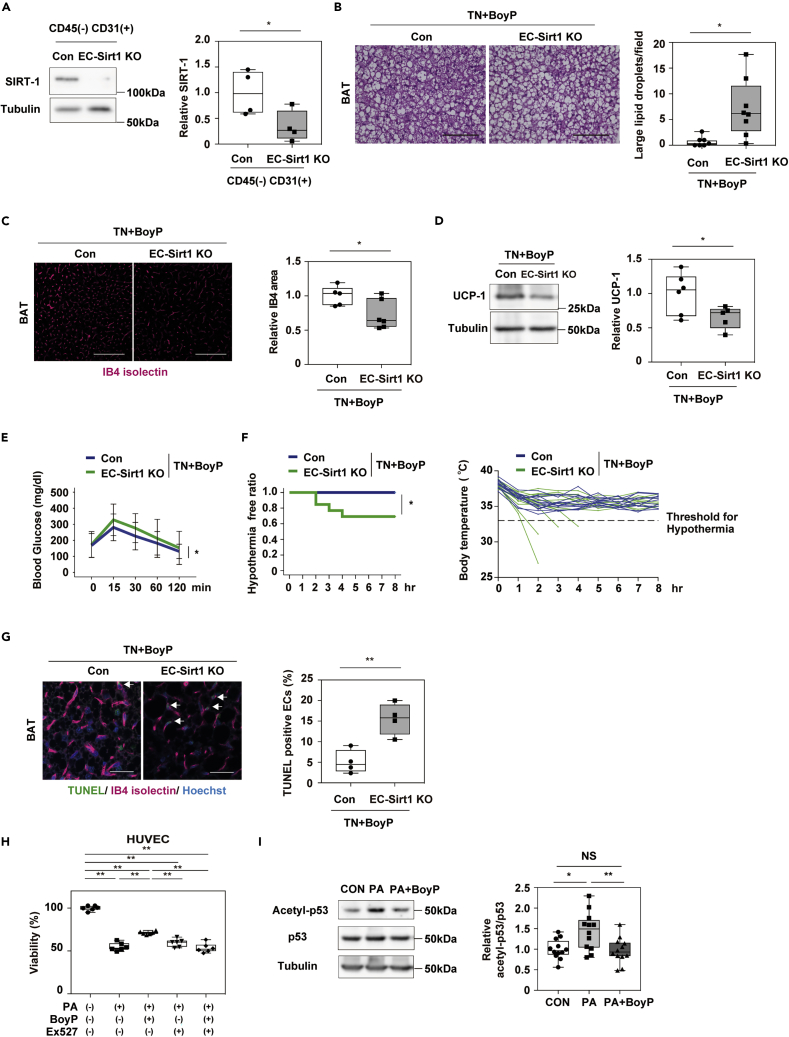
Brown adipose tissue (BAT) has critical roles in thermogenesis and systemic metabolism. Capillary rarefaction was reported to develop in BAT with dietary obesity, and previous studies showed that suppression of vascular endothelial growth factor A (VEGF-A) reduced capillary density in BAT, promoting the functional decline of this organ. Capillarization is regulated through the balance between angiogenesis and vasculogenesis on the one hand and apoptosis of endothelial cells (ECs) on the other; however, the role of EC apoptosis in BAT remained to be explored. In studies testing the role of boysenberry polyphenols (BoyP) in BAT, we found that BoyP decreased EC apoptosis, enhanced capillarization in BAT, and ameliorated dietary BAT dysfunction, which was associated with the upregulation of nicotinamide adenine dinucleotide-dependent protein deacetylase sirtuin 1 (SIRT-1) in ECs. Our studies suggest that EC SIRT-1 would be one of the potential targets of BoyP that contributes to BAT capillarization and function.

Keywords: Biological sciences; Cell biology; Molecular biology.


Conflict of interest statement

R.F. is a member of Bourbon Corporation; however, this company did not play any role in the study design, data collection, and analysis, decision to publish, or preparation of the article and only provided financial support in the form of the author’s salary and research materials. None of the other authors has a conflict of interest to declare.

Figures

None
Graphical abstract
Figure 1
Figure 1
Boysenberry polyphenol ameliorates brown adipose tissue dysfunction (A–E) Mice were fed a normal chow (NC) diet or high-fat diet (HFD) from 4 weeks of age for 17 weeks. Some HFD mice were given 0.1% boysenberry polyphenols (HFD + BoyP) through their drinking water also from 4 weeks of age. (A) Hematoxylin and eosin (HE) staining of brown adipose tissue (BAT) of the indicated mice (scale bars = 100 μm). The right panel indicates the number of large lipid droplets (defined as droplets with a surface area >250 μm2) per view (n = 4, 4, 4). (B) BAT was weighed in the indicated groups (n = 11, 16, 16, excluding the outliers of n = 1, 1, 1). (C) Results of quantitative polymerase chain reaction (qPCR) for Ppargc1a (n = 8, 10, 11, excluding the outlier of n = 1 in HFD) and Ucp1 (n = 8, 10, 10, excluding the outlier of n = 2 in HFD + BoyP) in BAT. (D) Results of glucose tolerance test (GTT, n = 6, 6, 6). (E) Results of cold tolerance test (CTT) in a cold room at 4°C. The left panel shows the incidence of severe hypothermia (defined as a body temperature below 33°C), and the right panel shows raw body temperature data. (n = 9, 9, 9). (F-J) NC-fed mice were maintained under thermoneutral (TN; 30°C) or room temperature (RT; 24°C) conditions at age 11 to 15 weeks, and some mice were administered 0.1% BoyP in their drinking water. (F) Images of HE staining of BAT and the number of large lipid droplets per view in the indicated groups (n = 4, 4, 4, excluding the outlier of n = 1 in RT). Scale bars = 100μm. (G) BAT weight in RT, TN, and TN + BoyP mice (n = 8, 9, 9). (H) qPCR studies for Ppargc1a (n = 11, 13, 13, excluding the outliers of n = 3 in TN) and Ucp1 (n = 12, 12, 13, excluding the outliers of n = 1, 2, 1) in BAT. (I) Results of GTT (n = 8, 9, 9). (J) Results of CTT (n = 8, 14, 14). The left panel shows the incidence of severe hypothermia (defined as a body temperature below 33°C), and the right panel shows raw body temperature data. Data, where equal variances were assumed, were analyzed with one-way analysis of variance (ANOVA) followed by Tukey’s multiple comparison test (A, B, F, and G) or repeated ANOVA followed by Tukey’s multiple comparison test (D and I). Data, where equal variances were not assumed, were analyzed by Dunnett’s T3 test (C and H). Data were analyzed by the log-rank test (E and J). ∗p < 0.05; ∗∗p < 0.01. Boxplots show the upper whisker, upper quartile, median, lower quartile, and lower whisker, and dots indicate raw data (A–C and F–H). Values represent the mean ± SD. (D and I). NS indicates that the difference was not significant. See also Figure S1.
Figure 2
Figure 2
Boysenberry polyphenols suppress capillary rarefaction in brown adipose tissue (A) Capillary network in brown adipose tissue (BAT) of normal chow (NC), high-fat diet (HFD), and HFD + boysenberry polyphenols (BoyP) mice were analyzed by IB4 isolectin immunofluorescence staining (scale bars = 100μm). The right panel indicates the relative area positive for IB4 (n = 5, 5, 5). (B) Capillary network tested with IB4 isolectin immunostaining in BAT of room temperature (RT), thermoneutral (TN; 30°C), and TN + BoyP mice (scale bars = 100 μm). The right panel indicates the relative area positive for IB4 (n = 4, 4, 5). (C and D) Western blot to test the level of Sirtuin-1 (SIRT-1), tubulin, and actin in the BAT of the indicated groups. The right panels show the quantification of SIRT-1 in the indicated groups compared with the respective controls (C: n = 4, 4, 4, excluding the outlier of n = 1 in HFD; D: n = 8, 8, 8). Data were analyzed with one-way analysis of variance followed by Tukey’s multiple comparison test. ∗p < 0.05; ∗∗p < 0.01. Boxplots show the upper whisker, upper quartile, median, lower quartile, and lower whisker, and dots indicate raw data (A–D). NS indicates not significant. See also Figure S2.
Figure 3
Figure 3
Nicotinamide adenine dinucleotide -dependent protein deacetylase sirtuin 1 in brown adipocytes does not affect capillarization in brown adipose tissue (A–G) Mice were fed a high-fat diet (HFD) from 4 to 22 weeks of age, and adeno-associated virus encoding Sirt1 (AAV-Sirt1) was injected into brown adipose tissue (BAT) at 17 weeks of age. (A) Western blot to test the level of nicotinamide adenine dinucleotide -dependent protein deacetylase sirtuin-1 (SIRT-1) in BAT of AAV-Sirt1 and AAV-GFP groups. The right panel indicates the quantification of SIRT-1 compared with α-tubulin (n = 4, 3, excluding the outliers of n = 1, 2). (B) Immunofluorescence staining to analyze SIRT-1 (red), IB4-isolectin (green), and nuclei (Hoechst; blue) in BAT of the indicated groups (scale bars = 50μm). SIRT-1-positive cells were counted in IB4-negative (−) or -positive (+) cells in the indicated groups (n = 5, 5, 3, 5, excluding the outliers of n = 2 for IB4(+) in AAV-GFP). (C) Hematoxylin and eosin (HE) staining of BAT in the indicated groups (scale bars = 100 μm). The right panels show the number of large lipid droplets (defined as droplets with a surface area >250 μm2) per field (n = 5, 5). (D) Results of glucose tolerance test (GTT) (n = 5, 5). (E) Cold tolerance test (CTT) (n = 5, 5) of the indicated groups. The upper panel shows the incidence of severe hypothermia (defined as a body temperature below 33°C), and the lower panel shows raw body temperature data. (F) IB4-isolectin immunostaining image and relative area positive for IB4 (scale bars = 100 μm; n = 5, 5). (G) Results of quantitative polymerase chain reaction (qPCR) for Ppargc1a (n = 4, 5 excluding the outlier of n = 1 in AAV-GFP) and Ucp1 (n = 5, 3, excluding the outliers of n = 2 in AAV-Sirt1) in BAT of the indicated groups (n = 5, 5). (H–L) BAT-specific Sirt1 knockout mice (UCP-1 Cre+/− ; Sirt1flox/flox; BAT-Sirt1 KO) were fed normal chow, maintained under thermoneutral conditions (30°C), and administered 0.1% BoyP in the drinking water. (H) HE staining of BAT (scale bars = 100 μm) and number of large lipid droplets (defined as droplets with a surface area >250 μm2) per field (n = 4, 5, excluding the outlier of n = 1 in WT). (I) Results of GTT (n = 10, 11). (J) CTT (n = 11, 11) in the indicated groups. The upper panel shows the incidence of severe hypothermia (defined as a body temperature below 33°C), and the lower panel shows raw body temperature data. (K) IB4-isolectin immunofluorescence staining and relative area positive for IB4 in the indicated groups (scale bars = 100 μm; n = 5, 5). (L) Results of qPCR for Ucp1 (n = 8, 9, excluding the outliers of n = 1, 1) and Ppargc1a (n = 8, 7, excluding the outliers of n = 2, 2) in BAT. Data were analyzed by two-tailed Student’s t test (A, C, F, G, H, K, and L), one-way analysis of variance (ANOVA) followed by Tukey’s multiple comparison test (B), repeated ANOVA (D and E), or the log-rank test (E and J). ∗p < 0.05; ∗∗p < 0.01. Boxplots show the upper whisker, upper quartile, median, lower quartile, and lower whisker, and dots indicate raw data (A–C, F–H, K, and L). Values represent the mean ± SD. (D and I). NS indicates not significant. See also Figure S3.
Figure 4
Figure 4
Boysenberry polyphenols enhanced nicotinamide adenine dinucleotide-dependent protein deacetylase sirtuin 1 expression and suppressed apoptosis in endothelial cells of brown adipose tissue Mice were fed a normal chow (NC) diet or high fat diet (HFD) from 4 weeks of age for 17 weeks. Some HFD mice were given 0.1% boysenberry polyphenols (HFD + BoyP) through their drinking water from 4 weeks of age. (A) Immunofluorescence staining to analyze nicotinamide adenine dinucleotide-dependent protein deacetylase sirtuin 1 (SIRT-1; red), IB4-isolectin (green), and nuclei (Hoechst; blue) in brown adipose tissue (BAT) of the indicated groups (scale bars = 50 μm). The right panel indicates the ratio of SIRT-1–positive endothelial cells (ECs; n = 4, 4, 4). (B) Western blot study to analyze SIRT-1 in CD31(+) CD45(-) cells of BAT. The right panel indicates the relative SIRT-1 level compared with the tubulin loading control (n = 6, 7, 7, excluding the outlier of n = 1 in NC). (C) Immunofluorescence staining to analyze terminal deoxynucleotidyl transferase-mediated dUTP nick end labeling (TUNEL; green), ECs (IB4-isolectin, red) and nuclei (Hoechst; blue) in the indicated groups (scale bars = 50 μm). The right panel indicates TUNEL-positive ECs (%; n = 3, 5, 5, excluding the outliers of n = 2 in NC). (D) Immunofluorescence staining of SIRT-1 (red), ECs (IB4-isolectin, green), and nuclei (Hoechst; blue) in BAT of the indicated mice fed NC (scale bars = 50 μm). The right panel indicates SIRT-1–positive ECs (%; n = 4, 4, 5). (E) Western blot analyses to detect SIRT-1 and tubulin levels in CD31(+) CD45(-) cells from BAT of the indicated mice fed NC (n = 6, 7, 7, excluding the outliers of n = 1 in RT). The right panel indicates the quantification of SIRT-1 against the tubulin loading control. (F) Immunofluorescence staining to analyze TUNEL (green), ECs (IB4-isolectin, red), and nuclei (Hoechst; blue) of the indicated mice fed NC (scale bars = 50 μm). The right panel indicates TUNEL-positive ECs (%; n = 4, 4, 5). Data were analyzed with one-way analysis of variance followed by Tukey’s multiple comparison test. ∗p < 0.05; ∗∗p < 0.01. Boxplots show the upper whisker, upper quartile, median, lower quartile, and lower whisker, and dots indicate raw data (A-F). NS indicates not significant. See also Figure S4.
Figure 5
Figure 5
Depletion of nicotinamide adenine dinucleotide-dependent protein deacetylase sirtuin 1 in endothelial cells abolished effect of boysenberry polyphenols in brown adipose tissue VEcadherin-BAC-CreERT2+/-; Sirt1flox/flox (endothelial cell [EC]-Sirt1 knockout [KO]) and VEcadherin-BAC-CreERT2-/-; Sirt1flox/flox (Con) mice were fed normal chow (NC), maintained under thermoneutral (TN) conditions (30℃) and administered 0.1% boysenberry polyphenols (BoyP) in their drinking water (TN + BoyP) from 11 to 17 weeks of age. At 13 weeks of age, these mice were subjected to further analyses. (A) Western blot to analyze expression of SIRT-1 in CD45(-) CD31(+) cells of brown adipose tissue (BAT) in indicated groups fed NC under room temperature (n = 4, 4). (B) Hematoxylin and eosin staining of BAT in indicated groups under TN + BoyP conditions (scale bars = 100 μm). The right panel indicates the number of large lipid droplets (defined as droplets with a surface area > 250 μm2) per view (n = 8, 9, excluding the outliers of n = 1, 1). (C) Capillary network analyzed with IB4-isolectin immunofluorescence staining (scale bars = 100 μm). The right panel indicates the relative area positive for IB4 (n = 5, 6). (D) Western blot to analyze UCP-1 in BAT of the indicated groups (n = 6, 6). (E) Results of glucose tolerance test (n = 15, 13). (F) Results of cold tolerance test (n = 14, 13). The left panel shows the incidence of severe hypothermia (defined as a body temperature below 33℃), and the right panel shows raw body temperature data. (G) Apoptosis of IB4-positive cells were analyzed by terminal deoxynucleotidyl transferase-mediated dUTP nick end labeling (TUNEL) staining (scale bars = 50 μm). The right panel indicates TUNEL-positive ECs in the indicated groups (n = 4, 4). (H) 3-(4,5-dimethyl-2-thiazolyl)-2,5-diphenyl-2H-tetrazolium bromide (MTT) assay to analyze the viability of human umbilical vein endothelial cells under the following conditions: 100 μM palmitic acid, 1 μg/mL BoyP, and 10 μM Ex527 (a SIRT-1 inhibitor; n = 6, 6, 6, 6, 6). (I) Western blot analyses for the levels of Acetyl-p53, p53, and tubulin in human umbilical vein endothelial cells (HUVEC) treated with 100 μM palmitic acid 1 μg/mL ± BoyP for 24 hours. The right panels show quantification of acetyl-p53/p53 in the indicated groups compared with the respective controls (n = 12, 12, 12). Data were analyzed by the two-tailed Student’s t test (A, B, C, D and G), one-way analysis of variance (ANOVA) followed by Tukey’s multiple comparison test (H, I), repeated ANOVA (E), or log rank test (F). ∗p < 0.05; ∗∗p < 0.01. Boxplots show the upper whisker, upper quartile, median, lower quartile, and lower whisker, and dots indicate raw data (A-D, G-I). Values represent the mean ± SD. (E). NS indicates not significant. See also Figure S5.

References

    1. Aubrey B.J., Kelly G.L., Janic A., Herold M.J., Strasser A. How does p53 induce apoptosis and how does this relate to p53-mediated tumour suppression? Cell Death Differ. 2018;25:104–113. - PMC - PubMed
    1. Bartelt A., Bruns O.T., Reimer R., Hohenberg H., Ittrich H., Peldschus K., Kaul M.G., Tromsdorf U.I., Weller H., Waurisch C., et al. Brown adipose tissue activity controls triglyceride clearance. Nat. Med. 2011;17:200–U293. - PubMed
    1. Becher T., Palanisamy S., Kramer D.J., Eljalby M., Marx S.J., Wibmer A.G., Butler S.D., Jiang C.S., Vaughan R., Schöder H., et al. Brown adipose tissue is associated with cardiometabolic health. Nat. Med. 2021;27:58–65. - PMC - PubMed
    1. Clayton Z.S., McCurdy C.E. Short-term thermoneutral housing alters glucose metabolism and markers of adipose tissue browning in response to a high-fat diet in lean mice. Am. J. Physiol. Regul. Integr. Comp. Physiol. 2018;315:R627–R637. - PMC - PubMed
    1. Cui X., Nguyen N.L.T., Zarebidaki E., Cao Q., Li F., Zha L., Bartness T., Shi H., Xue B. Thermoneutrality decreases thermogenic program and promotes adiposity in high-fat diet-fed mice. Physiol. Rep. 2016;4:e12799. - PMC - PubMed

LinkOut - more resources