. 2022 Oct 31:13:1040031.
doi: 10.3389/fimmu.2022.1040031. eCollection 2022.

IL-2 availability regulates the tissue specific phenotype of murine intra-hepatic Tregs

Affiliations

IL-2 availability regulates the tissue specific phenotype of murine intra-hepatic Tregs

Ada S Kurt et al. Front Immunol. .

Abstract

CD4+CD25+Foxp3+ Tregs are known to acquire tissue-specific features and exert cytoprotective and regenerative functions. The extent to which this applies to liver-resident Tregs is unknown. In this study, we aimed to explore the phenotypic and functional characteristics of adult murine liver resident Tregs during homeostasis. Additionally, we investigated their role in ameliorating liver inflammation and tissue damage. Quantification of Foxp3+CD4+CD25+ cells comparing different tissues showed that the liver contained significantly fewer resident Tregs. A combination of flow cytometry phenotyping and microarray analysis of intra-hepatic and splenic Tregs under homeostatic conditions revealed that, although intra-hepatic Tregs exhibited the core transcriptional Treg signature, they expressed a distinct transcriptional profile. This was characterized by reduced CD25 expression and increased levels of pro-inflammatory Th1 transcripts Il1b and Ifng. In vivo ablation of Tregs in the Foxp3-DTR mouse model showed that Tregs had a role in reducing the magnitude of systemic and intra-hepatic inflammatory responses following acute carbon tetrachloride (CCl₄) injury, but their absence did not impact the development of hepatocyte necrosis. Conversely, the specific expansion of Tregs by administration of IL-2 complexes increased the number of intra-hepatic Tregs and significantly ameliorated tissue damage following CCl₄ administration in C57BL/6 mice. The cytoprotective effect observed in response to IL-2c was associated with the increased expression of markers known to regulate Treg suppressive function. Our results offer insight into the transcriptome and complex immune network of intra-hepatic Tregs and suggest that strategies capable of selectively increasing the pool of intra-hepatic Tregs could constitute effective therapies in inflammatory liver diseases.

Keywords: CCl₄ induced liver injury; Treg depletion; acute inflammation; liver; regulatory T cells (Tregs); tissue specific.


Conflict of interest statement

The authors declare that the research was conducted in the absence of any commercial or financial relationships that could be construed as a potential conflict of interest. The reviewer JH declared a shared consortium with one of the authors, AS-F, to the handling editor.

Figures
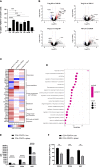
Figure 1
Figure 1
Intra-hepatic Tregs are less abundant but remain to exhibit a core Treg transcriptional signature and have a distinct molecular profile. (A) Quantification of the proportion of Foxp3+ CD4+CD25+ cells in the homogenised tissues of liver (LV) (n>8), spleen (SP) (n>8), peripheral lymph nodes (pLN), lung (LU), adipose tissue (AT), blood (BL), mesenteric lymph nodes (mLN) and thymus (TY) in homeostasis (n=4). (B–D) Whole genome microarray analysis in intra-hepatic and splenic Tregs versus T-effectors in Foxp3-YFP B6 mice (n=3). (B) Volcano plots showing difference in the transcriptome profile of intra-hepatic and splenic Tregs using normalised p-value versus fold change of all 20515 genes and splenic “Treg signature” is defined by up-regulated (red) and down-regulated (blue) genes above p-value of 0.05 and Fold change 2. (C) Heatmap exhibits pre-selected differentially expressed genes relevant to Treg function, tissue residency, tissue repair and metabolism between intra-hepatic and splenic Treg population and the significance is determined above p-value of 0.05 and Fold-change 2 (D) Gene set enrichment analysis of intra-hepatic Tregs compared with the splenic Tregs. Dot plot shows the top 20 up-regulated GO pathways of biological processes, molecular functions and cellular components with an FDR adjusted q-value of 0.020506. Dot size represents the number of genes enriched in the pathway, and gene ratio represents the ratio of the count of core enrichment genes to count of pathway genes. (E) CD4+Foxp3+ cells were gated from homogenised liver and spleen tissue to quantify the MFI of CD103, CD39 and KI67 (n=5). (F) Percentage of Foxp3+ cells expressing CD103, CD39 and KI67. Significance was determined by ordinary one-way ANOVA with Sidak’s multiple comparison test for (A) and two-way ANOVA with Tukey multiple comparison test for (E, F) and the values are shown as the mean ± SEM. For B-D, p<0.05 and Fold Change >2. MFI, geometric mean fluorescence intensity. *P < 0.05, **P < 0.01, ***P < 0.001 and ****P < 0.0001.
Figure 2
Figure 2
Hepatocyte necrosis is unaltered by Treg depletion. (A) Schematic representation of the experimental design for DT induced Treg depletion, 1ug diphtheria toxin (DT) was injected in Foxp3-DTR mice, 3 days prior to CCL₄ administration. Depletion of Foxp3+ cells was analysed by flow cytometry in (B) liver and (C) spleen and the results are shown as percentages from fixable live/dead stained viable CD4+ cells and representative of 3 individual experiments. (D) Serum concentration of IL-6, IFNg and IL-10 cytokines (pg/ml) were measured at 24h in the serum obtained by cardiac puncture following DT and CCL₄ treatment, determined by ELISA (n=5) along with (E) AST levels (n=4). The values are shown as the mean ± SEM and one-way ANOVA with Tukey’s multiple comparison test has been performed to show statistical significance, *P < 0.05, **P < 0.01.
Figure 3
Figure 3
IL-2 administration increases Foxp3+ cells in the liver and enhances Treg signature transcriptional characteristics. (A) Quantification of the proportion of Foxp3+ CD4+CD25+ cells in the liver (LV) (n>8), spleen (SP) (n>8), peripheral lymph nodes (pLN), lung (LU), adipose tissue (AT), blood (BL), mesenteric lymph nodes (mLN) and thymus (TY) (n=4). (B) Volcano plot shows difference in the transcriptome profile of intra-hepatic Tregs and T-effectors when IL-2 is administered in Foxp3YFP mice (n=3) using normalised p-value versus fold change of all 20515 genes and splenic “Treg signature” is defined by up-regulated (red) and down-regulated (blue) genes above p-value of 0.05 and Fold change 2. (C) Heatmap exhibits differences in the expression of pre-defined differentially expressed genes relevant to Treg function, tissue residency, tissue repair and metabolism between intra-hepatic and splenic Treg population following IL-2c administration, and the significance is determined above p-value of 0.05 and Fold-change 2 and represented by a *. (D) Gene set enrichment analysis of IL-2c treated intra-hepatic Tregs compared with the intra-hepatic Tregs in homeostasis. Dot plot shows the top 20 up-regulated GO pathways of biological processes, molecular functions and cellular components with an FDR adjusted q-value of 0.020506. Dot size represents the number of genes enriched in the pathway, and gene ratio represents the ratio of the count of core enrichment genes to count of pathway genes. (E, F) Flow cytometric analysis of the effect of IL-2 administration on the previously defined differentially expressed transcripts of CD4+Foxp3+ cells in liver and spleen tissue, expressed as MFI and percentage. Significance was determined by ordinary one-way ANOVA with Sidak’s multiple comparison test for (A) and two-way ANOVA with Tukey multiple comparison test for (E, F) and the values are shown as the mean ± SEM. For B-D, p<0.05 and Fold Change >2. MFI, geometric mean fluorescence intensity. Ns, non-significant *P < 0.05, **P < 0.01 and ****P < 0.0001.
Figure 4
Figure 4
IL-2c expanded intra-hepatic Tregs exhibit enhanced expression of immunoregulatory transcripts in the inflammation rich microenvironment. (A) Schematic representation of the experimental design to generate CCL₄ induced acute liver inflammation; IL-2c administered for 3 consecutive days, following by a single dose of CCL₄ injection and animals were sacrificed 24h later for the tissue analysis. (B) Gating strategy employed to identify CD4+CD25+Foxp3+ cells and their expression profile, including the staining controls. (C) Percentage of CD4+CD25+Foxp3+ cells were quantified in liver and spleen in homeostasis, following IL-2c administration, CCL₄ induced inflammation and IL-2c administration prior to CCL₄ induced inflammation (n=9) along with (D) the changes in the MFI of CD25. Immunoregulatory profile and stability of these CD4+Foxp3+ cells in liver and spleen were characterised using flow cytometry by quantifying percentage of (E) CTLA4 expression and MFI of cell surface markers (F) CD39 and (G) ST2. (H) Percentage of Chemokine receptor CXCR3 positive cells regulating the homing of cells and (I) MFI of proliferating cells expressed by KI67+. (J) Additionally, percentage expression of NUR77 was compared between liver resident and splenic CD4+Foxp3+ cells. All data were quantified using flow cytometry (n=4). The values are shown as the mean ± SEM and one-way ANOVA with Tukey’s multiple comparison test has been performed to show statistical significance, Ns= non-significant *P < 0.05, **P < 0.01 and ****P < 0.0001.
Figure 5
Figure 5
Characterisation of intra-hepatic cell subsets impacted by IL-2 administration and CCL₄ induced inflammation. (A) Absolute numbers of CD4+Foxp3- cells were quantified in liver and spleen in homeostasis, following IL-2c administration, CCL₄ induced inflammation and IL-2c administration prior to CCL₄ induced inflammation (n=5). (B) Percentage expression of NUR77 was compared between CD4+CD25+FOXP3+ Tregs and CD4+CD25+Foxp3- Effector T cells (n=4). (C) Additionally, these cell subsets were compared for changes in activation characterised by CTLA-4 and NUR77 expression and liver-specific regulation and homing seen by differences in ST2 and CXCR3 expression following CCL₄ alone or with IL-2 treatment, the plot is representative of 4 individual experiments (D) Gating strategy employed to characterise cell subsets. (E) Effect of CCL₄ induced liver injury with or without exogenous IL-2c on the percentage of CD8+ Effector T and NK cells in liver and spleen were summarised (n=4). (F) Changes in the hepatic non-parenchymal cell subsets were quantified by looking at the percentage abundance of Kupffer cells, Ly6Chi pro-inflammatory and Ly6Clo restorative macrophages following CCL₄ induced inflammation and exogenous IL-2c availability. The values are shown as the mean ± SEM and one-way ANOVA with Tukey’s multiple comparison test has been performed to show statistical significance. Ns, non-significant *P < 0.05, **P < 0.01, ***P < 0.001 and ****P < 0.0001.
Figure 6
Figure 6
Impact of IL-2 administration on the modulation of inflammatory state of liver. Inflammation of liver was quantified by performing qPCR analysis on the RNA isolated from liver biopsies, assessing the distinctive cytokine profile and liver infiltrate in liver inflammation. (A) The quantification of pro and anti-inflammatory cytokines secreted in the serum (n=3) and (B) RNA extracted from the inflamed liver (n=4). (C) Levels of serum ALT and AST were measured at the study endpoint at 24h post-injection (n=5). (D) H&E staining of liver sections examined via light microscopy at 20x magnification. Black arrows indicate regions of excessive immune infiltration, and greater intensity of pink reveal regions of hepatocyte necrosis. The values are shown as the mean ± SEM and one-way ANOVA with Tukey’s multiple comparison test has been performed to show statistical significance *P < 0.05, **P < 0.01, ***P < 0.001 and ****P < 0.0001.

References

    1. Sakaguchi S, Sakaguchi N, Asano M, Itoh M, Toda M. Immunologic self-tolerance maintained by activated T cells expressing IL-2 receptor alpha-chains (CD25) Breakdown of a single mechanism of self-tolerance causes various autoimmune diseases. J Immunol (1995) 155(3):1151–64. - PubMed
    1. Shevach E. Foxp3+ T regulatory cells: Still many unanswered questions–a perspective after 20 Years of study. Front Immunol (2018) 9. doi: 10.3389/fimmu.2018.01048 - DOI - PMC - PubMed
    1. Chen Y, Jeffery H, Hunter S, Bhogal R, Birtwistle J, Braitch M, et al. . Human intra-hepatic regulatory T cells are functional, require IL-2 from effector cells for survival, and are susceptible to fas ligand-mediated apoptosis. Hepatology (2016) 64(1):138–50. doi: 10.1002/hep.28517 - DOI - PMC - PubMed
    1. Setoguchi R, Hori S, Takahashi T, Sakaguchi S. Homeostatic maintenance of natural Foxp3+ CD25+ CD4+ regulatory T cells by interleukin (IL)-2 and induction of autoimmune disease by IL-2 neutralization. J Exp Med (2005) 201(5):723–35. doi: 10.1084/jem.20041982 - DOI - PMC - PubMed
    1. Lim T, Martinez-Llordella M, Kodela E, Gray E, Heneghan M, Sanchez-Fueyo A. Low-dose interleukin-2 for refractory autoimmune hepatitis. Hepatology (2018) 68(4):1649–52. doi: 10.1002/hep.30059 - DOI - PubMed

Publication types

Substances