

Systematic Pan-Cancer Analysis and Experimental Verification Identify FOXA1 as an Immunological and Prognostic Biomarker in Epithelial Ovarian Cancer
- PMID: 36393971
- PMCID: PMC9646314
- DOI: 10.1155/2022/9328972
Systematic Pan-Cancer Analysis and Experimental Verification Identify FOXA1 as an Immunological and Prognostic Biomarker in Epithelial Ovarian Cancer
Abstract
Background: Epithelial ovarian cancer (EOC) has the lowest survival rate among female reproductive cancers present with symptoms of aggressive malignancies, poor prognosis, drug resistance and postoperative recurrence. The majority of patients with EOC are diagnosed at an advanced stage due to the therapeutic challenges including lack of early diagnosis and effective therapeutic targets for EOC.
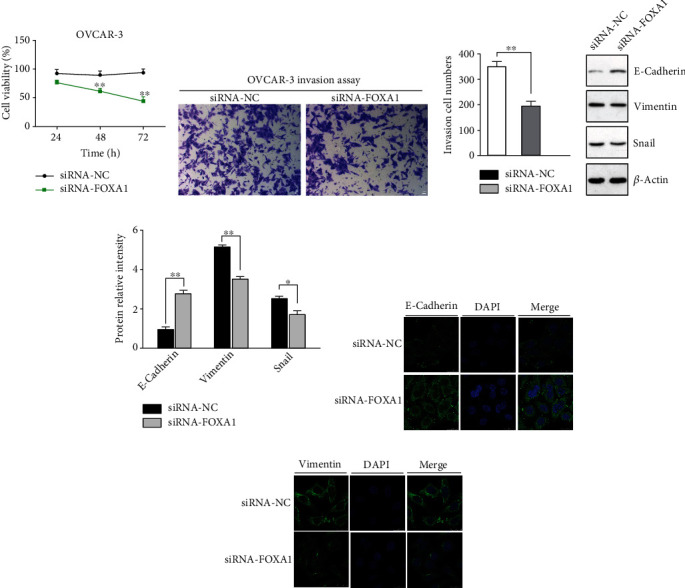
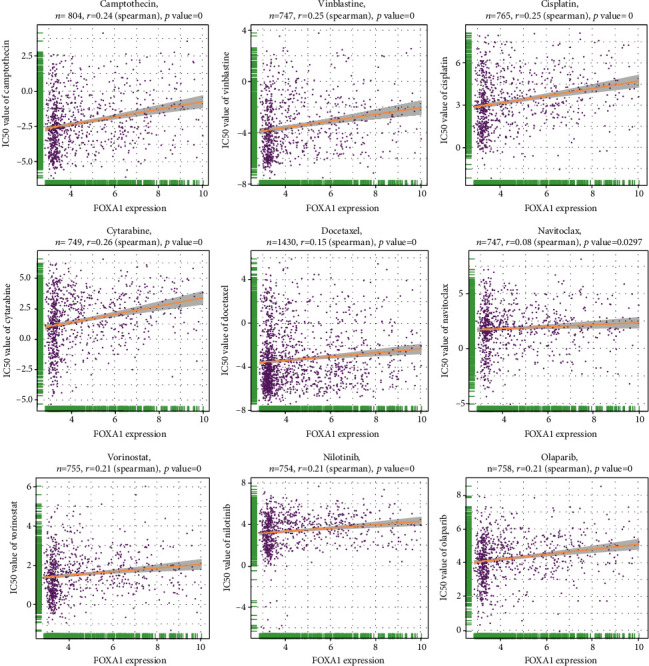
Methods: Pan-cancer analyses were performed to explore the features of forkhead-box (FOX) A1 (FOXA1) using data from TCGA and GTEx databases. R package "clusterprofiler" was used to perform the enrichment analysis of FOXA1 in EOC. Data downloaded from Drug Sensitivity in Cancer (GDSC) database were used to evaluate the association between FOXA1 and antitumor drug sensitivity. In experimental verification, FOXA1 expression was detected using qRT-PCR and western blot assays. Western blot, immunofluorescence staining, and Transwell assays were used to assess the influence of FOXA1 silencing on epithelial-mesenchymal transition (EMT) of EOC cells.
Results: We found that FOXA1 was highly expressed in EOC and predicted poorer survival of EOC patients. We observed that FOXA1 expression was positively correlated EMT-related pathways. Through experimental verification, we found the underlying function of FOXA1 to promote EMT in ovarian cancers. The results from western blot, immunofluorescence staining, and Transwell assays showed that FOXA1 silencing impeded the progression of EMT and invasiveness of the cancer cells. Furthermore, CCK-8 and invasion assays suggested that siRNA-FOXA1 attenuated the ability of cancer cells to metastasize and proliferate. Dual-luciferase reporter assays confirmed the binding activity of FOXA1 to the promoter of connective tissue growth factor (CTGF). In addition, we found that FOXA1 was closely correlated immunosuppressive microenvironment of EOC. High FOXA1 expression may contribute to the resistance of many anticancer drugs.
Conclusions: Our results predict and validate the function of FOXA1 in promoting EMT and the progression of disease in EOC. Targeting FOXA1 may improve the sensitivity of EOC treatment.
Copyright © 2022 Kai Wang et al.
Conflict of interest statement
The authors declare that they have no conflicts of interest with the contents of this article.
Figures


Similar articles
-
High FOXA1 immunohistochemical expression level associates with mucinous histology, favorable clinico-pathological prognostic parameters and survival advantage in epithelial ovarian cancer.Pathologica. 2021 Apr;113(2):102-114. doi: 10.32074/1591-951X-217. Pathologica. 2021. PMID: 34042091 Free PMC article.
-
FOXA1 can be modulated by HDAC3 in the progression of epithelial ovarian carcinoma.J Transl Med. 2022 Jan 6;20(1):19. doi: 10.1186/s12967-021-03224-3. J Transl Med. 2022. PMID: 34991620 Free PMC article.
-
A prognostic model based on immune-related long noncoding RNAs for patients with epithelial ovarian cancer.J Ovarian Res. 2022 Jan 15;15(1):8. doi: 10.1186/s13048-021-00930-w. J Ovarian Res. 2022. PMID: 35031063 Free PMC article.
-
From Defense to Disease: How the Immune System Fuels Epithelial-Mesenchymal Transition in Ovarian Cancer.Int J Mol Sci. 2025 Apr 24;26(9):4041. doi: 10.3390/ijms26094041. Int J Mol Sci. 2025. PMID: 40362280 Free PMC article. Review.
-
The role of diet, obesity and body composition in epithelial ovarian cancer development and progression: Mechanisms and therapeutic implications.Gynecol Oncol Rep. 2025 Mar 16;58:101718. doi: 10.1016/j.gore.2025.101718. eCollection 2025 Apr. Gynecol Oncol Rep. 2025. PMID: 40213527 Free PMC article. Review.
Cited by
-
Combination of theoretical analysis and experiments: Exploring the role of PLA2G7 in human cancers, including renal cancer.Heliyon. 2024 Mar 9;10(6):e27906. doi: 10.1016/j.heliyon.2024.e27906. eCollection 2024 Mar 30. Heliyon. 2024. PMID: 38509948 Free PMC article.
-
Progress of targeted FOX family therapy in ovarian cancer.Front Pharmacol. 2025 Jul 17;16:1604998. doi: 10.3389/fphar.2025.1604998. eCollection 2025. Front Pharmacol. 2025. PMID: 40746724 Free PMC article. Review.
-
Tremella fuciformis Polysaccharide Induces Apoptosis of B16 Melanoma Cells via Promoting the M1 Polarization of Macrophages.Molecules. 2023 May 11;28(10):4018. doi: 10.3390/molecules28104018. Molecules. 2023. PMID: 37241759 Free PMC article.
-
Identification of a disulfidptosis-related lncRNA signature for the prognostic and immune landscape prediction in head and neck squamous cell carcinoma.Discov Oncol. 2024 Mar 14;15(1):75. doi: 10.1007/s12672-024-00932-2. Discov Oncol. 2024. PMID: 38483698 Free PMC article.
-
Prognostic Model Construction of Disulfidptosis-Related Genes and Targeted Anticancer Drug Research in Pancreatic Cancer.Mol Biotechnol. 2025 Apr;67(4):1463-1482. doi: 10.1007/s12033-024-01131-8. Epub 2024 Apr 4. Mol Biotechnol. 2025. PMID: 38575817
References
-
- Zhao D., Zhang W., Li X. G., et al. The mRNA expression of BRCA1, ERCC1, TUBB3, PRR13 genes and their relationship with clinical chemosensitivity in primary epithelial ovarian cancer. Zhonghua Zhong liu za zhi [Chinese Journal of Oncology] . 2012;34(3):196–200. doi: 10.3760/cma.j.issn.0253-3766.2012.03.008. - DOI - PubMed
-
- Lavoro A., Scalisi A., Candido S., et al. Identification of the most common BRCA alterations through analysis of germline mutation databases: is droplet digital PCR an additional strategy for the assessment of such alterations in breast and ovarian cancer families? International Journal of Oncology . 2022;60(5):1–13. doi: 10.3892/ijo.2022.5349. - DOI - PMC - PubMed
MeSH terms
Substances
LinkOut - more resources
Full Text Sources
Medical
Miscellaneous
