. 2022 Oct 26:16:906735.
doi: 10.3389/fnhum.2022.906735. eCollection 2022.

Mental fatigue decreases complexity: Evidence from multiscale entropy analysis of instantaneous frequency variation in alpha rhythm

Affiliations

Mental fatigue decreases complexity: Evidence from multiscale entropy analysis of instantaneous frequency variation in alpha rhythm

Yawen Zhai et al. Front Hum Neurosci. .

Abstract

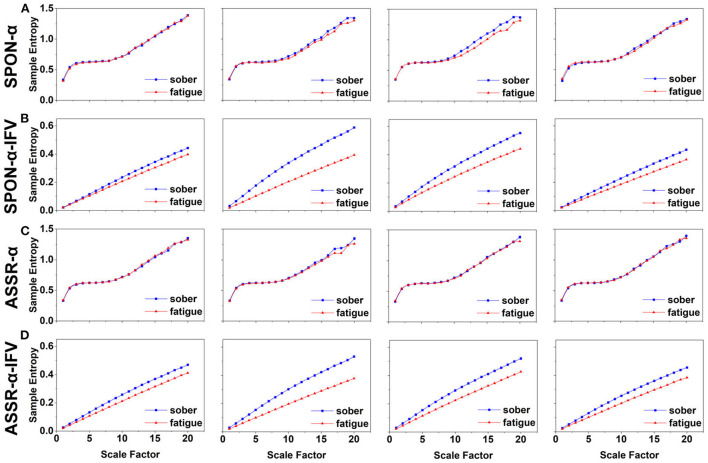
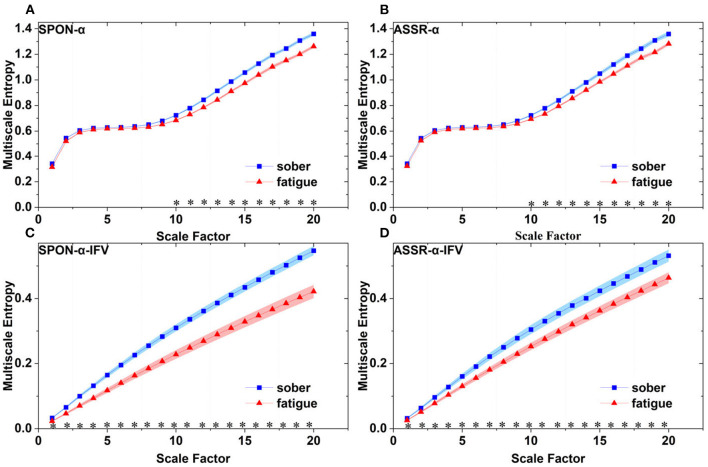
Mental fatigue (MF) jeopardizes performance and safety through a variety of cognitive impairments and according to the complexity loss theory, should represent "complexity loss" in electroencephalogram (EEG). However, the studies are few and inconsistent concerning the relationship between MF and loss of complexity, probably because of the susceptibility of brain waves to noise. In this study, MF was induced in thirteen male college students by a simulated flight task. Before and at the end of the task, spontaneous EEG and auditory steady-state response (ASSR) were recorded and instantaneous frequency variation (IFV) in alpha rhythm was extracted and analyzed by multiscale entropy (MSE) analysis. The results show that there were significant differences in IFV in alpha rhythm either from spontaneous EEG or from ASSR for all subjects. Therefore, the proposed method can be effective in revealing the complexity loss caused by MF in spontaneous EEG and ASSR, which may serve as a promising analyzing method to mark mild mental impairments.

Keywords: auditory steady-state response; complexity; mental fatigue; multiscale entropy; nonlinear analysis.


Conflict of interest statement

The authors declare that the research was conducted in the absence of any commercial or financial relationships that could be construed as a potential conflict of interest.

Figures

Figure 1
Figure 1
Experimental protocol. (A) Experimental flow diagram of EEG acquisition of spontaneous EEG (SPON) and auditory steady-state response (ASSR) in Sober and MF states. (B) Alpha rhythm extraction from SPON and ASSR with and without instantaneous frequency variation method (IFV), producing preprocessed four types of time series, SPON-α, SPON-α-IFV, ASSR-α, and ASSR-α-IFV, before they were analyzed by multiscale entropy methods (MSE) to compare Sober and MF states. (C) Schematic diagram of the coarse graining process, taking scale 2 and scale 3 as examples. (D) An example of MSE comparison.
Figure 2
Figure 2
MSE analysis of SPON-α (A), ASSR-α (B), SPON-α-IFV (C), and ASSR-α-IFV (D) on frontal lobe (channel F3) from four exemplary subjects. The blue and red lines represent the Sober and MF states, respectively. See Section 2.5 for the definitions of terms.
Figure 3
Figure 3
MSE analysis of SPON-α (A), ASSR-α (B), SPON-α-IFV (C), and ASSR-α-IFV (D) on parietal lobe (channel P4) from four exemplary subjects. The blue and red lines represent the Sober and MF states, respectively. See Section 2.5 for the definitions of terms.
Figure 4
Figure 4
MSE analysis of SPON-α (A), ASSR-α (B), SPON-α-IFV (C), and ASSR-α-IFV (D) on temporal lobe (channel T4) from four exemplary subjects. The blue and red lines represent the Sober and MF states, respectively. See Section 2.5 for the definitions of terms.
Figure 5
Figure 5
MSE analysis of SPON-α (A), ASSR-α (B), SPON-α-IFV (C), and ASSR-α-IFV (D) on occipital lobe (channel O1) from four exemplary subjects. The blue and red lines represent the Sober and MF states, respectively. See Section 2.5 for the definitions of terms.
Figure 6
Figure 6
Comparison of MSE from frontal lobe (channel F3) on: (A) alpha rhythm from spontaneous EEG (SPON-α), (B) alpha rhythm from ASSR (ASSR-α), (C) IFV in alpha rhythm from spontaneous EEG (SPON-α-IFV), and (D) IFV in alpha rhythm from ASSR (ASSR-α-IFV). The sign * indicates significance at p < 0.05. Shades indicate the standard errors.
Figure 7
Figure 7
Comparison of MSE from parietal lobe (channel P4) on: (A) alpha rhythm from spontaneous EEG (SPON-α), (B) alpha rhythm from ASSR (ASSR-α), (C) IFV in alpha rhythm from spontaneous EEG (SPON-α-IFV), and (D) IFV in alpha rhythm from ASSR (ASSR-α-IFV). The sign * indicates significance at p < 0.05. Shades indicate the standard errors.
Figure 8
Figure 8
Comparison of MSE from frontal lobe (channel T3) on: (A) alpha rhythm from spontaneous EEG (SPON-α), (B) alpha rhythm from ASSR (ASSR-α), (C) IFV in alpha rhythm from spontaneous EEG (SPON-α-IFV), and (D) IFV in alpha rhythm from ASSR (ASSR-α-IFV). The sign * indicates significance at p < 0.05. Shades indicate the standard errors.
Figure 9
Figure 9
Comparison of MSE from occipital lobe (channel O1) on: (A) alpha rhythm from spontaneous EEG (SPON-α), (B) alpha rhythm from ASSR (ASSR-α), (C) IFV in alpha rhythm from spontaneous EEG (SPON-α-IFV), and (D) IFV in alpha rhythm from ASSR (ASSR-α-IFV). The sign * indicates significance at p < 0.05. Shades indicate the standard errors.
Figure 10
Figure 10
Complexity loss rates of SPON-α, ASSR-α, SPON-α-IFV, and ASSR-α-IFV from all subjects and channels. See Section 2.5 for the definitions of terms. The sign * indicates significance at p < 0.05.

References

    1. Anderson D. J., Rose J. E., Hind J. E., Brugge J. F. (1971). Temporal position of discharges in single auditory nerve fibers within the cycle of a sine-wave stimulus: frequency and intensity effects. J. Acoust. Soc. Am. 49, 1131–1139. 10.1121/1.1912474 - DOI - PubMed
    1. Angelakis E., Lubar J. F., Stathopoulou S., Kounios J. (2004). Peak alpha frequency: an electroencephalographic measure of cognitive preparedness. Clin. Neurophysiol. 115, 887–897. 10.1016/j.clinph.2003.11.034 - DOI - PubMed
    1. Babiloni C., Frisoni G. B., Pievani M., Toscano L., Del Percio C., Geroldi C., et al. . (2008). White-matter vascular lesions correlate with alpha eeg sources in mild cognitive impairment. Neuropsychologia 46, 1707–1720. 10.1016/j.neuropsychologia.2008.03.021 - DOI - PubMed
    1. Battaglini L., Mena F., Ghiani A., Casco C., Melcher D., Ronconi L. (2020). The effect of alpha tacs on the temporal resolution of visual perception. Front. Psychol. 11, 1765. 10.3389/fpsyg.2020.01765 - DOI - PMC - PubMed
    1. Brenner C. A., Krishnan G. P., Vohs J. L., Ahn W.-Y., Hetrick W. P., Morzorati S. L., et al. . (2009). Steady state responses: electrophysiological assessment of sensory function in schizophrenia. Schizophr. Bull. 35, 1065–1077. 10.1093/schbul/sbp091 - DOI - PMC - PubMed

LinkOut - more resources