

Non-Invasive 3D Photoacoustic Tomography of Angiographic Anatomy and Hemodynamics of Fatty Livers in Rats
- PMID: 36394162
- PMCID: PMC9839842
- DOI: 10.1002/advs.202205759
Non-Invasive 3D Photoacoustic Tomography of Angiographic Anatomy and Hemodynamics of Fatty Livers in Rats
Abstract
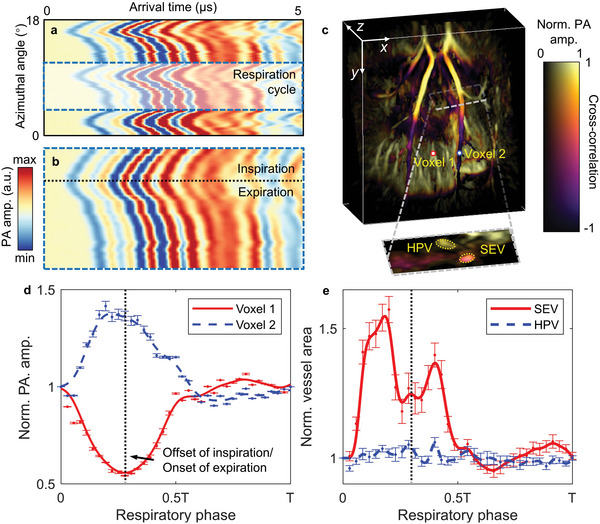
Non-alcoholic fatty liver disease is the most common liver disorder worldwide, which strongly correlates to obesity, diabetes, and metabolic syndromes. Complementary to mainstream liver diagnostic modalities, photoacoustic tomography (PAT) can provide high-speed images with functional optical contrast. However, PAT has not been demonstrated to study fatty liver anatomy with clear volumetric vasculatures. The livers of multiple rats are non-invasively imaged in vivo using the recently developed 3D PAT platform. The system provides isotropically high spatial resolution in 3D space, presenting clear angiographic structures of rat livers without injecting contrast agents. Furthermore, to quantitatively analyze the difference between the livers of lean and obese rats, the authors measured several PAT features and statistical differences between the two groups are observed. In addition to the anatomy, a time-gated strategy is applied to correct respiration-induced motion artifacts and extracted the hemodynamics of major blood vessels during the breathing cycles. This study demonstrates the capabilities of 3D-PAT to reveal both angiographic anatomy and function in rat livers, providing hematogenous information for fatty liver diagnosis. 3D-PAT, as a new tool for preclinical research, warrants further improvements to be transferred to human pediatric liver imaging.
Keywords: hepatic steatosis; liver imaging; non-alcoholic fatty liver; photoacoustic computed tomography.
© 2022 The Authors. Advanced Science published by Wiley-VCH GmbH.
Conflict of interest statement
The authors declare no conflict of interest.
Figures
Similar articles
-
Non-invasive photoacoustic computed tomography of rat heart anatomy and function.Light Sci Appl. 2023 Jan 3;12(1):12. doi: 10.1038/s41377-022-01053-7. Light Sci Appl. 2023. PMID: 36593252 Free PMC article.
-
High-speed three-dimensional photoacoustic computed tomography for preclinical research and clinical translation.Nat Commun. 2021 Feb 9;12(1):882. doi: 10.1038/s41467-021-21232-1. Nat Commun. 2021. PMID: 33563996 Free PMC article.
-
Rotational ultrasound and photoacoustic tomography of the human body.ArXiv [Preprint]. 2025 Apr 22:arXiv:2504.16036v1. ArXiv. 2025. PMID: 40313664 Free PMC article. Preprint.
-
Non-invasive assessment and quantification of liver steatosis by ultrasound, computed tomography and magnetic resonance.J Hepatol. 2009 Sep;51(3):433-45. doi: 10.1016/j.jhep.2009.05.023. Epub 2009 Jun 11. J Hepatol. 2009. PMID: 19604596 Review.
-
[Non-invasive assessment of fatty liver].Orv Hetil. 2015 Apr 5;156(14):543-51. doi: 10.1556/OH.2015.30123. Orv Hetil. 2015. PMID: 25819147 Review. Hungarian.
Cited by
-
Contrast Agent-Free 3D Renal Ultrafast Doppler Imaging Reveals Vascular Dysfunction in Acute and Diabetic Kidney Diseases.Adv Sci (Weinh). 2023 Dec;10(36):e2303966. doi: 10.1002/advs.202303966. Epub 2023 Oct 17. Adv Sci (Weinh). 2023. PMID: 37847902 Free PMC article.
-
Unsupervised disentanglement strategy for mitigating artifact in photoacoustic tomography under extremely sparse view.Photoacoustics. 2024 May 4;38:100613. doi: 10.1016/j.pacs.2024.100613. eCollection 2024 Aug. Photoacoustics. 2024. PMID: 38764521 Free PMC article.
-
Single-shot 3D photoacoustic computed tomography with a densely packed array for transcranial functional imaging.ArXiv [Preprint]. 2023 Jun 26:arXiv:2306.14471v1. ArXiv. 2023. PMID: 37426449 Free PMC article. Preprint.
-
Quantitative longitudinal investigation of non-alcoholic steatohepatitis in mice by photoacoustic microscopy.Photoacoustics. 2025 Jun 11;44:100741. doi: 10.1016/j.pacs.2025.100741. eCollection 2025 Aug. Photoacoustics. 2025. PMID: 40585319 Free PMC article.
-
Data-driven system matrix manipulation enabling fast functional imaging and intra-image nonrigid motion correction in tomography.bioRxiv [Preprint]. 2024 Jan 8:2024.01.07.574504. doi: 10.1101/2024.01.07.574504. bioRxiv. 2024. PMID: 38260429 Free PMC article. Preprint.
References
-
- Chalasani N., Younossi Z., Lavine J. E., Charlton M., Cusi K., Rinella M., Harrison S. A., Brunt E. M., Sanyal A. J., Hepatology 2018, 67, 328. - PubMed
-
- Younossi Z. M., Koenig A. B., Abdelatif D., Fazel Y., Henry L., Wymer M., Hepatology 2016, 64, 73. - PubMed
-
- Marjot T., Moolla A., Cobbold J. F., Hodson L., Tomlinson J. W., Endocr. Rev. 2020, 41, 66. - PubMed
MeSH terms
Substances
Grants and funding
LinkOut - more resources
Full Text Sources
Medical