Quantitative Assessment and Comparative Analysis of Longitudinal Lung CT Scans of Chest-Irradiated Nonhuman Primates
- PMID: 36394559
- PMCID: PMC9987082
- DOI: 10.1667/RADE-21-00225.1
Quantitative Assessment and Comparative Analysis of Longitudinal Lung CT Scans of Chest-Irradiated Nonhuman Primates
Abstract
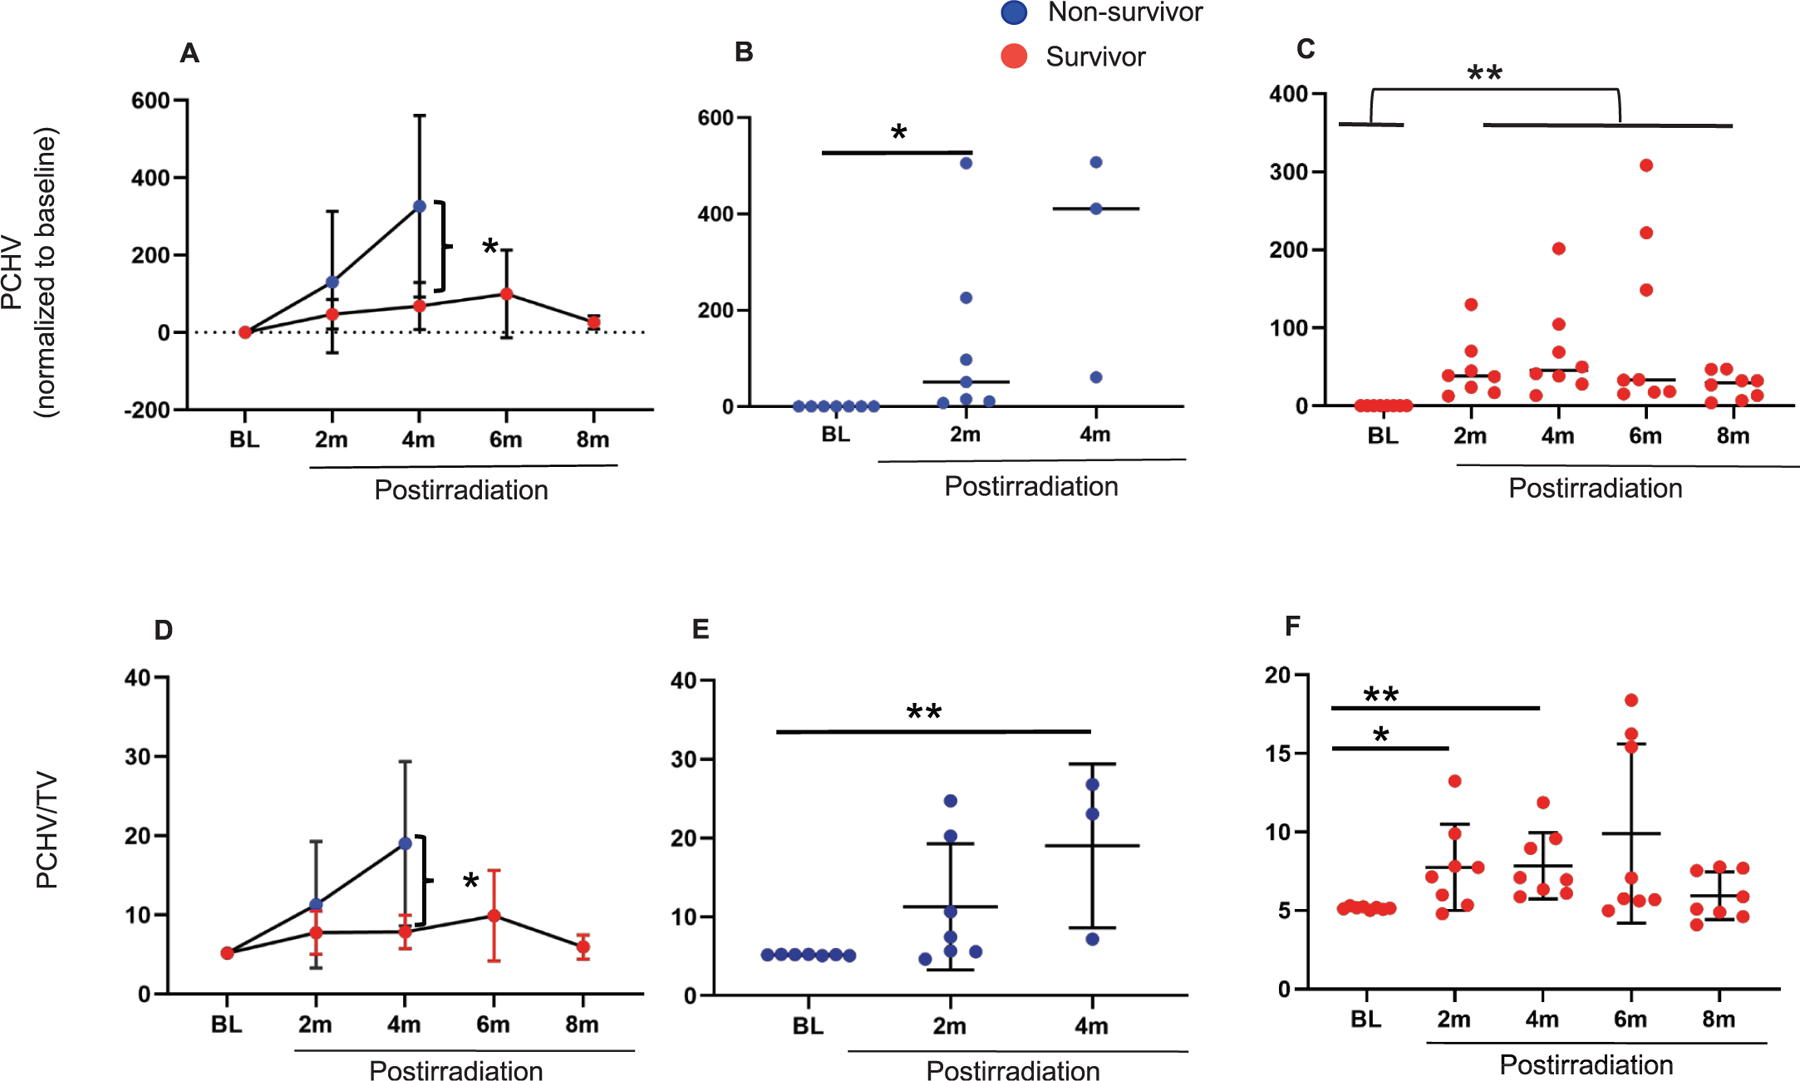
Computed tomography (CT) imaging has been used to diagnose radiation-induced lung injury for decades. However, histogram-based quantitative tools have rarely been applied to assess lung abnormality due to radiation-induced lung injury (RILI). Here, we used first-order summary statistics to derive and assess threshold measures extracted from whole lung histograms of CT radiodensity in rhesus macaques. For the present study, CT scans of animals exposed to 10 Gy of whole thorax irradiation were utilized from a previous study spanning 2-9 months postirradiation. These animals were grouped into survivors and non-survivors based on their clinical and experimental endpoints. We quantified the change in lung attenuation after irradiation relative to baseline using three density parameters; average lung density (ALD), percent change in hyper-dense lung volume (PCHV), hyperdense volume as a percent of total volume (PCHV/TV) at 2-month intervals and compared each parameter between the two irradiated groups (non-survivors and survivors). We also correlated our results with histological findings. All the three indices (ALD, PCHV, PCHV/TV) obtained from density histograms showed a significant increase in lung injury in non-survivors relative to survivors, with PCHV relatively more sensitive to detect early RILI changes. We observed a significant positive correlation between histologic pneumonitis scores and each of the three CT measurements, indicating that CT density is useful as a surrogate for histologic disease severity in RILI. CT-based three density parameters, ALD, PCHV, PCHV/TV, may serve as surrogates for likely histopathology patterns in future studies of RILI disease progression.
© 2023 by Radiation Research Society. All rights of reproduction in any form reserved.
Figures


Similar articles
-
The Time Course of Radiation-induced Lung Injury in a Nonhuman Primate Model of Partial-body Irradiation With Minimal Bone Marrow Sparing: Clinical and Radiographic Evidence and the Effect of Neupogen Administration.Health Phys. 2019 Mar;116(3):366-382. doi: 10.1097/HP.0000000000000968. Health Phys. 2019. PMID: 30624350
-
Clinicopathologic and Transcriptomic Analysis of Radiation-Induced Lung Injury in Nonhuman Primates.Int J Radiat Oncol Biol Phys. 2021 Sep 1;111(1):249-259. doi: 10.1016/j.ijrobp.2021.03.058. Epub 2021 Apr 20. Int J Radiat Oncol Biol Phys. 2021. PMID: 33848608 Free PMC article.
-
Acute Radiation-induced Lung Injury in the Non-human Primate: A Review and Comparison of Mortality and Co-morbidities Using Models of Partial-body Irradiation with Marginal Bone Marrow Sparing and Whole Thorax Lung Irradiation.Health Phys. 2020 Nov;119(5):559-587. doi: 10.1097/HP.0000000000001346. Health Phys. 2020. PMID: 33009295 Free PMC article. Review.
-
Detection and early phase assessment of radiation-induced lung injury in mice using micro-CT.PLoS One. 2012;7(9):e45960. doi: 10.1371/journal.pone.0045960. Epub 2012 Sep 24. PLoS One. 2012. PMID: 23029340 Free PMC article.
-
A Comparative Dose-response Relationship Between Sexes for Mortality and Morbidity of Radiation-induced Lung Injury in the Rhesus Macaque.Health Phys. 2019 Mar;116(3):354-365. doi: 10.1097/HP.0000000000000925. Health Phys. 2019. PMID: 30688697
Cited by
-
Radiation induced liver injury (RILI) evaluation using longitudinal computed tomography (CT) in image-guided precision murine radiotherapy.Precis Radiat Oncol. 2024 Nov 9;8(4):182-190. doi: 10.1002/pro6.1244. eCollection 2024 Dec. Precis Radiat Oncol. 2024. PMID: 40337459 Free PMC article.
References
-
- Mettler FA, Jr., Gus’kova AK, Gusev I, Health effects in those with acute radiation sickness from the Chernobyl accident. Health Phys 2007; 93, 462–9. - PubMed
Publication types
MeSH terms
Grants and funding
LinkOut - more resources
Full Text Sources