Association of Residential Racial and Economic Segregation With Cancer Mortality in the US
- PMID: 36394851
- PMCID: PMC9673024
- DOI: 10.1001/jamaoncol.2022.5382
Association of Residential Racial and Economic Segregation With Cancer Mortality in the US
Abstract
Importance: Residential segregation is a structural risk factor for poor cancer outcomes. Previous research examining the association of residential segregation with cancer outcomes was limited by older data, restricted geographic areas, and few cancer sites. To guide targeted interventions, a comprehensive evaluation of the association between segregation and cancer outcomes is needed.
Objective: To examine the association of residential racial and economic segregation with cancer mortality at the US county level for all cancers combined and for the 13 cancer types that represent the top 10 causes of cancer deaths in males or females.
Design, setting, and participants: This ecological study used county-level sociodemographic data from the 2015-2019 American Community Survey linked with 2015-2019 county-level mortality data. Data analysis was performed from September 2021 to April 2022.
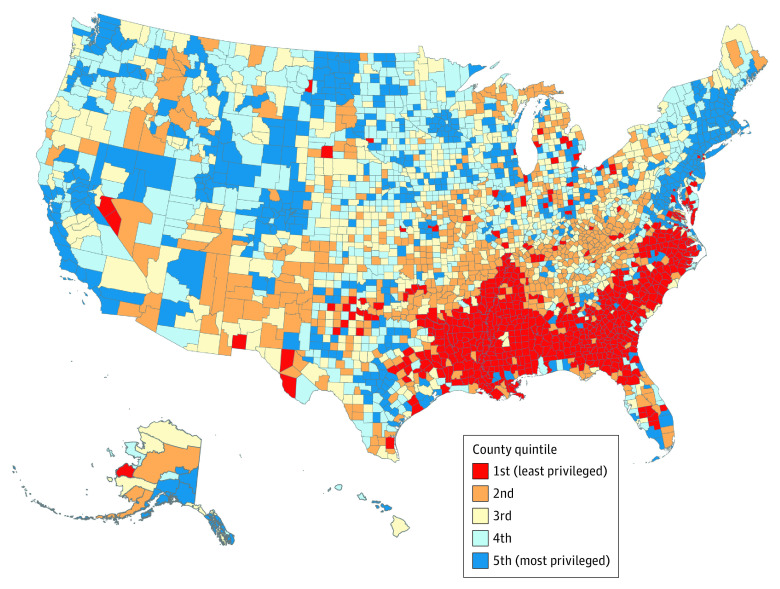
Exposures: Residential racial and economic segregation measured by the Index of Concentration at the Extremes (ICE) and categorized into quintiles 1 (most deprived) through 5 (most privileged).
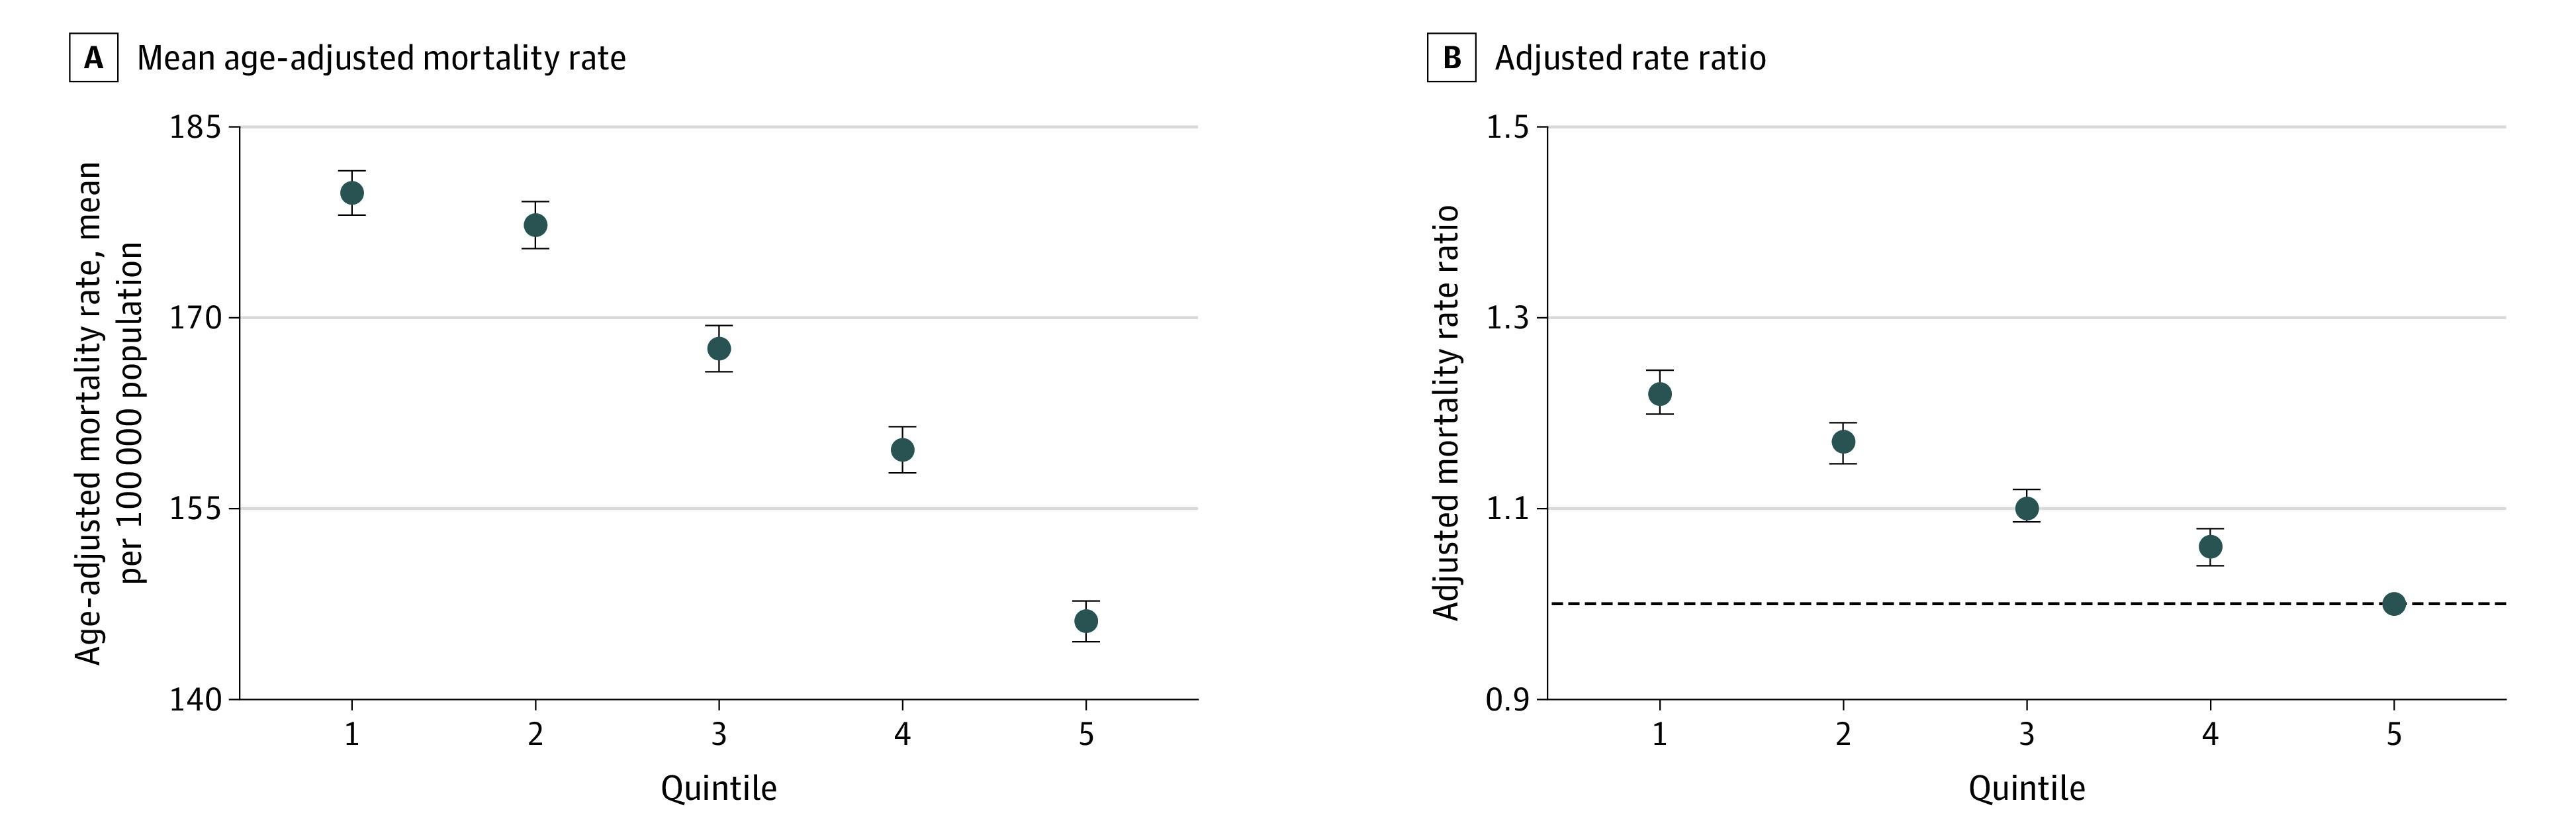
Main outcomes and measures: Age-adjusted cancer mortality was the outcome. Multilevel linear mixed modeling was used to calculate the adjusted mortality rate ratio (aRR).
Results: A total of 3110 counties were included. The age-adjusted mortality rates of all cancers combined were 179.8, 177.3, 167.6, 159.6, and 146.1 per 100 000 population (P < .001 for trend) for the 5 ICE categories (most deprived to least deprived), respectively. Compared with the least deprived counties, aRRs for all cancers combined were 1.22 (95% CI, 1.20-1.24) for the most deprived counties, followed by 1.17 (95% CI, 1.15-1.19), 1.10 (95% CI, 1.09-1.12), and 1.06 (95% CI, 1.04-1.08) for the other 3 quintiles, respectively (P < .001 for trend). Segregation was associated with increased mortality from 12 of 13 selected cancer sites, in which aRRs ranged from 1.06 (95% CI, 1.02-1.09) for brain and other nervous system cancer to 1.49 (95% CI, 1.43-1.54) for lung and bronchus cancer.
Conclusions and relevance: The findings of this ecological study suggest that residential racial and economic segregation is associated with higher cancer mortality at the county level, highlighting opportunities for geographically targeted cancer prevention and control efforts.
Conflict of interest statement
Figures
Comment in
-
Residential Racial and Economic Segregation and Cancer Mortality in the US-Speaking Out on Inequality and Injustice.JAMA Oncol. 2023 Jan 1;9(1):126-127. doi: 10.1001/jamaoncol.2022.5272. JAMA Oncol. 2023. PMID: 36394869 No abstract available.
References
Publication types
MeSH terms
LinkOut - more resources
Full Text Sources
Medical
Miscellaneous