. 2023 Jan 10;8(1):e158183.
doi: 10.1172/jci.insight.158183.

Aorta- and liver-generated TMAO enhances trained immunity for increased inflammation via ER stress/mitochondrial ROS/glycolysis pathways

Affiliations

Aorta- and liver-generated TMAO enhances trained immunity for increased inflammation via ER stress/mitochondrial ROS/glycolysis pathways

Fatma Saaoud et al. JCI Insight. .

Abstract

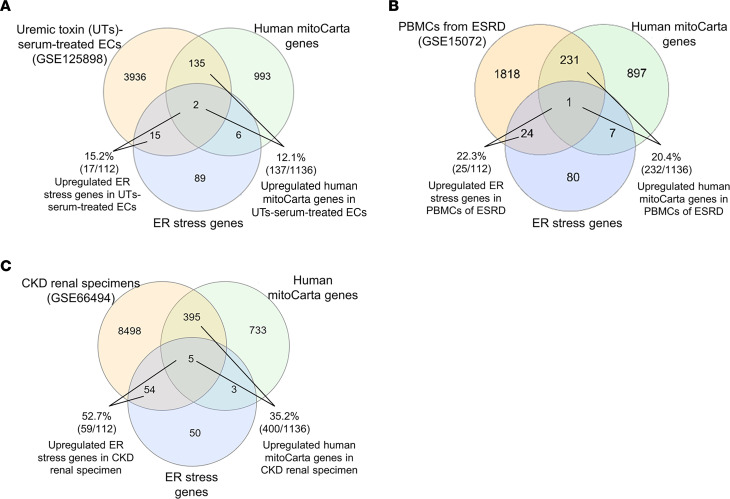
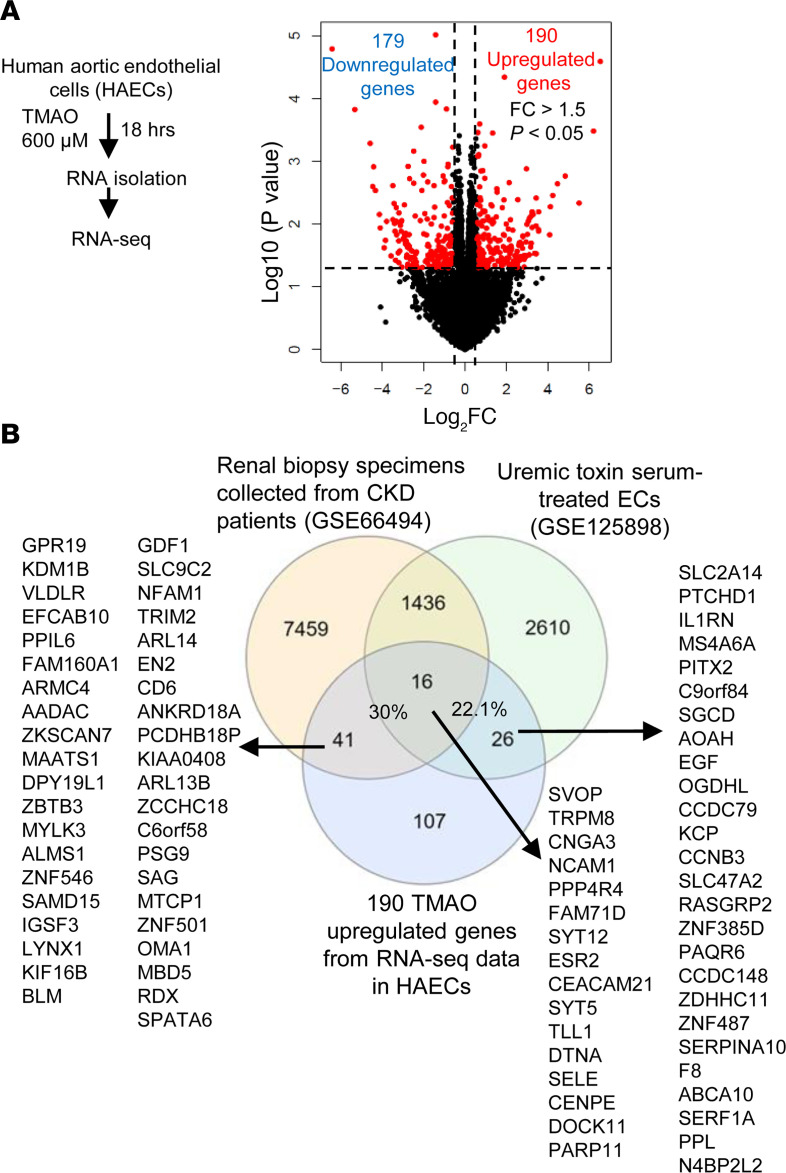
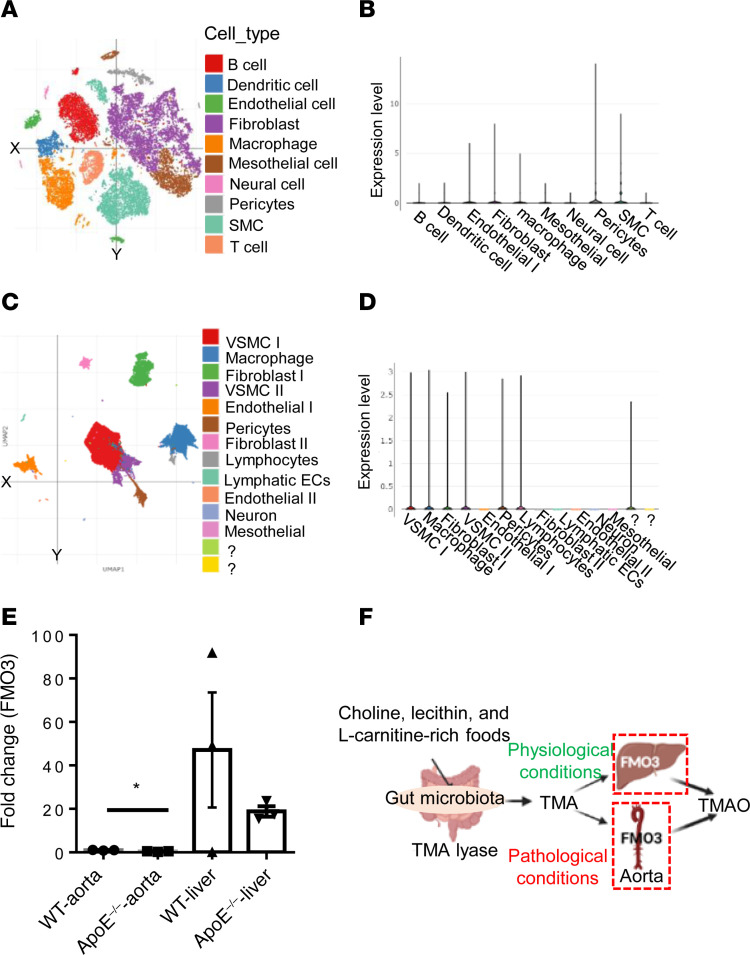
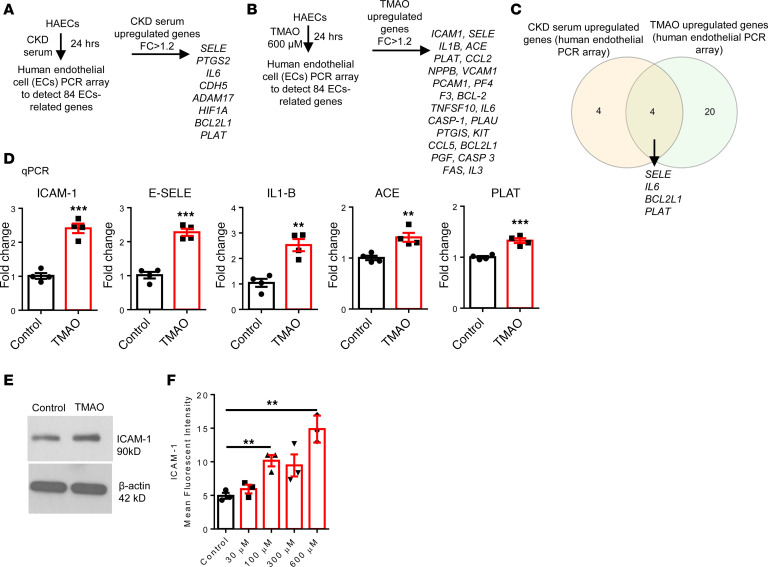
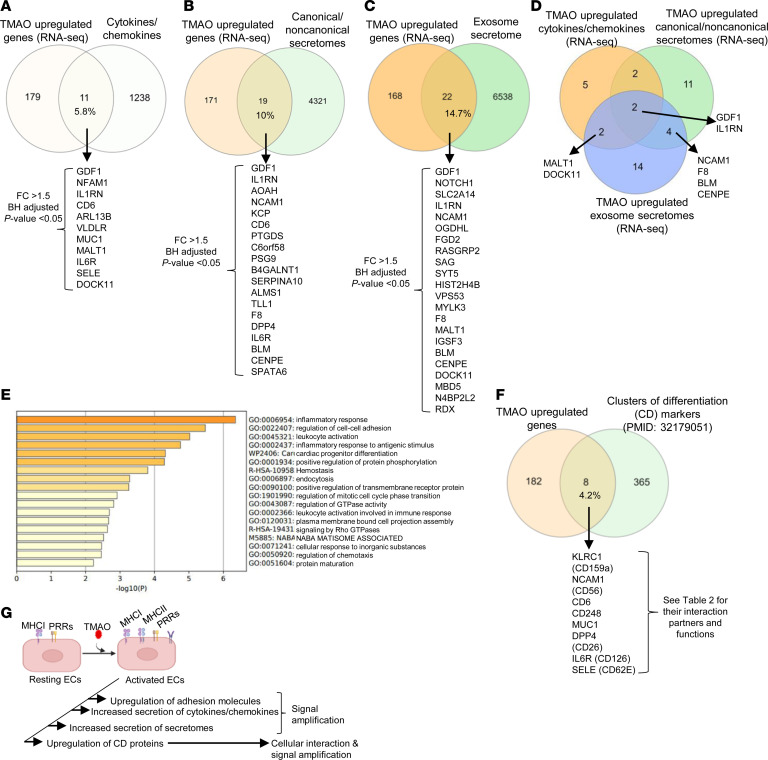
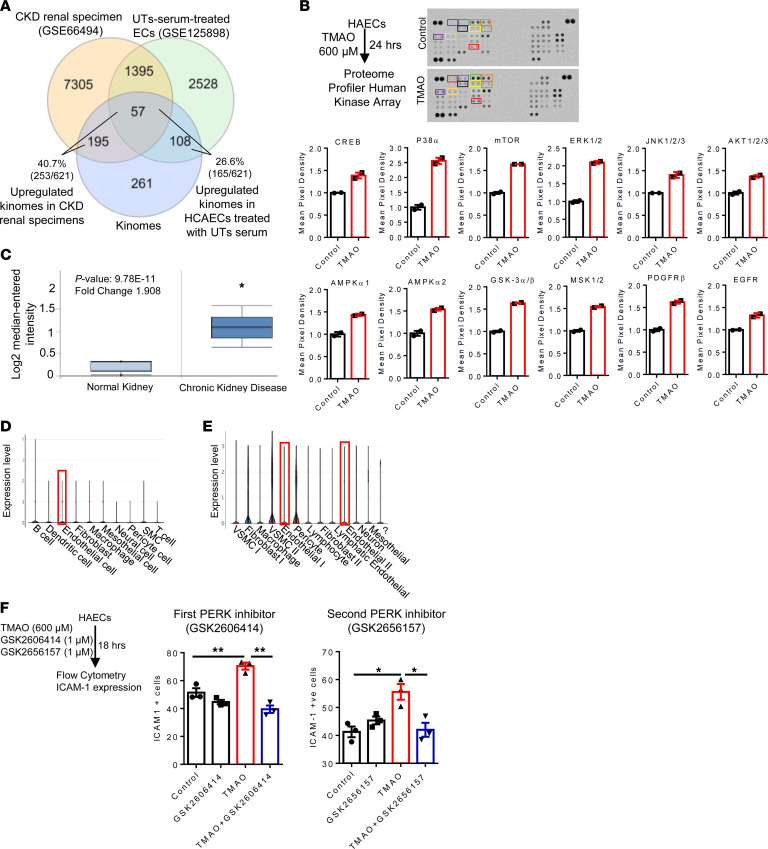
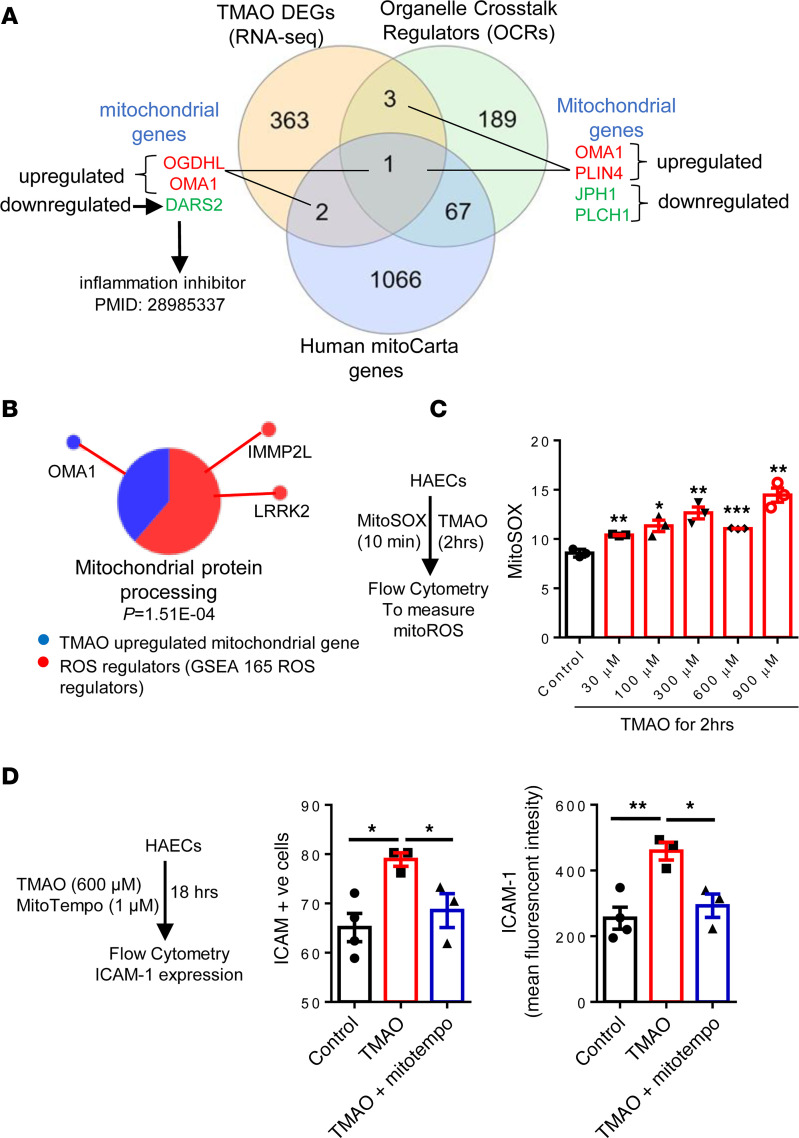
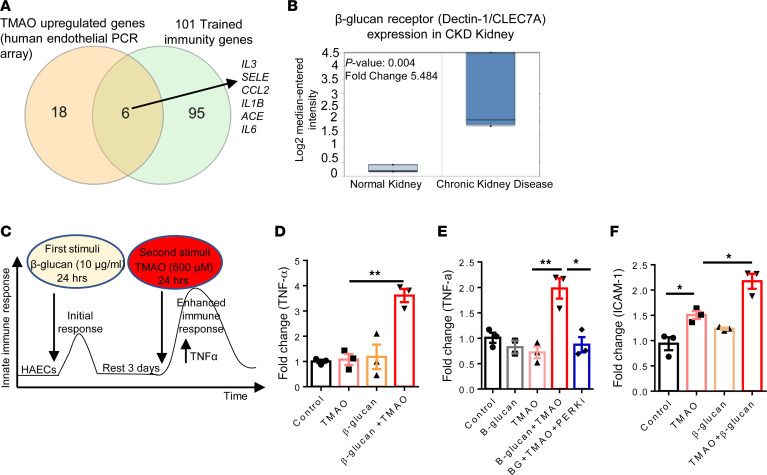
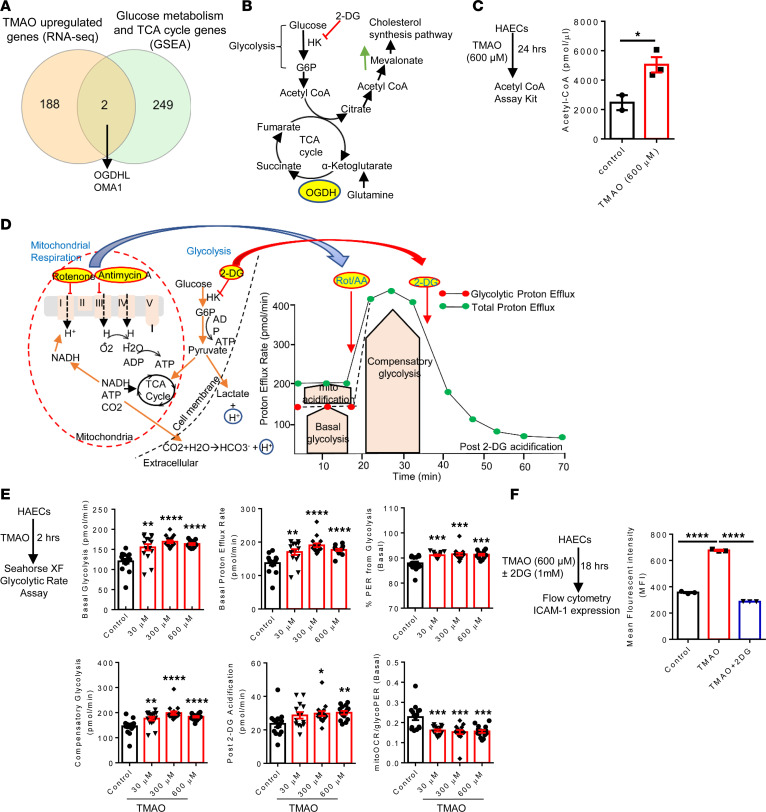
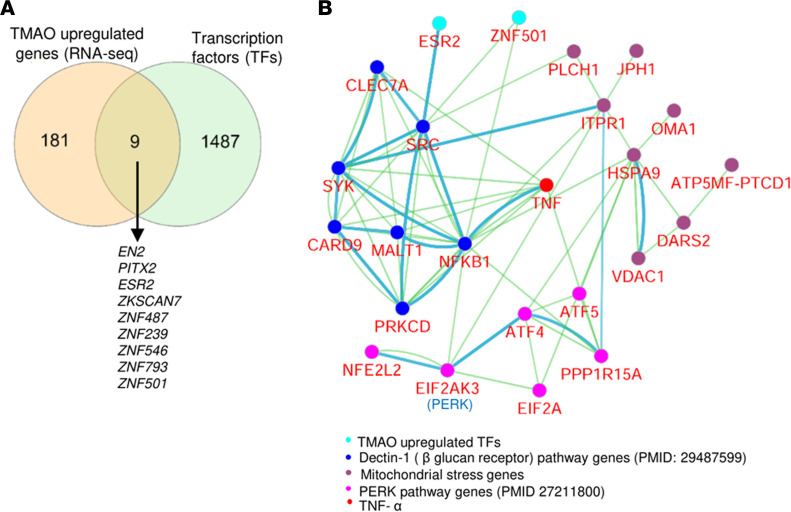
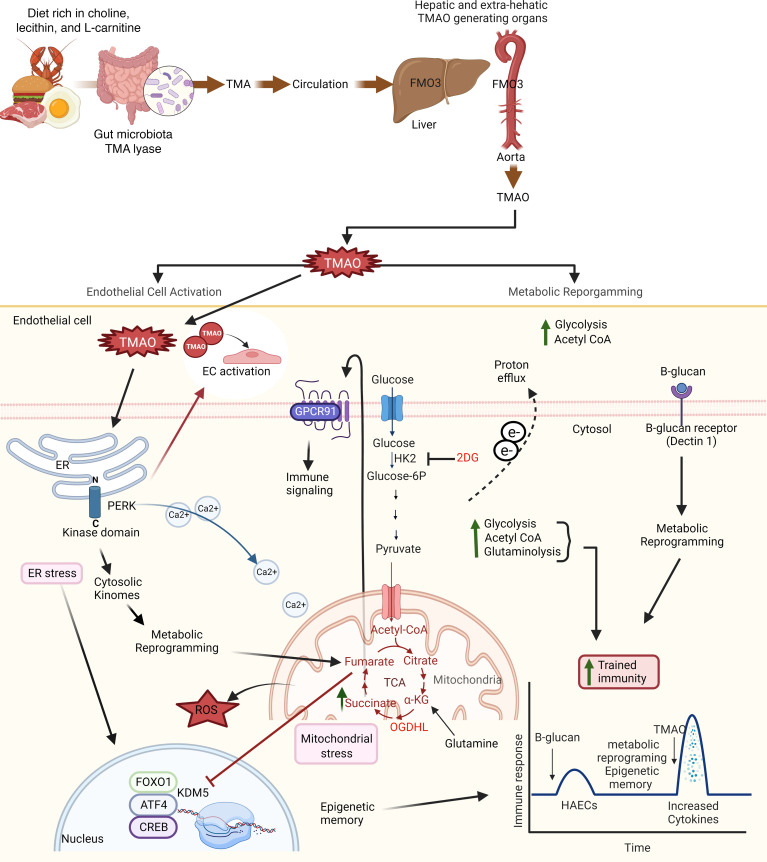
We determined whether gut microbiota-produced trimethylamine (TMA) is oxidized into trimethylamine N-oxide (TMAO) in nonliver tissues and whether TMAO promotes inflammation via trained immunity (TI). We found that endoplasmic reticulum (ER) stress genes were coupregulated with MitoCarta genes in chronic kidney diseases (CKD); TMAO upregulated 190 genes in human aortic endothelial cells (HAECs); TMAO synthesis enzyme flavin-containing monooxygenase 3 (FMO3) was expressed in human and mouse aortas; TMAO transdifferentiated HAECs into innate immune cells; TMAO phosphorylated 12 kinases in cytosol via its receptor PERK and CREB, and integrated with PERK pathways; and PERK inhibitors suppressed TMAO-induced ICAM-1. TMAO upregulated 3 mitochondrial genes, downregulated inflammation inhibitor DARS2, and induced mitoROS, and mitoTEMPO inhibited TMAO-induced ICAM-1. β-Glucan priming, followed by TMAO restimulation, upregulated TNF-α by inducing metabolic reprogramming, and glycolysis inhibitor suppressed TMAO-induced ICAM-1. Our results have provided potentially novel insights regarding TMAO roles in inducing EC activation and innate immune transdifferentiation and inducing metabolic reprogramming and TI for enhanced vascular inflammation, and they have provided new therapeutic targets for treating cardiovascular diseases (CVD), CKD-promoted CVD, inflammation, transplantation, aging, and cancer.

Keywords: Cardiovascular disease; Chronic kidney disease; Immunology; Inflammation; Innate immunity.


Conflict of interest statement

Conflict of interest: The authors have declared that no conflict of interest exists.

Figures

Figure 1
Figure 1. Some ER stress genes were coupregulated with MitoCarta genes in UT serum–treated HCAECs, PBMCs from ESRD patients, and CKD renal specimens.
(A) CKD upregulated 15.2% of ER stress genes (PMID: 30027602, 18039139) and 12.1% of MitoCarta genes in UT serum–treated HCAECs. A complete gene list is shown in Supplemental Table 1A. (B) ESRD (GSE15072) upregulated 22.3% of ER stress genes and 20.4% of MitoCarta genes in PBMCs. A complete gene list is shown in Supplemental Table 1B. (C) CKD (GSE66494) upregulated 52.7% of ER stress genes and 35.2% of MitoCarta genes in CKD renal specimens. A complete gene list is shown the Supplemental Table 1C.
Figure 2
Figure 2. TMAO significantly reshaped transcriptome and upregulated 190 genes in human aortic endothelial cells (HAECs).
(A) HAECs were treated with TMAO (600 μM) for 18 hours, and RNAs were collected for RNA-Seq (n = 3). The volcano plots showed the differentially expressed genes with P < 0.05 and FC > 1.5. TMAO significantly upregulated 190 and downregulated 179 genes. (B) In total, 30% of TMAO-upregulated genes were upregulated in CKD renal specimens and 22.1% of TMAO-upregulated genes were upregulated in UT serum–treated HCAECs.
Figure 3
Figure 3. Extrahepatic expression of FMO3.
scRNA-Seq data show that flavin-containing dimethylaniline monooxygenase 3 (FMO3) was expressed in the human aortic cells and aorta cells from mice fed with HFD, and aorta of WT and ApoE–/– mice. (A) Single-cell transcriptome analysis of the ascending aortas of HFD-fed mice identified 10 cell types including ECs, fibroblasts, SMCs, B cells, T cells, macrophages, DCs, mesothelial cells, pericytes, and neural cells. (B) FMO3 expression in the aortic cells of HFD-fed mice. (C) Single-cell transcriptome analysis showed 12 cell types identified in the human thoracic aorta. (D) FMO3 expression in the human aortic cells. The data mining analyses were performed on the scRNA-Seq database of the Broad Institute of MIT and Harvard. (E) Real-time PCR showed the FMO3 expression in the aorta and liver of WT and ApoE–/– mice (n = 3 samples in each group and each sample containing aortas and liver from 2 mice). (F) Schematic diagram showing the TMAO biogenesis under physiological conditions in liver tissue; however, the pathological conditions transform the aorta into TMAO-generating tissue (t test; *P < 0.05).
Figure 4
Figure 4. TMAO induces HAEC activation.
HAECs were treated with pooled serum from 3 healthy individuals or 3 patients with CKD and TMAO (600 μM) for 24 hours. A human EC PCR array was used to detect 84 EC genes. (A) CKD serum upregulated 8 genes. (B) TMAO upregulated 24 genes. (C) Four EC genes overlapped between CKD serum– and TMAO-upregulated genes. (D) Real-time PCR analysis to verify some of the TMAO-upregulated genes (n = 4). (E) Western blot showed ICAM-1 expression. (F) Flow cytometry analysis shows that TMAO upregulated ICAM-1 expression (n = 3; each experiment was repeated 3 times). Data are represented as the mean ± SEM (t test; **P < 0.01, ***P < 0.001).
Figure 5
Figure 5. TMAO activated and transdifferentiated HAECs into innate immune cells by upregulating 24 EC genes and adhesion molecules; 40 cytokines, chemokines, and secretome genes; and 8 CDs.
(AC) RNA-Seq data show that TMAO significantly upregulated 11 cytokines/chemokines, 19 canonical/noncanonical secretomes, and 22 exosome secretomes. (D) The overlap between TMAO-upregulated cytokines/chemokines, canonical/noncanonical secretomes, and exosome secretomes. (E) Metascape pathway analysis showed the top pathways of the TMAO-upregulated 11 cytokines/chemokines, 19 canonical/noncanonical secretomes, and 22 exosome secretomes. (F) TMAO upregulated 8 CDs. (G) Schematic diagram showing resting and activated/transdifferentiated ECs by upregulating adhesion molecules, cytokines/chemokines, secretomes, and CDs to increase cellular interaction and signal amplification. The Benjamini-Hochberg Procedure (BH) was used to calculate the adjusted P value.
Figure 6
Figure 6. TMAO activated the phosphorylation of 12 kinases, which were integrated with PERK pathways, and PERK inhibitor suppressed TMAO-upregulated ICAM-1.
(A) CKD renal specimen upregulated 40.6% and UT serum upregulated 26.6% kinomes; P < 0.05. (B) Human phosphokinase array was performed following the manufacturer’s instructions. HAECs were treated with TMAO for 24 hours. Protein was pooled from 3 wells (n = 2). TMAO activated the phosphorylation of 12 kinases. The variations of the manufacturer’s designated positive control (PC) spots between each array were used to determine the CI of nonspecific variations between samples. (C) PERK (EIF2AK3) expression in 61 CKD kidneys from the human microarray data set (Nephroseq), FC = 1.9 and P = 9.78 × 10⁻¹¹. (D and E) PERK expression in different cells of the ascending aorta of HFD mice and human thoracic aorta. The data mining analyses were performed on the scRNA-Seq database of the Broad Institute of MIT and Harvard. (F) ICAM-1 expression in HAECs treated with TMAO and 2 PERK inhibitors (GSK2606414 and GSK2656157) were quantified using flow cytometry. The quantitative data of the ICAM-1+ cell in each group is presented (n = 3). The experiment was repeated 3 times. Data are represented as the mean ± SEM (t test; *P < 0.05, **P < 0.01).
Figure 7
Figure 7. TMAO upregulated PLIN4, OMA1, and OGDHL and downregulated DARS2, and it induced mitoROS and mitoROS inhibitor inhibited TMAO-induced ICAM-1.
(A) RNA-Seq data show that TMAO significantly modulated the expression of 4 organelle crosstalk regulators (OCRs) with 2 upregulated genes, PLIN4 and OMA1, and 2 downregulated genes, JPH1 and PLCH1; TMAO upregulated 2 MitoCarta genes, OGDHL and OMA1, and downregulated DARS2. (B) Cytoscape analysis showed the connection between TMAO-upregulated mitochondrial gene (OMA1) and 2 ROS regulators (GSEA). (C) TMAO induces mitoROS. HAECs were treated with different TMAO concentrations for 2 hours. Then cells were loaded with MitoSOX, and MitoSOX was detected by flow cytometry (n = 3 for each group); the experiment was repeated 3 times. (D) Overproduction of mitoROS contributes to TMAO-induced EC activation. HAECs were treated with TMAO (600 μM) and mitoTempo (1 μM) for 18 hours. ICAM-1+ cell and mean fluorescence intensity (MFI) were detected using flow cytometry analysis (n = 3 for each group; the experiment was repeated 3 times). Data are represented as the mean ± SEM (t test; *P < 0.05, **P < 0.01, ***P < 0.001).
Figure 8
Figure 8. β-Glucan and TMAO induced trained immunity in HAECs.
(A) TMAO (EC PCR array) upregulated 6 trained immunity–related genes. (B) Dectin-1/CLEC7A expression in 61 CKD kidneys (microarray data). FC = 5.48, P = 0.004. (C) Trained immunity experimental design. HAECs were primed with β-glucan (10 μg/mL) for 24 hours, rested for 3 days, and restimulated with TMAO (600 μM). Real-time PCR was used to detect TNF-α expression. (D and F) TMAO increased ICAM-1 expression (F) and TNF-α expression (D) after priming with β-glucan. (E) PERK inhibitor reduced TNF-α expression (n = 3); each experiment was repeated 3 times. Data are represented as the mean ± SEM. (t test; *P < 0.05, **P < 0.01).
Figure 9
Figure 9. TMAO induced immune metabolic reprogramming — including increased acetyl-CoA, glycolysis, and proton efflux rates — and glycolysis inhibitor suppressed TMAO-induced ICAM-1 expression.
(A) TMAO upregulated 2 glucose metabolism/TCA cycle genes (OGDHL and OMA1). (B) OGDHL is a key step in the TCA cycle and glycolysis pathways. (C) TMAO increased acetyl-CoA generation. HAECs were treated with TMAO (600 μM) for 24 hours, and acetyl CoA production was detected using acetyl-CoA assay kit (n = 3) following the manufacturer’s instruction. (D) The principle and profile of Seahorse glycolytic rate assay. In the cells, energy is produced by 2 different pathways, including mitochondrial respiration and glycolysis. In the glycolysis pathway, glucose is converted into lactate, and the protons are extruded into the extracellular media and detected as extracellular acidification rate (ECAR). In addition, CO2 produced by the mitochondrial TCA cycle extruded into the extracellular space and increases ECAR. First, the inhibition of mitochondrial complex I and III by rotenone and antimycin A (Rot/AA) resulted in the reduced rate of proton efflux from respiration, which is calculated and removed from the total proton efflux rate results in glycolytic proton efflux rate (glycoPER). Second, glycolysis inhibitor 2-DG (hexokinase, HK2 inhibitor) is injected to stop glycolytic acidification and confirm pathway specificity. (E) Our experimental design (n = 16 wells/group). The 6 glycolysis parameters were measured in this assay, including basal glycolysis, basal proton efflux rate, percentage of PER from glycolysis, compensatory glycolysis, post–2-DG acidification, and mitoOCR/glycoPER. (F) Inhibition of glycolysis reduced TMAO-induced EC activation (n = 3; the experiment was repeated 3 times). Data are represented as the mean ± SEM (t test; *P < 0.05, **P < 0.01, ***P < 0.001, ****P < 0.0001).
Figure 10
Figure 10. TMAO-upregulated transcription factors were functionally connected to mitochondrial genes, dectin-1 pathway genes, and TNF-α to potentiate immune responses.
(A) TMAO upregulated 9 transcription factors (TFs). (B) Cytoscape pathway analysis showed the network connection between Dectin-1 pathway genes, TNF-α, PERK pathway genes, mitochondrial stress genes, and TMAO-upregulated TFs.
Figure 11
Figure 11. Our working model.
Schematic figure showed that TMA is generated by gut microbiota from choline-, lecithin-, and L-carnitine protein–rich diet and is reabsorbed into blood circulation via the portal vein. Then, TMA goes to the liver and other organs, including the aorta, where it can be oxidized by FMO3 to generate TMAO. TMAO binds to the PERK receptor in the ER lumen. PERK connects ER stress in the lumen of ER via its cytosolic kinase domain to cytosolic kinome, CREB, FoxO1, and ATF4 to induce cytosolic stress, mitochondrial stress, and metabolic reprogramming, including increased glycolysis, acetyl-CoA generation, OGDHL-driven glutaminolysis, succinate accumulation, and fumarate accumulation, leading to OMA1-driven mitochondrial fragmentation and switches OXPHOS to glycolysis to establish trained immunity. Created with BioRender.com.

References

    1. Yang XF, et al. Vascular inflammation and atherogenesis are activated via receptors for PAMPs and suppressed by regulatory T cells. Drug Discov Today Ther Strateg. 2008;5(2):125–142. doi: 10.1016/j.ddstr.2008.11.003. - DOI - PMC - PubMed
    1. Drummer Ct, et al. Trained immunity and reactivity of macrophages and endothelial cells. Arterioscler Thromb Vasc Biol. 2021;41(3):1032–1046. doi: 10.1161/ATVBAHA.120.315452. - DOI - PMC - PubMed
    1. Shao Y, et al. Endothelial immunity trained by coronavirus infections, DAMP stimulations and regulated by anti-oxidant NRF2 may contribute to inflammations, myelopoiesis, COVID-19 cytokine storms and thromboembolism. Front Immunol. 2021;12:653110. doi: 10.3389/fimmu.2021.653110. - DOI - PMC - PubMed
    1. Shao Y, et al. Vascular endothelial cells and innate immunity. Arterioscler Thromb Vasc Biol. 2020;40(6):e138–e152. - PMC - PubMed
    1. Mai J, et al. An evolving new paradigm: endothelial cells--conditional innate immune cells. J Hematol Oncol. 2013;6:61. doi: 10.1186/1756-8722-6-61. - DOI - PMC - PubMed

Publication types

Substances