Synchondrosis fusion contributes to the progression of postnatal craniofacial dysmorphology in syndromic craniosynostosis
- PMID: 36394990
- PMCID: PMC9919486
- DOI: 10.1111/joa.13790
Synchondrosis fusion contributes to the progression of postnatal craniofacial dysmorphology in syndromic craniosynostosis
Abstract
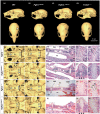
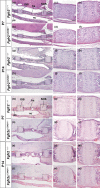
Syndromic craniosynostosis (CS) patients exhibit early, bony fusion of calvarial sutures and cranial synchondroses, resulting in craniofacial dysmorphology. In this study, we chronologically evaluated skull morphology change after abnormal fusion of the sutures and synchondroses in mouse models of syndromic CS for further understanding of the disease. We found fusion of the inter-sphenoid synchondrosis (ISS) in Apert syndrome model mice (Fgfr2S252W/+ ) around 3 weeks old as seen in Crouzon syndrome model mice (Fgfr2cC342Y/+ ). We then examined ontogenic trajectories of CS mouse models after 3 weeks of age using geometric morphometrics analyses. Antero-ventral growth of the face was affected in Fgfr2S252W/+ and Fgfr2cC342Y/+ mice, while Saethre-Chotzen syndrome model mice (Twist1+/- ) did not show the ISS fusion and exhibited a similar growth pattern to that of control littermates. Further analysis revealed that the coronal suture synostosis in the CS mouse models induces only the brachycephalic phenotype as a shared morphological feature. Although previous studies suggest that the fusion of the facial sutures during neonatal period is associated with midface hypoplasia, the present study suggests that the progressive postnatal fusion of the cranial synchondrosis also contributes to craniofacial dysmorphology in mouse models of syndromic CS. These morphological trajectories increase our understanding of the progression of syndromic CS skull growth.
Keywords: Apert syndrome; Crouzon syndrome; Saethre-Chotzen syndrome; coronal suture; craniosynostosis; geometric morphometrics; inter-sphenoid synchondrosis; midfacial hypoplasia.
© 2022 Anatomical Society.
Conflict of interest statement
The authors declare no competing or financial interests.
Figures


Similar articles
-
Further analysis of the Crouzon mouse: effects of the FGFR2(C342Y) mutation are cranial bone-dependent.Calcif Tissue Int. 2013 May;92(5):451-66. doi: 10.1007/s00223-013-9701-2. Epub 2013 Jan 29. Calcif Tissue Int. 2013. PMID: 23358860 Free PMC article.
-
PIN1 Attenuation Improves Midface Hypoplasia in a Mouse Model of Apert Syndrome.J Dent Res. 2020 Feb;99(2):223-232. doi: 10.1177/0022034519893656. Epub 2019 Dec 23. J Dent Res. 2020. PMID: 31869252
-
Overexpression of Fgfr2c causes craniofacial bone hypoplasia and ameliorates craniosynostosis in the Crouzon mouse.Dis Model Mech. 2018 Nov 9;11(11):dmm035311. doi: 10.1242/dmm.035311. Dis Model Mech. 2018. PMID: 30266836 Free PMC article.
-
Clinicogenetic study of Turkish patients with syndromic craniosynostosis and literature review.Pediatr Neurol. 2014 May;50(5):482-90. doi: 10.1016/j.pediatrneurol.2014.01.023. Epub 2014 Jan 11. Pediatr Neurol. 2014. PMID: 24656465 Review.
-
Syndromic craniosynostosis: from history to hydrogen bonds.Orthod Craniofac Res. 2007 May;10(2):67-81. doi: 10.1111/j.1601-6343.2007.00389.x. Orthod Craniofac Res. 2007. PMID: 17552943 Review.
Cited by
-
Cyclic loading failed to promote growth in a pig model of midfacial hypoplasia.J Anat. 2024 Dec;245(6):879-893. doi: 10.1111/joa.14043. Epub 2024 Apr 1. J Anat. 2024. PMID: 38562033
-
A novel framework for elucidating the effect of mechanical loading on the geometry of ovariectomized mouse tibiae using principal component analysis.Front Bioeng Biotechnol. 2024 Oct 22;12:1469272. doi: 10.3389/fbioe.2024.1469272. eCollection 2024. Front Bioeng Biotechnol. 2024. PMID: 39502499 Free PMC article.
-
Evolution, conservatism and overlooked homologies of the mammalian skull.Philos Trans R Soc Lond B Biol Sci. 2023 Jul 3;378(1880):20220081. doi: 10.1098/rstb.2022.0081. Epub 2023 May 15. Philos Trans R Soc Lond B Biol Sci. 2023. PMID: 37183902 Free PMC article. Review.
-
Unravelling the difference in craniofacial morphology of Yucatan miniature and standard pigs during postnatal ontogeny.Proc Biol Sci. 2025 Aug;292(2053):20251646. doi: 10.1098/rspb.2025.1646. Epub 2025 Aug 20. Proc Biol Sci. 2025. PMID: 40829657 Free PMC article.
-
A physico-mechanical model of postnatal craniofacial growth in human.iScience. 2024 Jul 29;27(9):110617. doi: 10.1016/j.isci.2024.110617. eCollection 2024 Sep 20. iScience. 2024. PMID: 39220256 Free PMC article.
References
-
- Adams, D.C. , Rohlf, F.J. & Slice, D.E. (2004) Geometric morphometrics: ten years of progress following the ‘revolution’. The Italian Journal of Zoology, 71, 5–16.
-
- Boulet, S.L. , Rasmussen, S.A. & Honein, M.A. (2008) A population‐based study of craniosynostosis in metropolitan Atlanta, 1989–2003. American Journal of Medical Genetics. Part A, 146A(8), 984–991. - PubMed
-
- Bourgeois, P. , Bolcato‐Bellemin, A.L. , Danse, J.M. , Bloch‐Zupan, A. , Yoshiba, K. , Stoetzel, C. et al. (1998) The variable expressivity and incomplete penetrance of the twist‐null heterozygous mouse phenotype resemble those of human Saethre‐Chotzen syndrome. Human Molecular Genetics, 7(6), 945–957. - PubMed
Publication types
MeSH terms
Substances
Grants and funding
LinkOut - more resources
Full Text Sources
Miscellaneous

