

doi: 10.1371/journal.pcbi.1010649.
eCollection 2022 Nov.
Molecular source attribution
Affiliations
- PMID: 36395093
- PMCID: PMC9671344
- DOI: 10.1371/journal.pcbi.1010649
Item in Clipboard
Molecular source attribution
PLoS Comput Biol.
.
No abstract available
Conflict of interest statement
We have no competing interests to declare.
Figures
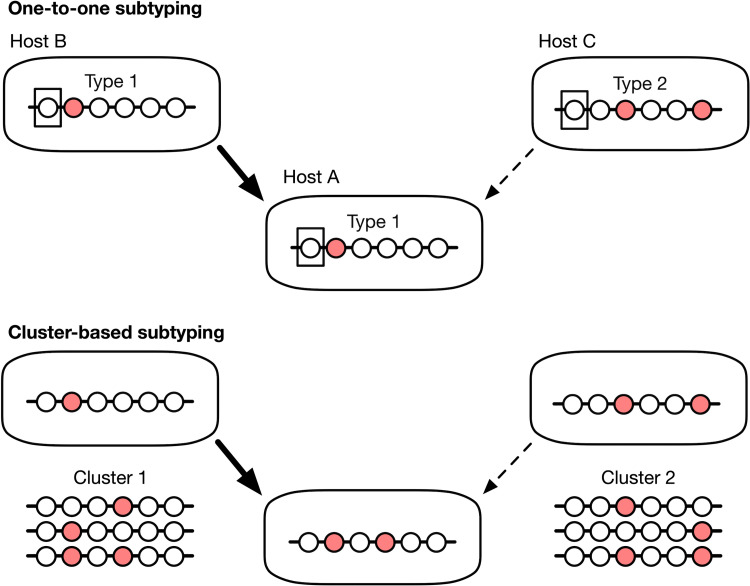
Each set of circles along a line segment represents a molecular sequence from an individual infection. Circles are coloured to differentiate sequences. (top) Under one-to-one subtyping, every unique sequence represents a different subtype. This strategy is more common single-locus typing or pathogens with a relatively slow rate of evolution, which limits the variation that accumulates over time. (bottom) With cluster-based subtyping, multiple sequences are assigned to the same subtype. This strategy is favoured under multi-locus or whole-genome sequencing or rapidly evolving pathogens, where every sampled infection may have a unique sequence.
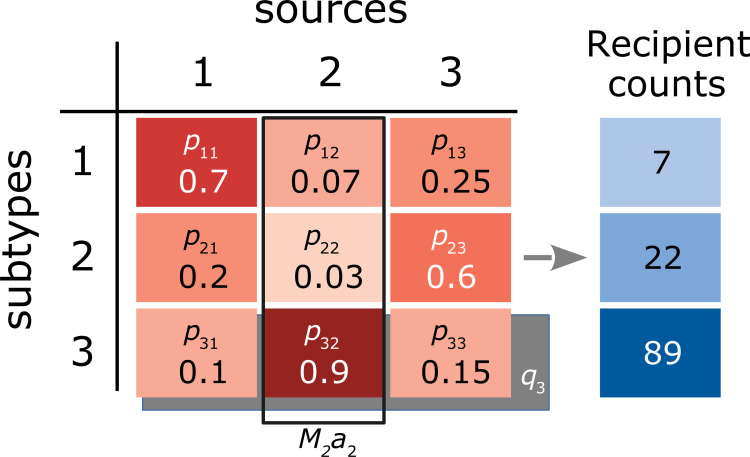
Arbitrary numbers are provided for observed quantities, such as the proportion of infections due to subtype 1 in source population 2 (p12). The marginal effect associated with source population 2 (a2) is represented by an open rectangle (solid line); while the total size of this source population M2 is observed, a2 must be estimated by regression. Similarly, the marginal effect associated with subtype 3 (q3), indicated by a rectangular shaded region) is simultaneously estimated by regression.
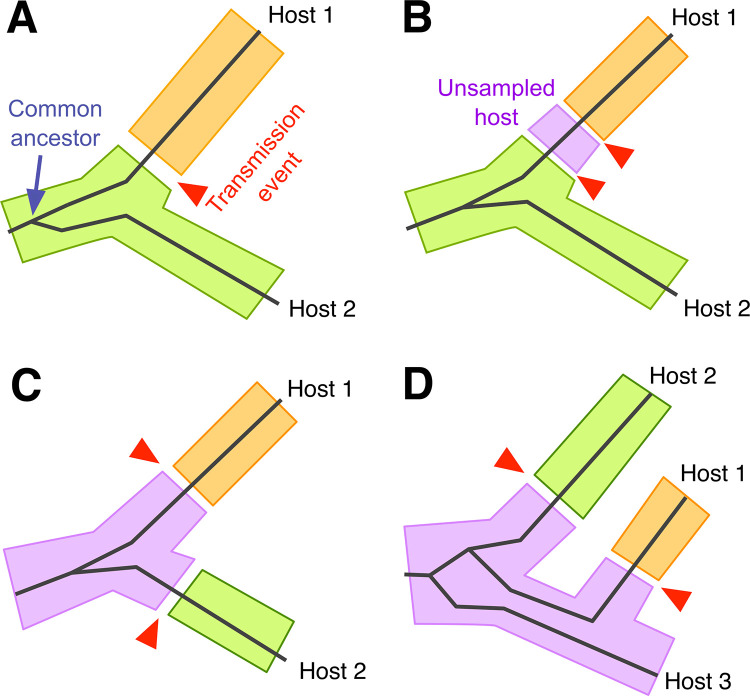
The solid lines represent the phylogenetic relationship between infections that have been sampled from two or three different hosts. Shaded regions correspond to the location of virus lineages in different hosts, as indicated by colour. The transmission of a lineage from one host to another is represented by a gap between shaded regions and highlighted with a red arrow. (A) Although hosts 1 and 2 are closely related, the phylogeny does not indicate whether the infection was transmitted from host 2 to 1 (as shown), or vice versa. The transmission event may be located anywhere along the two branches connecting the hosts. (B) An infection may have been transmitted through any number of unsampled hosts before reaching the host that was sampled. (C) An unsampled host may be the source of infections transmitted to both hosts 1 and 2. (D) If pathogens establish a large diverse population within each host, the branches of the phylogeny may occur in a different order than the transmission history; as shown, hosts 1 and 3 are more closely related in the transmission history, but not in the phylogeny.
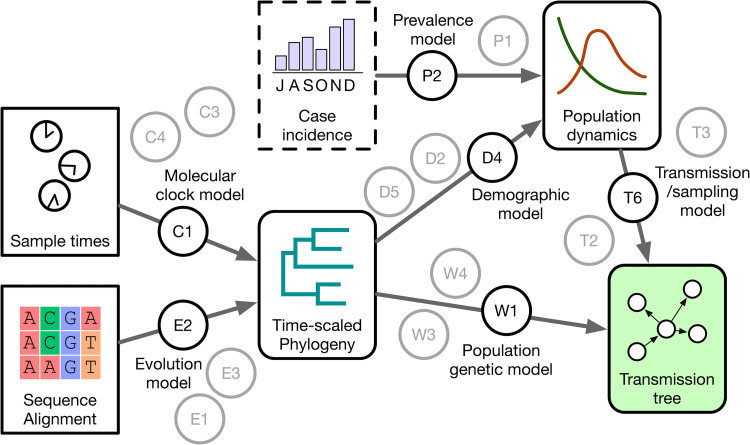
This diagram summarizes the structure of a phylodynamic analysis as a hierarchical Bayesian model . Rectangular nodes represent data sources (sequence alignment, sample collection times), and nodes with rounded corners represent parameter estimates (fitted models) that can in turn be used as data inputs for a subsequent model. Each arrow represents a model inference step that generates samples from the posterior distribution defined by the data and the model. The model associated with each step is represented by a circular node; each model comprises a number of prior beliefs . This schematic displays multiple model nodes to emphasize the existence of other models with different assumptions and prior beliefs that are not necessarily evaluated on the data.
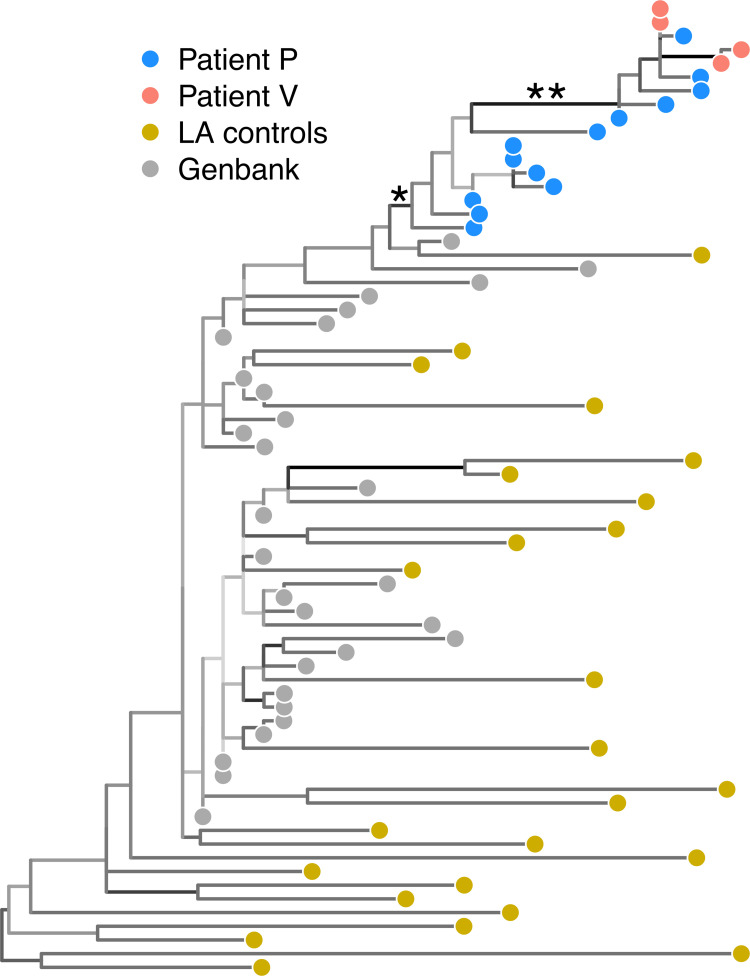
This unrooted tree was reconstructed by maximum likelihood from published HIV-1 RT sequences from Metzker et al. [78] and supplemented with additional sequences from Genbank. Tips representing sequences are coloured by source (see legend), and branches are coloured by bootstrap support (darker shades indicate higher support). The branch (labelled ’*’) separating sequences from both patients P and V from the "background" sequences, including the original LA (Louisiana) control sequences from the study, had a support of 95%. The branch (labelled ’**’) cited by the study as evidence that sequences from patient V were nested within a paraphyletic group of sequences from patient P had a support of 100%.
References
Publication types
MeSH terms
Grants and funding
LinkOut - more resources
Full Text Sources
Medical
